Reading view

5 ways data centers endanger their local communities and the country as a whole

An Amazon data center sits next to a neighborhood in northern Virginia. Nathan Howard/Getty Images

Every internet search, streamed video and AI-generated response depends on a data center somewhere. Driven by rapid growth in artificial intelligence, cloud computing and cryptocurrency, data centers have become the backbone of the modern digital economy. But though their key role is in enabling virtual and remote experiences, data centers are physical buildings in real communities around the nation and the globe.

The United States hosts more than 4,000 data centersmore than any other country. The U.S. Department of Energy expects that, taken together, all U.S. data centers will consume as much as 12% of all U.S. electricity by 2028. In 2023, data centers consumed about 4.4% of total U.S. electricity – roughly 176 terawatt-hours.

In the U.S., Virginia has more data centers than any other state – over 600, two-thirds of which are in the northern Virginia suburbs of Washington, D.C. In 2023, the state’s data centers consumed about 26% of Virginia’s total electricity supply – a higher share than in any other state.

We study science communication, climate science and public health, so we wanted to understand how data centers in Virginia affect the people who live near them and the broader public.

We found that the data centers that already exist affect nearby residents and the nation as a whole in five main areas: air quality, water quality, noise levels, land use and energy costs.
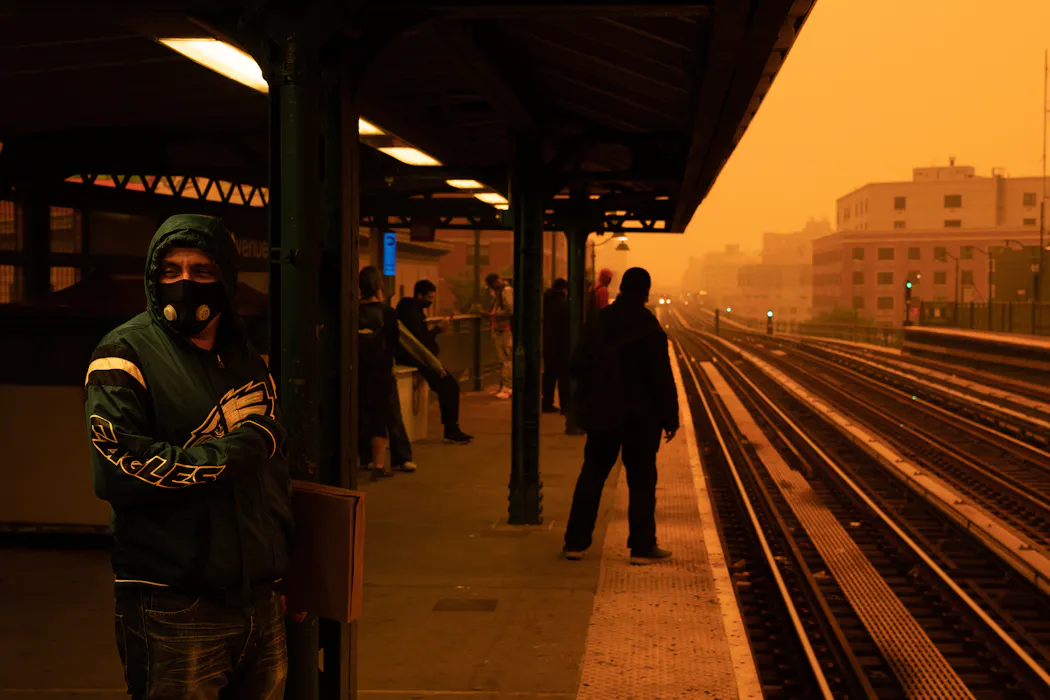
Metal boxes are in a line next to a much larger building.
A row of generators sits alongside a data center building in northern Virginia. Andrew Caballero-Reynolds/AFP via Getty Images

Air pollution

Data centers generally operate 24/7 and consume enormous amounts of electricity, which must be generated somewhere – either near the data center or farther away.

When fossil fuels are burned to generate that power, they emit a wide range of air pollutants, including those linked to lung disease, cardiovascular disease, stroke and neurological conditions. They also emit heat-trapping pollution that causes global warming and climate change, which, in turn, worsens air pollution further.

Generating power for U.S. data centers in 2023 emitted the equivalent of 2.2% of the nation’s greenhouse gas emissions. Other air pollutants emitted from fossil-fuel combustion are associated with increased risk of ADHD and autism in children and risks of Parkinson’s and Alzheimer’s diseases in older adults.

Unless the energy powering data centers comes from clean energy sources, such as solar, wind or geothermal, generating that electricity also pollutes the air. People who live near fossil-fuel burning power plants, whether in communities that also host data centers or in distant states, are exposed to air pollution. And during electrical outages, on-site diesel generators kick in, releasing large amounts of air pollution that can harm data center employees and nearby residents alike.

Water consumption and pollution

Data centers require vast quantities of water to cool their servers. Globally, they are projected to consume between 4.2 billion and 6.6 billion cubic meters of water annually by 2027. In the United States, data centers already rank among the top 10 industrial water users.

In northern Virginia, data center water use has risen sharply. In Loudoun County alone, just northwest of D.C., potable water use by data centers more than doubled between 2019 and 2023, while facilities across northern Virginia consumed nearly 2 billion gallons of water in 2023.

This demand can strain local rivers, aquifers and municipal water systems, even in regions like the mid-Atlantic that are not usually prone to drought, but especially in regions like the U.S. Southwest that face persistent droughts.

Rows of small equipment boxes sit atop the roof of a commercial building.
Cooling fans on data center roofs can spread noise and vibrations. Andrew Caballero-Reynolds/AFP via Getty Images

Noise pollution

Data centers’ continuous operation means that cooling systems, including air chillers and cooling fans, generate a persistent humming sound around the clock – as do any generators that are in use to provide power.

In northern Virginia, some residents have complained about an industrial-scale “drone” or “hum.” Measurements at the data centers that were the subject of complaints found noise levels were between 40 and 59 decibels on residential property.

Those noise levels are quieter than a conversation with someone 3 feet away and not loud enough to damage people’s hearing or violate local noise ordinances. But they are close to levels the EPA says reduce people’s ability to work, sleep and exercise. Some people have complained that data center noise has given them trouble sleeping and concentrating, and some have said they avoid using their homes’ outdoor spaces, where the noise is louder.

A construction site with many trucks and several cranes.
A data center under construction in Ashburn, Va., in November 2025. Andrew Caballero-Reynolds/AFP via Getty Images

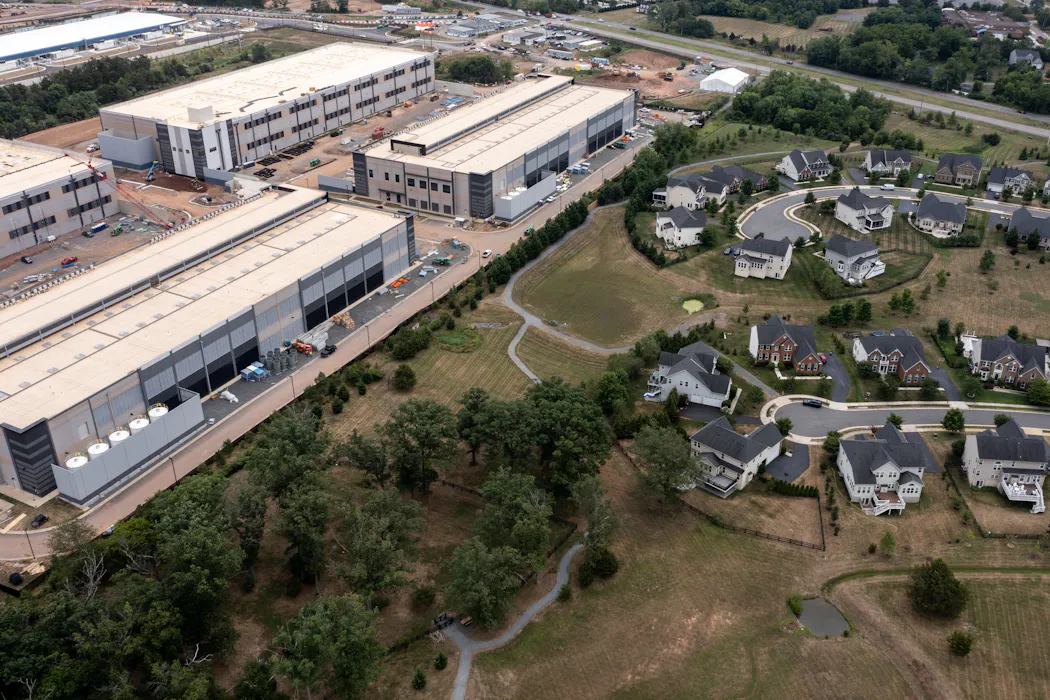
Land use and community well-being

Data center expansion often targets land near green spaces, agricultural areas or rural communities where developers can secure affordable land with access to existing electricity supplies.

Converting green space into industrial facilities can diminish health benefits associated with being in and near natural environments, including opportunities for physical activity and improved mental well-being.

In Virginia, residents living near data center construction have reported increased exposure to truck traffic and diesel exhaust, which can contribute to respiratory and cardiovascular health risks, especially in children and older adults. While these effects are typical of large construction projects, they can be amplified when several data centers are clustered together.

In places like Prince William County, Virginia, developers have proposed data centers on roughly 2,400 acres of undeveloped land in the Rural Crescent, an area designated by the county’s planners to remain relatively undeveloped. Those data centers could transform open space and rural farmland into industrial zones, disrupting communities with long-standing ties to the land.

Electrical transmission equipment sits in an area near a large commercial building.
Data centers use large amounts of electricity. Andrew Caballero-Reynolds/AFP via Getty Images

Rising energy costs

As data centers increase electricity demand, they put upward pressure on energy prices across the grid. A 2024 Virginia legislative report found that the state’s typical residential electricity bill could rise by $14 to $37 per month by 2040 because of grid strain tied to data center growth – a 9% to 25% increase over current average bills, and a figure that does not factor in potential inflation.

These higher costs are paid by all consumers, but they place a greater burden on families that are most economically distressed, who also tend to have more health problems. Lower-income families spend a higher share of their budget on electricity, and when bills rise, the consequences can include reduced access to adequate heating and cooling, increased risks of heat-related illness and cold-related cardiovascular stress, as well as difficult choices between paying for energy and food or healthcare.

What can be done

Many of these health harms can be mitigated through better planning and design.

Increasing the share of renewable energy used to power data centers would help reduce air pollution and associated health harms.

Using recycled water in targeted systems that cool individual server rows or racks rather than whole buildings can significantly reduce cooling energy demand, with some studies estimating reductions of up to 29%.

On noise, a Leesburg, Virginia, data center reduced low-frequency tonal noise by reengineering its fan mounts.

And on energy costs, requiring large-scale data centers to cover more of the grid costs they create could help protect residential customers from higher electricity bills.

The world’s digital infrastructure runs through data centers, and that is not changing. We believe that expanding this infrastructure without protecting the health of surrounding communities is an unacceptable option.

The Conversation

Edward Maibach currently serves on the Board of Directors of the Global Climate and Health Alliance. He has previously had funding from philanthropic organizations to conduct research and educational programming on the human health relevance of climate change and air pollution.

Luis Ortiz receives funding from US NSF, NASA, and NOAA to study the impacts of changing hazards on humans and infrastructure.

Neha Gour does not work for, consult, own shares in or receive funding from any company or organization that would benefit from this article, and has disclosed no relevant affiliations beyond their academic appointment.

  •  

Bison restoration efforts and grazing rights hinge on one question: Are bison wildlife?

Part of a bison herd maintained by the Blackfeet Nation on a private reserve in Montana. Madison Stevens, CC BY-NC-ND

Bison are political animals. A federal decision to revoke grazing leases for bison on public lands on the rolling plains of eastern Montana is the latest manifestation of long-standing contention. The largest land animal in North America, bison are considered a “keystone” species, meaning they have high ecological and cultural importance.

The May 2026 decision represents a significant setback for a decades-long effort by American Prairie, a private conservation organization, to restore wild bison to the Great Plains. Those in favor of the decision are describing the move as a boon for rural farmers and ranchers because it would reduce competition for grazing lands.

The legal question at the heart of the federal decision is a seemingly simple one: Are bison wildlife or are they domestic livestock? Approximately 400,000 bison roam the North American landscape today, of which nearly 90% are considered livestock.

The U.S. Bureau of Land Management argues that American Prairie’s herd of around 940 animals is intended as wildlife conservation, so it does not qualify as livestock production and is therefore ineligible to hold federal permits to graze on public lands.

American Prairie plans to appeal the decision, countering that it follows all pertinent regulations for livestock management – including containment and annual testing for diseases. Despite the organization’s vision of recreating an “American Serengeti,” these bison are privately owned and managed as livestock: wild in rhetoric only.

Buffalo walk through brown grass with hills in the background.
Bison walk through part of the American Prairie land in Montana. AP Photo/Matt Brown

As political ecologists who study the human dimensions of conservation, we are interested in how environmental decisions – such as how people legally define and manage animals – reflect power dynamics and how people understand the value of wildlife.

Our own research focuses on how tribal nations are navigating complex legacies of colonial settlement to restore bison as keystone relatives in a shared ecosystem. Collaborating closely with advisers from across the four nations of the Blackfoot Confederacy, including the Blackfeet Nation in Montana, we have learned that this perspective on bison, also known as buffalo – and “iinnii” to our Blackfoot partners – complicates, and enriches, this distinction between wildlife and livestock.

A human and ecological tragedy

Less than 200 years ago, an estimated 30 million bison roamed the North American grasslands, vital to plains ecosystems and Indigenous ways of life.

By the late 1880s that number dropped to less than 1,000. Bison were brought to near-extinction by a combination of commercial hunting, disease, drought and deliberate persecution as part of a broader effort to assimilate tribal nations into reservation life.

The legacies of this destruction reverberate through Plains Indigenous communities today. But increasingly, so does a sense of hope for recovery and repair.

Buffalo stand in an area of shrubs sprinkled with snow.
The bison in Yellowstone National Park are considered wildlife, managed by the National Park Service within park boundaries. Madison Stevens, CC BY-NC-ND

Bringing the bison back

Bison restoration efforts have been underway for over a century. Since the beginning, a motley crew of advocates have each seen something different in returning bison: a business opportunity, an ecological keystone or, since 2016, the United States’ national mammal. For the Blackfoot Nations and other tribes, the buffalo is a returning relative and a symbol of resurgence.

This symbolic ambiguity has brought together a broad coalition of “bison cheerleaders,” as one of the people we interviewed put it.

This diverse base of support may also help explain the mixed system of legal classification that now governs this controversial species. On federal lands, bison are wildlife. Most states, however, consider them livestock. In a few states, including Montana and Colorado, bison are dual-listed as both wildlife and livestock, which bison advocates say allows for more flexible management.

Meanwhile, many Native American tribes, including the Blackfeet Nation, formally recognize bison as wildlife. Yet they also challenge the distinction altogether, arguing that categorizing the animals as livestock or wildlife fails to reflect Indigenous worldviews that consider buffalo as both food and kin.

A grassy landscape view shows mountain peaks in the distance.
Chief Mountain (Ninnaastako), a culturally significant place for Blackfoot people, was selected as the site of a 2023 reintroduction of free-roaming bison. Madison Stevens, CC BY-NC-ND

A question of management

In a practical sense, the distinction between wildlife and livestock matters because how bison are listed determines how they are managed and under whose jurisdiction they fall.

Imagine a bison in Yellowstone National Park. Managed as a wild animal by the National Park Service, she roams freely – watched by curious tourists – as she forages, breeds and protects her calf from large predators, such as wolves and grizzly bears. Come one harsh winter, she migrates north across the park boundary into the state of Montana.

Because Yellowstone bison carry a disease called brucellosis that can infect cattle, when she leaves the park she becomes a “species in need of disease management,” subject to state and federal disease-management rules. She is allowed to roam only within a limited tolerance zone to avoid infecting cattle.

Also, outside the park she may be hunted, both by sovereign tribal nations exercising their treaty rights and by state-licensed hunters.

Less than 50 miles away, another bison lives an ostensibly similar life, also moving with the seasons and calving among the sagebrush, vigilant for predators. Yet according to the state of Montana, this bison is a privately owned, domestic animal.

A wide view of a grassy, hilly area with various barns and other buildings visible.
The Flying D Ranch in Montana, founded by media mogul Ted Turner, is working to restore bison to the Great Plains as a business venture. Madison Stevens, CC BY-NC-ND

She counts among the more than 45,000 bison that are owned by one specific “bison cheerleader”: media mogul and private conservation advocate Ted Turner, who died May 6, 2026. Turner’s flagship Flying D Ranch, a 113,600-acre property near Big Sky, Montana, is home to around 6,000 bisonnearly as many as live in Yellowstone National Park, the largest wild herd on the continent.

Bison managers and ecologists explain that animals managed as livestock are selectively bred and handled. Yet “wildness” isn’t always cut and dry. While managed for meat production, the bison at the Flying D Ranch are still a big herd occupying a large land base with wild predators. This makes them, in some senses, wilder than most herds managed for conservation by the U.S. Department of Interior, which average only 300 animals.

Like American Prairie’s bison, their management also reflects a vision of restoring wildness to the landscape through private land conservation.

Shifting definitions

When we began interviewing people about buffalo restoration in 2022, momentum for restoring free-roaming bison was at an all-time high, elevated as a key priority by Interior Secretary Deb Haaland. In that year, the U.S. Bureau of Land Management granted American Prairie the now-contested grazing leases, following extensive environmental review.

In a profound culmination of decades of grassroots advocacy, in 2023 the Blackfeet Nation released a herd of 48 buffalo near Chief Mountain, the first to roam freely on Blackfoot territory in over 150 years. In 2024, Yellowstone National Park adopted a new bison management plan to manage a larger, more migratory population.

Several bison walk across a snow-covered grassland.
Bison in the Fort Peck Tribes’ herd in what is now Montana are descended from bison in Yellowstone National Park. Madison Stevens, CC BY-NC-ND

Yet these developments were not without detractors. In places like Montana, bison have been received by some as a symbol not of hope but of government overreach and the power of elites over rural futures in a changing West.

One way people are seeking to change the discussion is by changing the definitions, underscoring once more why they matter. In 2021, the Montana State Legislature gave county commissioners authority to veto wildlife reintroductions in their county and redefined wild bison as only those bison that have not been handled or descended from handled animals.

In passing these laws, state lawmakers effectively “defined wild bison out of existence,” as a former Montana Fish, Wildlife and Parks official told us.

Ironically, those changes were intended to make it impossible for private entities to reintroduce bison as wildlife. Yet now the federal government is saying the animals are too wild to be classified as a productive use of the landscape.

This contradiction makes more sense when seemingly technical debates over listing are understood as conflicts over competing visions for the landscape: Are public lands – and even large private holdings – places to produce food or preserve pristine wilderness? Or something else? One Blackfeet community leader we interviewed reminded us that for Indigenous people, these lands remain both home and livelihood.

The effects of the BLM decision to revoke grazing leases could ripple well beyond American Prairie. An organization representing more than 50 tribes has filed a complaint against the decision, arguing that it threatens not only buffalo restoration but growing tribal-federal co-stewardship efforts.

An unlikely coalition brought the buffalo back from the brink. In a moment of growing uncertainty over the future of conservation on public lands, our research tells us that the long-term success of bison restoration will require finding common ground – and compromise – across diverse visions for the North American landscape.

The Conversation

Madison Stevens received funding from the National Science Foundation (#2404531; #2117652) and Montana State University to conduct this research.

Elizabeth (Libby) Lunstrum receives funding from the National Science Foundation (grant #2117652) and Boise State University.

  •  

Breathing two-billion-year old air: MONA’s Hard Core is an artistic journey through deep time

Museum of Old and New Art/Flickr, CC BY-SA

The structure of the Museum of Old and New Art (MONA) is cut directly into Hobart’s Berriedale Peninsula – walls carved from roughly 250-million-year-old sandstone that formed when Tasmania was still part of the supercontinent Gondwana.

It’s the perfect setting for Berlin-based French-Swiss artist Julian Charrière’s latest exhibit, Hard Core. This is not just an exhibition about rocks. It is about how we humans fit into deep time, and how we dig up, reshape and use rocks that took millions of years to form.

Viewed through an earth scientist’s eyes, Charrière’s sprawling exhibition feels like an abstract field trip, moving between ancient rocks, glacial boulders, volcanic products, and the materials that underpin modern life.

Portrait of artist Julian Charrière standing beside a rocky outcrop in a mountainous landscape. He wears a green jacket and backpack and looks into the distance.
Portrait of Julian Charrière. Museum of Old and New Art/flickr, CC BY

Humans as a geological force

Many of Charrière’s works explore a simple but powerful idea: the things we consume are bound to deep time. The rocks, minerals and metals underpinning modern life took thousands to millions of years to form, yet we extract them in an instant.

The first work is Not All Who Wander Are Lost (2019). It shows four glacial erratics: boulders carried by glacial ice and deposited far away from where they formed. The name derives from the latin errare, which means “to wander”.

The boulders, roughly waist to chest high, were all collected from the same Swiss valley (though each one began its journey from a different source).

Large glacial erratic boulder displayed on drill cores in a dark gallery. Metal rods placed among the cores reference metal resources extracted from the Earth.
Not All Who Wander Are Lost is a 2019 work made of four ‘glacial erratics’. Museum of Old and New Art/flickr, CC BY

The erratic rocks sit atop a row of “drill cores”, long cylinders of rock usually extracted from deep underground. Like flipping through the pages of a book, scientists can study drill cores to get clues into the Earth’s history and resources.

Charrière has broken the cylinders and repaired them with metals such as brass, aluminium and stainless steel — materials that come from rocks themselves.

The contrast is uncomfortable. While geological processes moved these rocks over thousands of years, humans now shift them across the world, cut into them and remake them into modern materials.

This work isn’t simply about glaciation or mining; it’s about humanity’s growing role as a geological force.

Breathing two-billion-year-old air

Charrière’s fascination with the natural world is clearest in Breathe (2026), a permanent installation that opened with Hard Core. It draws on the ancient rocks of the Pilbara in Western Australia, home to some of the world’s largest banded iron formations.

These began forming around 2.4 billion years ago during the Great Oxidation Event, when photosynthesising microbes began releasing oxygen into Earth’s oceans and atmosphere. Without this oxygen, complex life, including humans, may have never evolved.

Charrière describes Breathe as a kind of time machine. A reactor and electrolyser (developed with scientists) releases oxygen locked in the rocks into a circular chamber visitors enter one at a time.

Artist Julian Charrière stands beside a tall transparent column inside a circular, dimly lit chamber. The illuminated installation, Breathe, extends from floor to ceiling and is designed to release oxygen extracted from ancient rocks.
Julian Charrière beside the Hofmann apparatus in Breathe (2026), which releases oxygen extracted from ancient rocks. Museum of Old and New Art/flickr, CC BY

For a brief moment, they are the only person on Earth breathing air that has been trapped in rock for more than two billion years. Geological history usually feels remote, but Breathe removes that distance.

Inside the volcano

As a volcanologist, I was drawn to a cavernous space Charrière described as the “core” of his Hard Core exhibition. Surrounded by mirrored walls, this space rumbles, vibrates and flashes with light, creating an unsettling sensation of standing inside a volcano.

The space brings together several separate but interconnected works.

A Stone Dream of You (2024) features sculptures made from real volcanic lava bombs (lumps of molten rock flung from a volcano) and polished obsidian spheres (volcanic glass), while Thickens, pools, flows, rushes, slows (2020) is a striking sculpture made from shards of obsidian.

Installation view of Hard Core by Julian Charrière at MONA. Large volcanic rocks and lava bombs are arranged in a dark, mirrored gallery around a bright central light source, creating the impression of a volcanic chamber.
The ‘core’ of the ehxibit is a cavernous mirrored room, featuring sculptural works alongside an immersive sound installation. Museum of Old and New Art/flickr, CC BY

Both of these sit alongside Stone Speakers, a 4D sound installation playing recordings from five different active volcanoes around the world. Though distinct, the works are arranged together to create the atmosphere of a volcanic caldera.

Visitors can lie down and feel the seismic data resonating through the floor and their body — Earth’s restless pulse made physical.

A few other pieces kept me thinking after I left. In Atlas (2025), a Precambrian stromatolite is slowly polished into a sphere by rotating grinders. It was mesmerising, though I felt uneasy watching such an ancient object wear away.

Ancient stromatolite fossil held between metal rollers in a mechanical framework. Water flows over the rock as the machine gradually grinds it into a smooth spherical shape.
Atlas is a kinetic work in which an ancient stromatolite fossil is slowly ground into a sphere. Museum of Old and New Art/flickr, CC BY

Another work, Soothsayer (2021), is a large lump of coal held at eye level, in a steel scaffold, with a cavity that’s big enough for a human head. Visitors are invited to stick their head in and breathe the air.

This piece flips the idea of burying your head in the sand. It asks you to sit for a moment with the coal’s deep past, and the fossilised life it’s made from.

Large black lump of coal suspended within a steel scaffold structure in a dark gallery space. A smooth, head-sized cavity is carved into the coal, inviting visitors to place their head inside the sculpture.
In Soothsayer, visitors can stick their head into a large, hollowed out piece of coal. Museum of Old and New Art/flickr, CC BY

Rocks as storytellers

Hard Core reminded me why I became a geologist. I love telling the stories of the extraordinary journeys rocks have been on – fragments of Earth’s deep history preserved beneath our feet.

Charrière goes one step further with this exhibition. His work highlights how humans are now part of those stories. We aren’t separate from the geological world, but are actively reshaping it.

Charrière invites us to see rocks differently: not as scenery, resources, or museum objects, but as storytellers carrying the history of the planet, and increasingly, our own.

Hard Core is showing at MONA until March 29, 2027.

The Conversation

Hannah Moore is affiliated with not-for-profit organisation, Australian Earth Science Education.

  •  

Why did ‘Tyrannosaurus rex’ have such short arms?

Teeth? Big. Arms? Not so much. William_Potter/iStock via Getty Images Plus

Curious Kids is a series for children of all ages. If you have a question you’d like an expert to answer, send it to CuriousKidsUS@theconversation.com.


What did the T. rex use its little arms for? – Aurora, age 11, Pemberton Township, New Jersey


One of the most famous dinosaurs to ever roam across Earth, Tyrannosaurus rex, has filled people’s minds with wonder since the first skeleton was discovered in the early 1900s.

Scientists believe T. rex, or King of the Tyrant Lizards, as its name translates, was a fearsome predator. An adult T. rex was massive in size – approximately 40 feet (12 meters) long and 20 feet (6 meters) tall, weighing as much as an African elephant. Each of its enormous sharp teeth could be near a foot (0.3 meters) in length from the root to the tip.

I’m a paleontologist, and I use fossils to study how animals lived and evolved over long periods of time. One of the coolest things about being a paleontologist is that there are always new questions to ask and new things to learn – even about a super-well-known dino like T.rex, which went extinct just over 65 million years ago.

One T. rex mystery has to do with this giant predator’s relatively tiny arms. Why would it have arms so short that it couldn’t even reach its own mouth? How did it use them?

How ‘short’ is short?

First, let’s define what we mean by “short.”

The biggest T. rex could measure 45 feet (14 meters) from the snout to the tip of the tail, but their arms were only about 3 feet (1 meter) long. On average, a T. rex’s arms were just about 30% of the length of its legs.

In comparison, humans have, on average, arms around 66% of the length of their legs. If people had the same arm proportions as a T.rex, a 6-foot (1.8 meters) tall person would have arms only 10 or 12 inches (25 to 30 centimeters) long!

T. rex isn’t the only dinosaur with such short arms. The evolutionary trend toward shorter arms in theropods – the larger group of meat-eating, two-legged dinosaurs that T. rex belongs to – happened multiple times. Similar to how wings separately evolved in different animals – like birds and bats – traits can emerge many times in evolutionary history.

You can see the shortening of T. rex arms as a pattern in its family tree, as earlier relatives had proportionally longer arms.

Lots of schoolchildren gathered around a T. rex skeleton on display in a museum
Fossil skeletons of Tyrannosaurus rex make clear that the dinosaur itself was very big, even if its arms were proportionally small. John Zich/AFP via Getty Images

How did they use their mini-arms?

Short arms don’t seem to have been a problem for these mighty dinosaurs. T. rex was a successful carnivorous species that existed for over a million years. They only went extinct when an asteroid hit the Earth, causing a global mass extinction.

Scientists have suggested a few ideas to possibly explain how T. rex used their arms. Maybe they were used as some kind of social display that could impress other T. rex – kind of like the bright feathers of a peacock that can attract potential mates.

But male and female T. rex skeletons don’t show the major differences that paleontologists would take as clues that they relied on social displays to attract mates. And while animal behavior can sometimes be preserved, such as in bite marks or fossilized footprints, it’s rare to have enough fossil data to draw clear conclusions.

Maybe T. rex used their arms as weapons to attack or hold down prey. But these options seem unlikely since T. rex’s huge jaws would have made contact with an enemy or prey before the short arms would have been able to reach it.

Some scientists have recently hypothesized that T. rex‘s short arms were an adaptation to competition with other carnivores. If multiple predators were feeding on a carcass, one could get hurt by accidental bites or even intentional warning bites for getting too close. Shorter arms would be less likely to get chomped. Similar things occur today with territorial carnivores, like Komodo dragons.

Two Tyrannosaurus dinosaurs face off over a downed prey carcass
Scientists have suggested that in a feeding frenzy, shorter arms would potentially be easier to keep out of the way of chomps from other T. rex. Mark Garlick/Science Photo Library via Getty Images

Maybe the arms didn’t have a purpose

Another possibility is that the arms served little or no purpose at all, so over time, they became vestigial. That’s the scientific term for body parts that don’t have clear purposes anymore, but are still passed down through evolution.

One example is a whale’s hindlimbs. Whales evolved from mammals that lived on land that had large legs to move around. The bones are still present in today’s whales, but have gotten much smaller over millions of years and have no function.

Some scientists have suggested a different idea: T. rex’s arms may have evolved to be smaller as another body part grew larger. The fossil record reveals that arms got shorter as theropod skulls got larger across many different dinosaur groups, including T. rex. Larger skulls likely would have made it easier to hunt and eat larger prey.

Researchers can use mathematical equations to accurately predict theropod arm length if they know the animal’s skull size and length of its upper leg bone, the femur. It turns out that larger skulls are strongly linked to shorter arms in theropods.

The reason for the change in arms, however, isn’t as clear. Some scientists have argued that the smaller arms could have helped with balance as the head got larger, but others aren’t so sure. In evolution, there isn’t always a reason why a change occurs – sometimes, changes just happen. In this case, we don’t yet know if there was a benefit for the arms to get smaller as heads got larger.

Artist's rendition of a T. rex in a misty forest.
However they got that way, small arms don’t seem to have been an issue for these big predators. Orla/iStock via Getty Images Plus

So for now, we don’t really know how T. rex used its arms or why they evolved to be so small, proportionally. As scientists find new data, we will continue to test hypotheses to better understand why this tiny-arm trend occurred so many times in theropod evolution. That’s what makes science so exciting – a future fossil discovery could be the missing puzzle piece that helps us answer these questions.

Sarah Sheffield describes – and her students act out – some of scientists’ hypotheses about T. rex arms.

Hello, curious kids! Do you have a question you’d like an expert to answer? Ask an adult to send your question to CuriousKidsUS@theconversation.com. Please tell us your name, age and the city where you live.

And since curiosity has no age limit – adults, let us know what you’re wondering, too. We won’t be able to answer every question, but we will do our best.

The Conversation

Sarah Sheffield does not work for, consult, own shares in or receive funding from any company or organization that would benefit from this article, and has disclosed no relevant affiliations beyond their academic appointment.

  •  

A ‘supereruption’ transformed NZ 350,000 years ago. We now know how it happened

Deposits from the Whakamaru supereruption are pictured here on Chatham Island. Katherine Holt, CC BY-NC-ND

Some 350,000 years ago, the centre of New Zealand’s North Island appeared much different than the mountainous, scrub-covered landscape it is today.

Amid a glacial period, temperatures were colder and conditions harsher. Vast beech and podocarp forests blanketed the region, providing habitat for abundant native birdlife.

It was against this tranquil backdrop that the one of the Earth’s most explosive eruptions violently unfolded, releasing enough material to carpet much of the country.

Now, colleagues and I have pieced together traces left by the event to provide an unprecedented picture of how it happened – while shedding important new light on the mechanics of those rare cataclysms that are known as supereruptions.

Reconstructing a supereruption

The Whakamaru supereruption was one of the largest ever recorded on Earth – and the greatest produced by New Zealand’s famous Taupō Volcanic Zone.

Stretching from Whakaari/White Island to Ruapehu, this dynamic area is the product of two powerful geological processes: the Pacific Plate sinking beneath the Australian Plate, and the central North Island simultaneously being pulled apart.

It is home to numerous volcanic features today, from geothermal fields with bubbling hot springs and mud pools, to caldera systems and active stratovolcanoes.

Throughout its 2-million-year history, the zone has experienced four known events of such immense scale that they are formally classified as supereruptions – or those that would score a maximum 8 on the Volcanic Explosivity Index.

Only a few dozen have ever been recorded worldwide – the most recent being the Ōruanui eruption that helped create Lake Taupō around 25,300 years ago.

For volcanologists, they pose some of the field’s greatest mysteries: how can so much magma build up below the surface, and then erupt all at once? And what happens to the surrounding landscapes?

To help answer these questions, we turn to preserved volcanic deposits that can be used to reconstruct the processes that play out during these rare events.

Two signature products of supereruptions are “flow” deposits – hot, dangerous masses of rock and gas that travel along the ground – and “fall” deposits, typically mixtures of crystals and volcanic glass that fall from the air.

The challenge for volcanologists is that typically only fragments of these deposits are preserved – and they are often scattered across great distances.

In the Whakamaru supereruption, massive pyroclastic flows left behind thick layers of dense volcanic rock across the Whakamaru and King Country regions. Ash and pumice spread much farther, blanketing much of the North Island and parts of the Pacific Ocean.

One of the first steps in our study was to build a database of these deposits by matching the unique chemical signature of volcanic glass produced during the eruption.

Glass shards from the Whakamaru Supereruption under the electron microprobe. Provided by author, CC BY-NC-ND

This process is similar to forensic science at a crime scene: fingerprints may suggest a suspect, but DNA evidence can confirm the match. In volcanology, deposits can offer clues as to how they got there, but it is their chemical composition which provides the definitive link.

Using this approach, we analysed more than 30 sites around New Zealand and the south Pacific Ocean. All were found to have come from the Whakamaru supereruption.

With these correlated, we were then able to reconstruct this extraordinary episode.

How the supereruption unfolded

At the beginning of the eruption, a large lake likely lay within the central North Island, much like Lake Taupō today.

When the magma reached the surface, it erupted directly into this lake, triggering extremely violent interactions between magma and water, which drove the earliest phase of the eruption.

One of the ashfall deposits from the Whakamaru supereruption at Ōtarawairere, Bay of Plenty. Provided by author, CC BY-NC-ND

It appears this first phase was driven by the evacuation of a singular magma body.

As the eruption progressed, the lake was gradually destroyed and infilled. Eventually, the system transitioned into a much drier style of volcanism.

At the same time, the eruption evolved into a far larger and more complex event beneath the surface. Instead of being fed by one magma chamber, it appears to have triggered a cascading sequence involving at least five separate magma bodies erupting at once.

The amount of ash generated by the eruption is staggering.

Most of the North Island – and even far-away Chatham Island – would have been carpeted in around 30cm or more of material. Areas closer to the eruption were left buried under as much as 4.5m of ash.

One of the ashfall deposits from the Whakamaru supereruption, ~800 km from source on Chatham Island. Provided by author, CC BY-NC-ND

Hot, dense pyroclastic flows also swept across the landscape, leaving deposits up to hundreds of metres thick closer to the eruption source.

Altogether, we estimate the eruption released around 2,300 cubic kilometres of volcanic material – enough to bury the entirety of New Zealand beneath roughly nine metres of debris if spread evenly from Cape Reinga to Invercargill.

Ashfall deposits (the upper, whiter layers) from the Whakamaru supereruption at the Waiotahe Cliffs, Bay of Plenty. Provided by author, CC BY-NC-ND

Today, the Taupō Volcanic Zone remains one of the most active and powerful volcanic systems on Earth.

Although supereruptions like Whakamaru are rare, Taupō volcano has produced many smaller yet still devastating eruptions throughout its history, all of which would have had major impacts on both New Zealand and the wider world.

Understanding how these types of volcanoes operate is essential, both in preparing for future eruptions and for understanding how past events may have transformed the landscape we see today.

The author acknowledges the contributions of Simon Baker and Colin Wilson to this research.

The Conversation

Anna Miller does not work for, consult, own shares in or receive funding from any company or organisation that would benefit from this article, and has disclosed no relevant affiliations beyond their academic appointment.

  •  

Wildfires are reversing America’s progress on ozone pollution, the main ingredient in smog

Smoky haze from wildfires in Canada blankets a New York City neighborhood on June 7, 2023. David Dee Delgado/Getty Images

For decades, the United States made steady progress in reducing surface ozone pollution, the main ingredient in smog. But that progress – achieved as vehicles, industries and power sources became cleaner – is increasingly being overshadowed by a different and growing source of ozone pollution: wildfires.

Our team of atmospheric and wildfire scientists analyzed wildfires’ contribution to surface ozone levels from 2003 to 2024 across the United States.

We found that the gases in wildfire smoke have reversed the national ozone trend, forcing a shift from declining ozone levels prior to 2015 to increasing ozone levels after 2015. We also found that the number of ozone-related premature deaths due to wildfires has been increasing by about 300 deaths per year since then.

Battling smog

Most people know ozone as the protective layer of the atmosphere high above the Earth that shields the planet from harmful ultraviolet radiation. But ozone has two very different faces.

High in the atmosphere, ozone is beneficial. Near the ground, it is a harmful air pollutant that can irritate the lungs and worsen respiratory diseases.

Los Angeles made ozone visible to the nation in the 1940s and 1950s, as thick, eye-stinging smog often blanketed the city. It turned an invisible chemistry problem into a public-health crisis people could see and feel. That crisis helped motivate decades of air pollution control efforts in California and, later, across the United States.

After the passage of the Clean Air Act and its amendments in the 1970s, the U.S. made steady progress in cleaning up surface ozone. Regulations on vehicles, power plants and industrial sources reduced emissions of nitrogen oxides and other ozone-forming chemicals.

To monitor the progress, the U.S. Environmental Protection Agency has over 1,000 stations that measure ozone around the country. They cover many places, but mostly urban areas, and do not measure ground-level ozone everywhere at the neighborhood scale.

We were able to fill in the gaps by combining those monitoring station measurements with satellite-derived information about air pollution and human activity, along with weather and air quality model simulations. We then used artificial intelligence to estimate daily surface ozone levels everywhere in the contiguous U.S., with data every square kilometer, over the past 22 years.

The results show that national progress in reducing surface ozone reversed around 2015 as North America began to face more severe wildfires. In many regions, ozone levels are now increasing, especially in the western U.S. and the Midwest, where smoke and gases from wildfires are becoming more common as they are transported through the air.

Overall, surface ozone levels that had been falling by about 0.65 part per billion per year from 2003–2015 have since increased by about 0.13 parts per billion per year. If wildfires hadn’t been an influence, we found, the trend of falling surface ozone levels would have continued instead.

A US map showing highest increases in ozone across the Western mountains, Great Plains and Midwest, including Minnesota and Wisconsin, which saw many heavy smoke days from Canadian wildfires.
Ground-level ozone since 2015 has increased the most in areas where wildfire smoke increased. Minnesota, Wisconsin and other parts of the Midwest have experienced several summers of wildfire smoke from Canada. The map uses national ambient air quality standards. Weizhi Deng, et al., 2026

People often think of wildfires as a problem for the western U.S., but smoke and gas pollutants from their emissions can travel thousands of miles, affecting communities far from the fires themselves.

The 2023 Canadian wildfires offered a vivid example. In much of the Midwest, ozone reached unhealthy levels for more than a week. The impact of wildfire smoke reached as far as Georgia and New York. That year, an additional 43 million Americans lived in areas with ozone exceeding healthy standards compared to previous years because of increased wildfire emissions.

An animation shows ground level ozone during wildfire smoke incursions from Canada.
Smoke reached far into the U.S. during Canada’s destructive 2023 wildfire season, as these measures of ground-level ozone over three weeks that summer show. Weizhi Deng, CC BY-ND

As the Earth and its atmosphere warm, wildfire seasons are becoming longer and more severe across many parts of North America, and the trend is predicted to continue. In line with projections, Canada experienced its most devastating wildfire seasons on record in 2023 and 2025. In January 2025, destructive fires burned more than 16,000 homes and businesses in and around Los Angeles during a time of year when such events have historically been uncommon.

The shift toward more fires suggests that the rising ozone problem could become even greater in the future. That’s a problem for human health.

Reducing exposure to ozone and its health risks

People can reduce their exposure to ozone pollution by checking air quality forecasts and limiting outdoor activities when wildfires are sending smoke into the air. But protecting public health in the long run will require broader actions to reduce ground-level ozone itself.

That includes efforts to mitigate fire risk by improving wildfire management, such as reducing brush and other dry undergrowth that can fuel fires, and also scaling back the causes of rising global temperatures, such as the burning of fossil fuels. As temperatures rise, the ground loses moisture, creating conditions for more extreme fires.

Protecting public health also means strengthening air quality forecasting systems to provide accurate early warnings, so people can take precautions, and maintaining air pollution monitoring networks and investing in satellite sensors to continue measuring progress, so problems can be identified and fixed.

The Conversation

Jun Wang receives funding by NASA’s Terra, Aqua, and Suomi National Polar-orbiting Partnership program, NASA’s Modeling and Analysis program, NASA’s Health and Air Quality program, the NSF's Established Program to Stimulate Competitive Research program, and NOAA Radiative Budget program.

Meng Zhou and Weizhi Deng do not work for, consult, own shares in or receive funding from any company or organization that would benefit from this article, and have disclosed no relevant affiliations beyond their academic appointment.

  •  
❌