People told not to enter damaged buildings for fear of aftershocks from magnitude-7.8 quakeAt least 37 people have died and hundreds have been injured after a magnitude-7.8 earthquake shook part of the southern Philippines early on Monday, collapsing buildings and triggering tsunami alerts.The quake hit early in the morning about 20km (12.4 miles) off the coast of Sarangani province, with tremors felt strongly across Mindanao and 420km away in the city of Manado on the Indonesian island of Sulaw
People told not to enter damaged buildings for fear of aftershocks from magnitude-7.8 quake
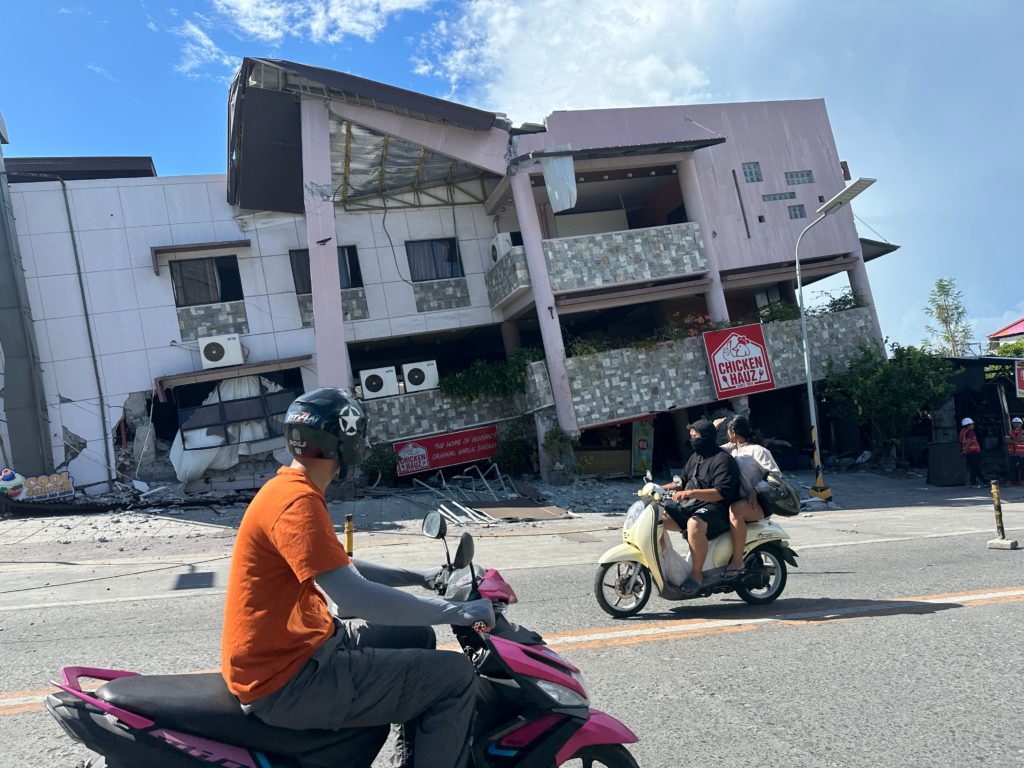
At least 37 people have died and hundreds have been injured after a magnitude-7.8 earthquake shook part of the southern Philippines early on Monday, collapsing buildings and triggering tsunami alerts.
The quake hit early in the morning about 20km (12.4 miles) off the coast of Sarangani province, with tremors felt strongly across Mindanao and 420km away in the city of Manado on the Indonesian island of Sulawesi.
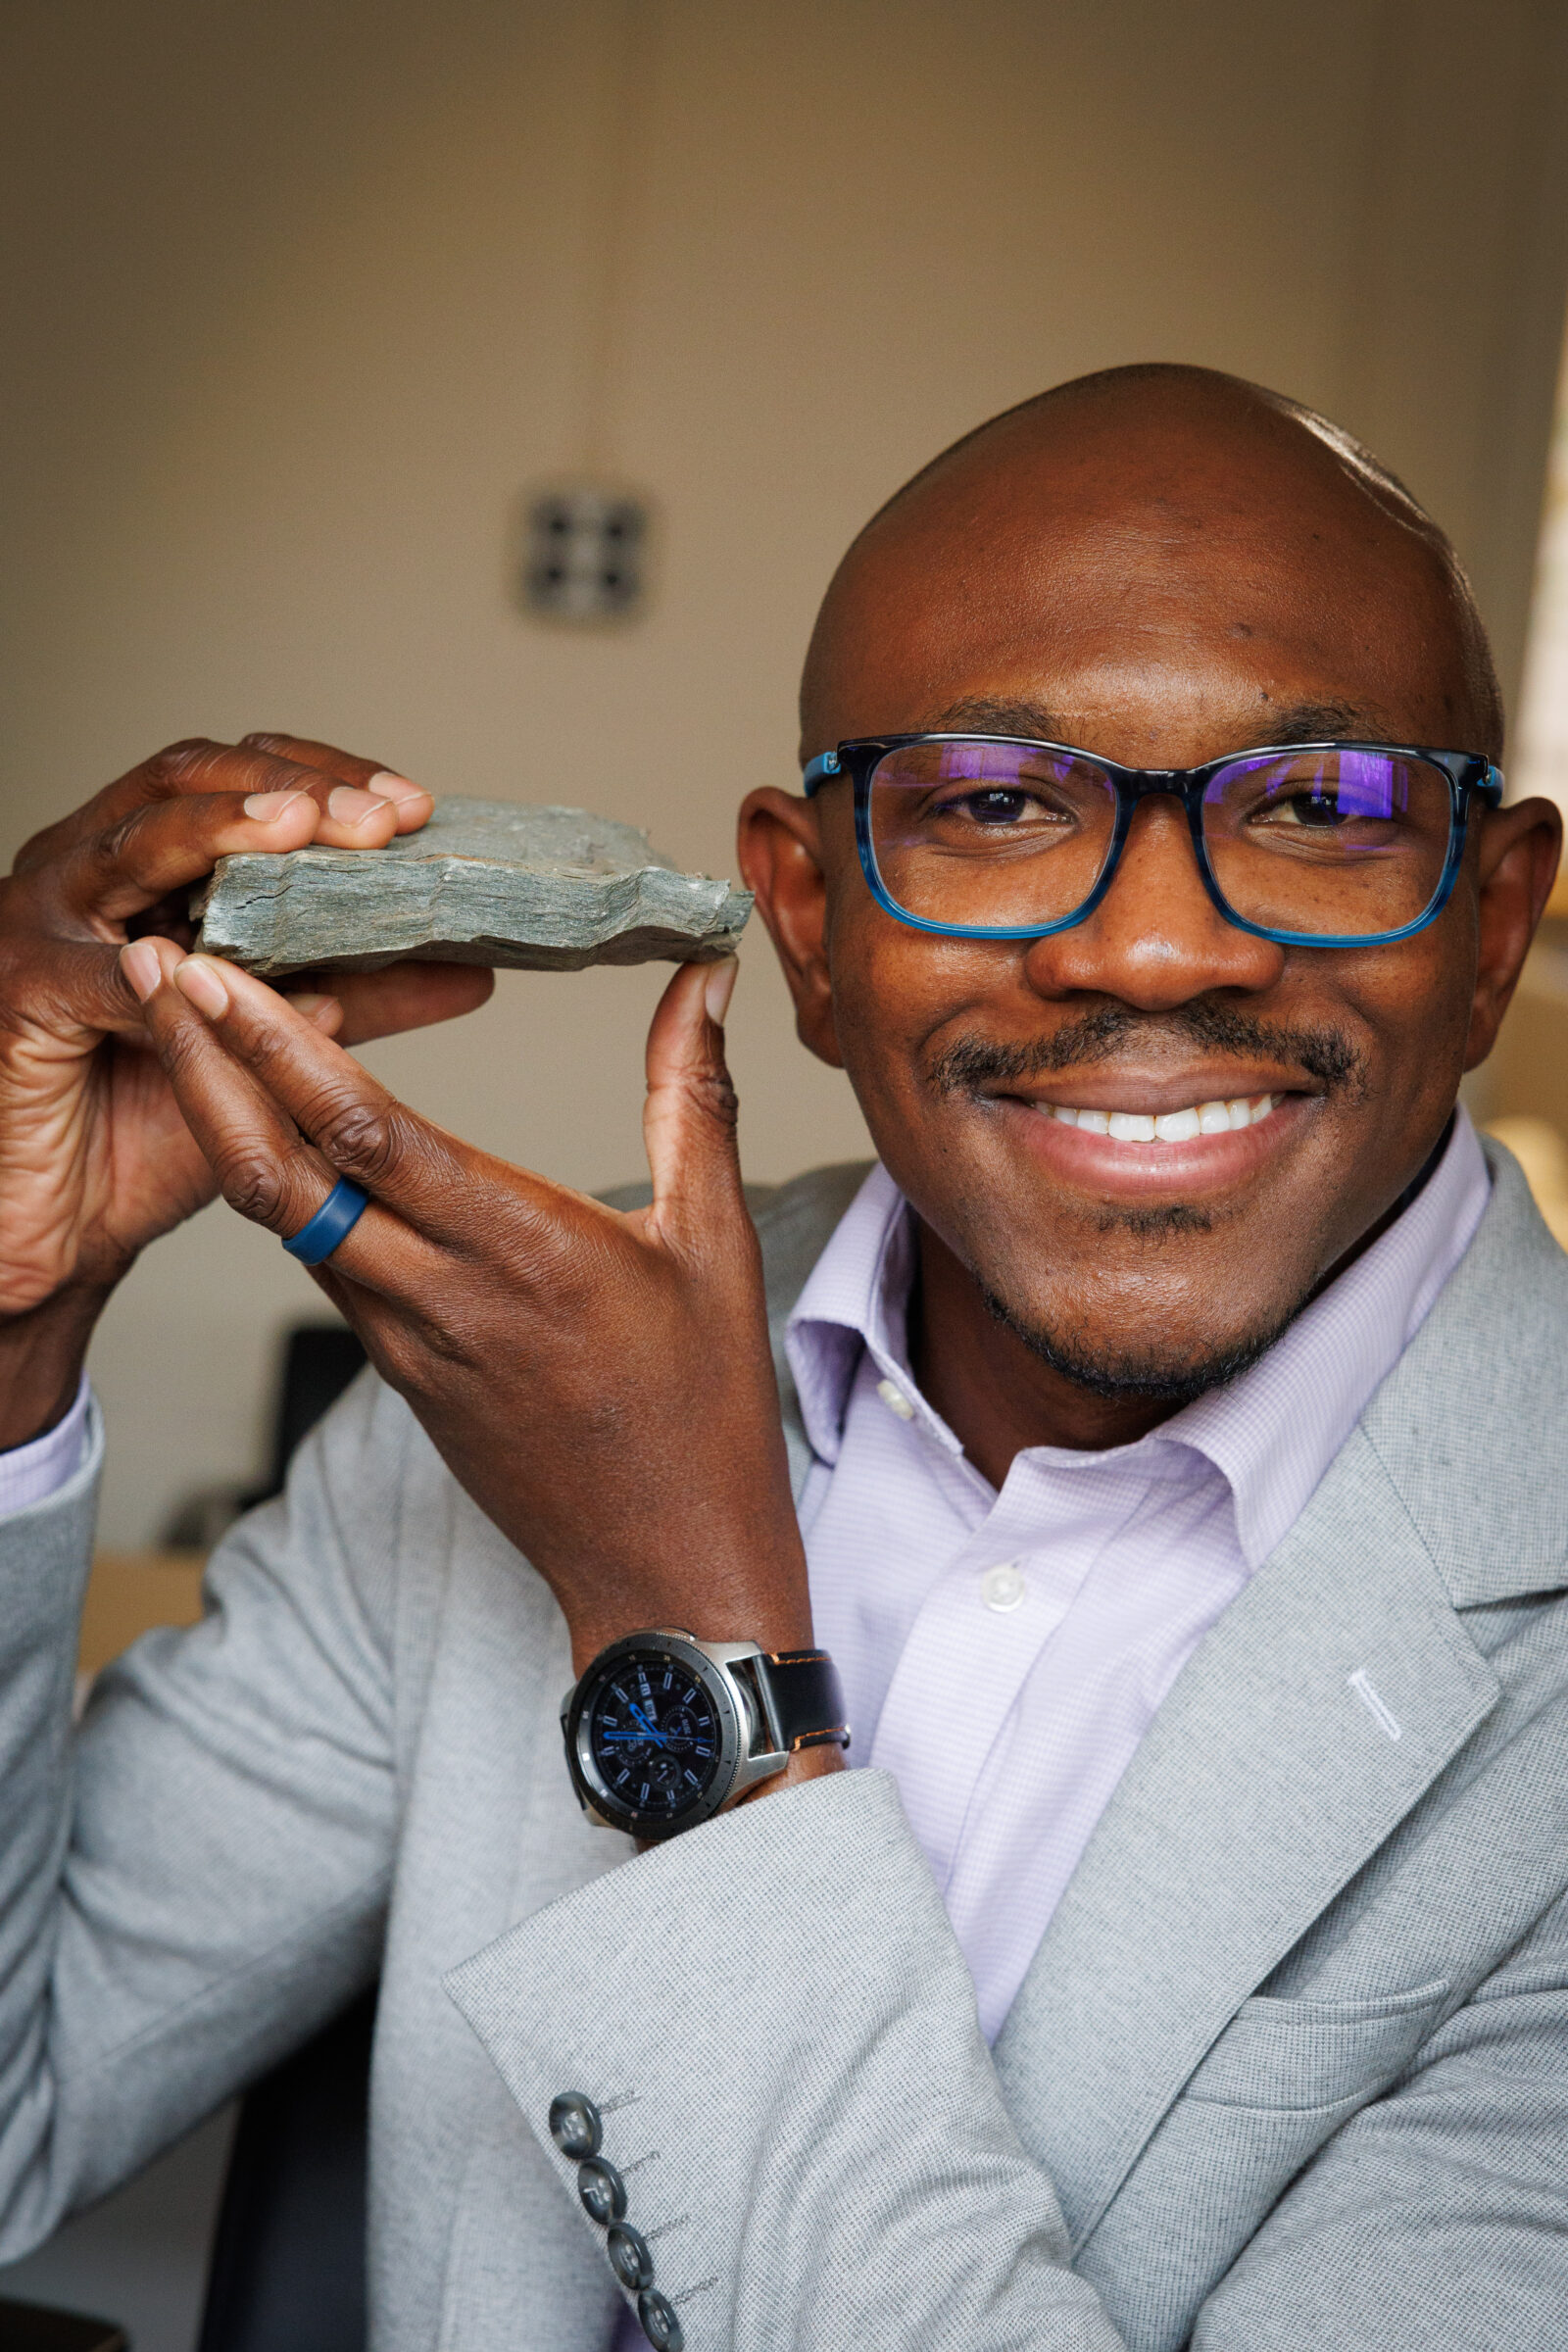
Folarin Kolawole is one of 15 recipients of this year's National Geographic Society’s Wayfinder Award, which recognizes people whose work is expanding our understanding of the planet and helping to protect its future.
Folarin Kolawole is one of 15 recipients of this year's National Geographic Society’s Wayfinder Award, which recognizes people whose work is expanding our understanding of the planet and helping to protect its future.
Thirty years ago, the blockbuster movie Twister featured a group of academics putting themselves at risk by chasing tornadoes in the name of science. Although the Hollywood story entailed a surfeit of sensationalism, special effects, and unrealistic stereotypes, the movie got a few things right. Specifically, the scientists were trying to study tornadoes using a large number of spatially distributed, home-built, low-cost (and potentially sacrificial) sensors.
Today, we commonly refer to the
Thirty years ago, the blockbuster movie Twister featured a group of academics putting themselves at risk by chasing tornadoes in the name of science. Although the Hollywood story entailed a surfeit of sensationalism, special effects, and unrealistic stereotypes, the movie got a few things right. Specifically, the scientists were trying to study tornadoes using a large number of spatially distributed, home-built, low-cost (and potentially sacrificial) sensors.
Today, we commonly refer to the coordinated use of tens to hundreds of similar sensors that are spread out as “large-N” sensing. Such sensor distributions have led to important advances in seismology and infrasound science, where they have improved our understanding of seismic ground motion and helped shed light on volcanic eruption dynamics [e.g., Rosenblatt et al., 2022; Anderson et al., 2023].
The benefits of large-N networks and arrays include robust spatial sampling and signal extraction from noise. They are also advantageous for detecting small signals, sensing natural hazards in remote environments, and offering critical redundancies for sensors at risk from lava or debris flows, wildfire, weather, or even malicious mammals.
Since 2013, our research group in the Department of Geosciences at Boise State University (BSU) has worked to study infrasound from geophysical phenomena by capitalizing on the benefits of low-cost, large-N sensing technology [e.g., Slad and Merchant, 2021]. More than a decade on, this effort has yielded scientific successes from a variety of environments, and it is continuing to evolve.
Large-N Sensing for Infrasound
Many violent natural processes, including landslides, volcanic eruptions, earthquakes, avalanches, and meteors, produce infrasound.
Many violent natural processes, including landslides, volcanic eruptions, earthquakes, avalanches, and meteors, produce infrasound, defined as low-frequency sound below the threshold of human hearing (less than 20 Hertz). Such events may create audible sound as well, but the subaudible band is often much more energetic in terms of sound intensity, and it has long wavelengths that can propagate long distances with little attenuation. These characteristics make infrasound especially valuable for remote sensing of natural phenomena.
Our group at BSU grew more interested in developing our own inexpensive infrasound sensing solutions after costing out technology for commercial data logging systems, the compact electronic devices that record and store sensor data. These systems can be far more expensive than infrasound transducers—the sensors that actually detect sound—themselves.
The cost element became particularly relevant after we lost instrumentation deployed at the summit of Chile’s Villarrica volcano when it erupted a 2-kilometer-tall lava fountain on 3 March 2015 [Johnson et al., 2018]. In an instant, our hardware, including seismic and infrasonic sensors and their commercial multichannel data loggers, was entombed beneath falling lava. This financial loss incentivized our work to develop low-cost loggers that would match the technical specifications and fidelity of commercial systems.
The result was the customized Gem infrasound logger, which we created using the widely available and very economical Arduino open-source electronic prototyping platform and its low–power consumption microcontroller. The Gem is an all-in-one infrasound sensor and data logger with a high dynamic range (millipascals to 100 pascals), a 100-hertz sample rate appropriate for infrasound, and a built-in GPS for precise timing and synchronization [Anderson et al., 2018].
Although we initially conceived of the Gem as an alternative to commercial loggers to be deployed as single stations or in small arrays, we quickly realized its potential for use in high-density distributed sensing arrays that enabled new detection capabilities. In particular, its small package size (it has about the dimensions and weight of a paperback novel) and its ease of deployment—simply insert alkaline batteries, place it on the ground, and turn it on—have opened opportunities for rapid, large-N deployments in difficult-to-access environments.
Early Successes for the Gem
Volcán Villarrica, near Pucon, Chile, is seen in 2025 (left). The volcano regularly releases gas from a small lava lake recessed deep within the summit crater (right). Credit: Jeffrey B. Johnson
The Gem’s inaugural field mission came in January 2020 during a return to Villarrica, where activity had returned to normal following its 2015 paroxysmal eruption [Rosenblatt et al., 2022]. Typical activity in the volcano’s normal state includes open-vent degassing from a small lava lake recessed deep within the summit crater, which produces its famously powerful volcano infrasound [e.g., Johnson et al., 2012].
To capture Villarrica’s infrasound in detail, a four-person team from BSU climbed the 3,000-meter-tall glaciated volcano and quickly installed 16 sensors around the crater rim, as well as another 16 sensors along an 8-kilometer linear transect from the summit down the northern slope (Figure 1). This unique sensor distribution permitted us to capture the infrasound wavefield and how it interacts with topography in unprecedented detail.
Fig. 1. (a) Oblique and (b) plan views of Villarica’s summit region were created from structure-from-motion surveys in 2020. Red triangles and circles indicate locations of Gem sensing packages. (c) Also in 2020, Jake Anderson adjusts a cable suspended across the volcano’s crater that held a Gem sensor (circled). (d) In 2025, Jerry Mock unloads Gem systems at Villarica’s summit during another data collection campaign there. Click image for larger version. Credit: Jeffrey B. Johnson
Deploying such an array configuration using much heavier, larger, and power-intensive conventional instruments would have taken far more time and resources, as well as a bigger group. With the Gems, however, the installation was feasible for our small team, each member of which could easily carry eight instruments and the batteries needed to power them.
To monitor volcanoes with infrasound, it is necessary to understand the influence of atmospheric effects.
Once in place, these sensors collected continuous data during the 2-week study that were used to quantify the diffraction of sound coming out of the volcanic crater [Rosenblatt et al., 2022] and to measure the sound’s attenuation as it propagated away. Such studies are important for investigating time-varying atmospheric parameters such as changing temperatures and winds, which can affect infrasound transmission, diminishing its amplitude or even—in extreme cases—completely silencing it in an acoustic shadow zone [Johnson et al., 2012]. To monitor volcanoes with infrasound, it is necessary to understand the influence of atmospheric effects.
Months later, another opportunity arose to demonstrate the Gems’ capability for large-N infrasound sensing. During the early days of the COVID-19 pandemic, on 31 March 2020, a magnitude 6.5 earthquake occurred near Stanley, Idaho. The earthquake, the largest in the state since 1983, kicked off an energetic aftershock sequence, with more than 700 magnitude 3 or greater earthquakes occurring in 6 months. Most of these events produced significant local infrasound radiation, or “airquakes,” caused by ground-atmosphere coupling [e.g., Johnson et al., 2020].
Pandemic-related precautions inhibited a large team from venturing as a group into the field. However, a lone BSU researcher (coauthor Jacob Anderson), trudging through forest terrain and deep snow on skis, was able to deploy and activate 22 Gems in less than 4 hours in early April, thanks in part to the sensors’ compact size and ease of deployment.
This array captured hundreds of local infrasonic aftershocks within about 25 kilometers of their epicenters. It also recorded a far larger event 700 kilometers away, the 15 May magnitude 6.5 Monte Cristo earthquake in Nevada. The array detected the epicentral infrasound from the distant earthquake source, as well as infrasound from numerous secondary sources, including mountain ranges throughout the western United States that reradiated the ground motion as infrasound (Figure 2) [Anderson et al., 2023].
Fig. 2. This map shows source region(s) of infrasound associated with the May 2020 Monte Cristo earthquake in Nevada that was detected by an array of Gem infrasound sensors deployed at the PARK site near Stanley, Idaho. Click image for larger version. Credit: Adapted from Anderson et al. [2023], CC BY 4.0
Detecting all these distinct signals was possible because of the enhanced array processing capabilities provided by the large number of sensors. Anderson et al. [2023] showed that when the data were processed from 3-sensor subsets of the 20+-sensor array—instead of from the whole array—it was possible to detect only the most intense earthquake infrasound arrivals. In other words, the larger array had much greater fidelity and sensing capabilities than smaller distributions of sensors.
During its 2-month deployment, the Stanley array also detected sounds from other distant nonearthquake sources, including waterfalls 195 kilometers away and thunder more than 900 kilometers away [Scamfer and Anderson, 2023]. Such enhanced detections, facilitated by large-N sensing, demonstrate an improved capacity to monitor a range of Earth phenomena continuously over a wide range of distances.
Putting Sensors in Harm’s Way
Since those proof-of-concept deployments, Gems have been used to monitor snow avalanches, lahars, river flow discharge, stratospheric sounds (while mounted aboard a solar balloon), and numerous volcanoes during field experiments [e.g., Tatum et al., 2023; Bosa et al., 2024; Rosenblatt et al., 2022; Brissaud et al., 2021]. Given their ease of use, small size, and low replacement cost, they’ve also been tested in hazardous environments where the risk to more expensive hardware could be considered unreasonable.
The motivation to put sensors in harm’s way is to gain insight into geophysical phenomena by recording subtle signals close to the source that may not be detectable from farther away.
The motivation to put sensors in harm’s way is to gain insight into geophysical phenomena by recording subtle signals close to the source that may not be detectable from farther away. For example, at Villarrica, Rosenblatt et al. [2022] suspended a Gem on a cable 100 meters above a lava lake to collect infrasound data from a unique, bird’s-eye perspective over the crater (Figure 1c). (Stringing the cable across the crater proved far more challenging than deploying the sensor itself, which slid down the cable until finding its resting place at the bottom of the cable’s arc.)
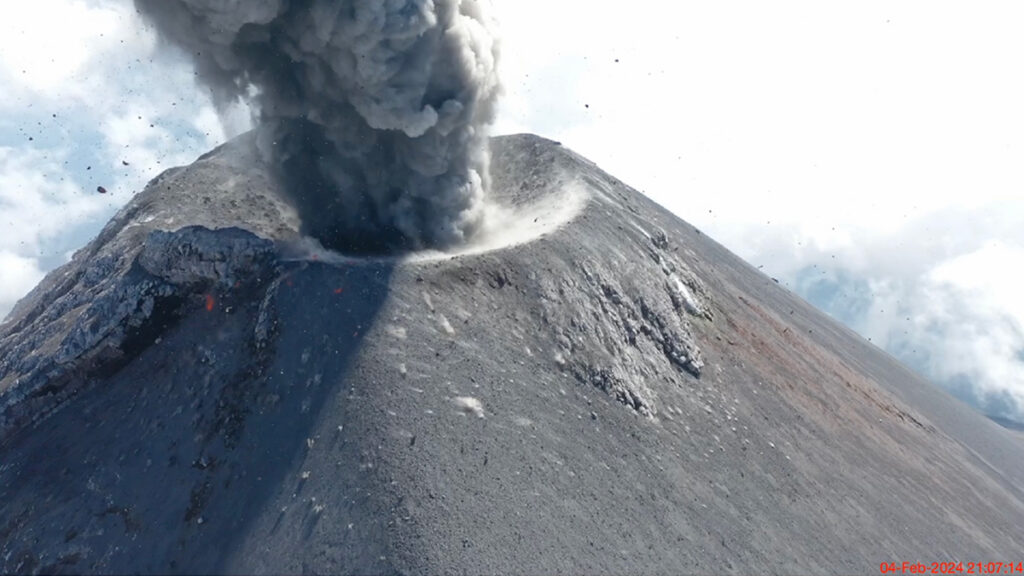
In another case, we landed a pair of Gems on the ground near a frequently exploding crater at Fuego volcano in Guatemala using a drone (see video below). We later retrieved one of the sensors from high on the volcano’s flanks. Another was lost because high winds initially posed too great a risk to fly the drone back for it. Then the following day after the wind subsided, we could not locate the stranded Gem, which was probably a casualty of a nighttime explosion.
Drone footage and infrasound recordings were collected during an explosion of Fuego volcano on 4 February 2024. Pa = pascals. Credit: video: Jerry C. Mock; animation and infrasound: Jeffrey B. Johnson
Our group at BSU also has nascent interest in using Gems to study fire in natural environments. Wildfires produce infrasound from a spatially extensive source region corresponding to actively burning areas. Because of the source complexity and the fact that fire infrasound is low amplitude and tremor-like [Johnson et al., 2025], enhancing signal-to-noise ratios in recorded infrasound is critical. This enhancement is enabled by using large-N monitoring networks, making infrasound wildfire surveillance a promising area of investigation.
Low-cost, rapid infrasound deployments could one day be used as an effective operational tool.
Toward this objective, our group installed 76 sensors ahead of a prescribed burn in Reynolds Creek, Idaho, in October 2023 to begin developing infrasound as a tool for monitoring and mapping wildfire. We have also deployed Gems for infrasound studies of naturally occurring wildfires, such as the Emigrant wildfire in Oregon in August and September 2025 (Figure 3). During that active wildfire response, a team safely and quickly installed tens of sensors within a matter of hours in an area facing dynamic hazards from the rapidly expanding fire, which eventually covered 33,000 acres (about 13,354 hectares). Luckily, no instruments were lost, and the data have shown the potential to track a wildfire as it advances.
Preliminary results suggest that low-cost, rapid infrasound deployments could one day be used as an effective operational tool. For example, in firefighting responses, infrasound might complement intermittent aerial observations, from aircraft or drones, because it provides a continuous record of fire activity. Infrasound surveillance might also be able to “hear” combustion sources within a burn area that is obscured to optical sensing because of clouds or nightfall.
Fig. 3. (a) The spread and severity of the 2025 Emigrant Fire in Oregon, as calculated from prefire (21 August) and postfire (18 October) Sentinel-2 satellite images, are shown. Inset maps show the distribution of 37 Gem sensors rapidly deployed in three arrays. (b) Smoke from the fire rises from the landscape on 31 August during deployment of the sensors. (c) Following the fire, one sensor that had been melted by the fire was recovered with its data card still intact (red circle). dNBR = differenced normalized burn ratio. Click image for larger version. Credit: (a) and (b): Madeline A. Hunt; (c): Jacob F. Anderson
The Evolution of Low-Cost Sensors
Five years ago, the single-sensor Gem was a cutting-edge infrasound logging solution. While it remains a powerful and economical tool for large-N arrays and for sensing in hostile environments, it is evolving.
Boise State University researchers (left to right) Madeline Hunt, Owen Walsh, Jerry Mock, and Jacob Anderson prepare to deploy Gem sensors in Idaho’s Sawtooth Mountains in January 2024. Credit: Jeffrey B. Johnson
We have now developed the Gem into an even more versatile version called the Aspen, which can log four independent sensors at a sample rate of 200 hertz, double that of the Gem. The Aspen retains the small size, low weight, low power consumption, and low cost of the Gem, but with the capability to record higher-resolution 24-bit, time-synchronized data from a triaxial seismic sensor and an infrasound transducer.
Recording synchronous seismoinfrasonic data on the same logging platform offers the advantage of sensing both ground shaking and infrasonic oscillations. The ability to measure waves propagating in the ground and in the air simultaneously could facilitate work in the growing field of environmental seismology, which focuses on geophysical sources at Earth’s surface like debris flows and volcanoes.
Although we have focused on seismoacoustic geophysical measurements in our work, the concept of gathering data with low-cost instrumentation in harm’s way or from coordinated arrays of numerous sensors holds promise across Earth and environmental sciences. Such approaches could be used, for example, with tiltmeters (which measure slope changes), gravity meters, or near-infrared thermometers (e.g., optical pyrometers), all of which would offer additional data streams complementing seismoacoustic observations in geophysical studies of volcanoes.
With the diversity of emerging uses, it’s clear that large-N sensing—infeasible or cost prohibitive in many cases until recently—could transform how we measure many facets of Earth, helping to reveal the inner workings of volatile volcanoes, twisting tornadoes, and more.
Acknowledgments
More information about low-cost infrasound sensing solutions can be found at https://sites.google.com/boisestate.edu/infravolc/home. Development of the Gem infrasound logging platform was supported by a grant from the National Science Foundation (EAR-2122188).
References
Anderson, J. F., et al. (2018), The Gem infrasound logger and custom‐built instrumentation, Seismol. Res. Lett., 89(1), 153–164, https://doi.org/10.1785/0220170067.
Anderson, J. F., et al. (2023), Remotely imaging seismic ground shaking via large-N infrasound beamforming, Commun. Earth Environ., 4(1), 399, https://doi.org/10.1038/s43247-023-01058-z.
Bosa, A. R., et al. (2024), Dynamics of rain-triggered lahars and destructive power inferred from seismo-acoustic arrays and time-lapse camera correlation at Volcán de Fuego, Guatemala, Nat. Hazards, 121, 3,431–3,472, https://doi.org/10.1007/s11069-024-06926-1.
Brissaud, Q., et al. (2021), The first detection of an earthquake from a balloon using its acoustic signature, Geophys. Res. Lett., 48, e2021GL093013, https://doi.org/10.1029/2021GL093013.
Johnson, J. B., et al. (2012), Probing local wind and temperature structure using infrasound from Volcan Villarrica (Chile), J. Geophys. Res., 117, D17107, https://doi.org/10.1029/2012JD017694.
Johnson, J. B., et al. (2018), Forecasting the eruption of an open-vent volcano using resonant infrasound tones, Geophys. Res. Lett., 45, 2,213–2,220, https://doi.org/10.1002/2017GL076506.
Johnson, J. B., et al. (2020), Mapping the sources of proximal earthquake infrasound, Geophys. Res. Lett., 47, e2020GL091421 , https://doi.org/10.1029/2020GL091421.
Rosenblatt, B. B., et al. (2022), Controls on the frequency content of near-source infrasound at open-vent volcanoes: A case study from Volcán Villarrica, Chile, Bull. Volcanol., 84(12), 103, https://doi.org/10.1007/s00445-022-01607-y.
Scamfer, L. T., and J. F. Anderson (2023), Exploring background noise with a large‐N infrasound array: Waterfalls, thunderstorms, and earthquakes, Geophys. Res. Lett., 50, e2023GL104635, https://doi.org/10.1029/2023GL104635.
Slad, G., and B. Merchant (2021), Evaluation of Low Cost Infrasound Sensor Packages, Sandia Rep. SAND2021-13632, Sandia Natl. Lab., Albuquerque, N.M., https://doi.org/10.2172/1829264.
Tatum, T., J. F. Anderson, and T. J. Ronan (2023), Whitewater sound dependence on discharge and wave configuration at an adjustable wave feature, Water Resour. Res., 59, e2023WR034554, https://doi.org/10.1029/2023WR034554.
Author Information
Jeffrey B. Johnson (jeffreybjohnson@boisestate.edu), Jacob F. Anderson, Madeline A. Hunt, Owen A. Walsh, and Jerry C. Mock, Department of Geosciences, Boise State University, Idaho
Citation: Johnson, J. B., J. F. Anderson, M. A. Hunt, O. A. Walsh, and J. C. Mock (2026), Sensing the sounds from Earth’s hazardous environments, Eos, 107, https://doi.org/10.1029/2026EO260142. Published on 8 May 2026.
A new study (Sun et al. 2026) shows that in six earthquakes in China between 2010 and 2022, landslides and rockfalls were responsible for at least half of the total fatalities.
It is well-established that landslides are a major cause of loss of life in earthquakes in mountainous areas. The seismology maxim that “it is not earthquakes that kill people, it’s collapsing buildings” does not apply in its pure form in mountains – landslides also kill large numbers of people.
An earthquake
A new study (Sun et al. 2026) shows that in six earthquakes in China between 2010 and 2022, landslides and rockfalls were responsible for at least half of the total fatalities.
It is well-established that landslides are a major cause of loss of life in earthquakes in mountainous areas. The seismology maxim that “it is not earthquakes that kill people, it’s collapsing buildings” does not apply in its pure form in mountains – landslides also kill large numbers of people.
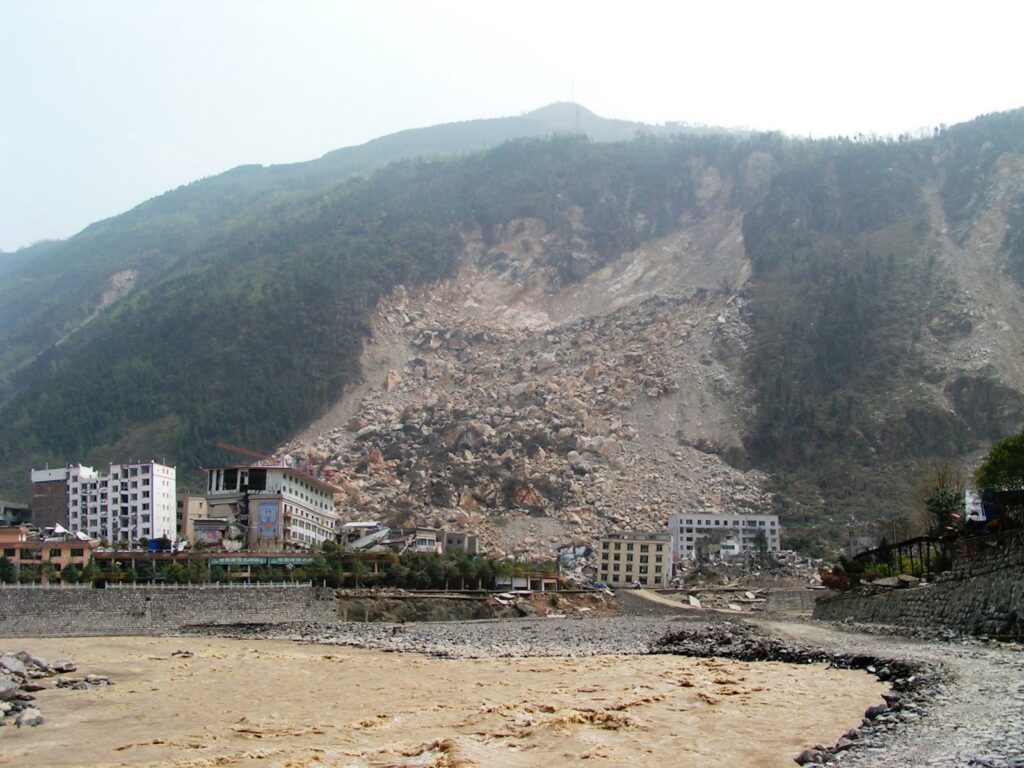
An earthquake triggered landslide from the 2008 Wenchuan earthquake.
However, the actual number of people killed by landslides in earthquakes is poorly understood. This is largely due to the challenges of collecting reliable information in the aftermath of a major earthquake, when the focus is on rescue and recovery rather than data collection. For this reason, many studies of landslide fatalities do not include seismically-triggered events. This is true of my own work.
However, a study has just been published (Sun et al. 2026) in the journal Natural Hazards Review that starts to address this issue. The paper nominally examines fatalities from all causes from earthquakes in China from 2001 to 2022. However, the authors note that the data has low reliability until 2010, so I’ll focus on the period from 2010 to 2022. I also note that the authors use the term “geological hazards“, which is a little broader than landslides. I should note that the paper isa broad look at fatalities from earthquakes – there is a much richer range of analyses than I will cover here.
In the period from 2010 to 2022, Sun et al. (2026) identified 14 earthquakes in which geological hazards caused loss of life. In some cases, the impacts were substantial. Thus, the M=6.5 3 August 2014 earthquake at Ludian in Yunnan led to 134 fatalities and 40 people missing from geological hazards from a total of 728 fatalities (c.24 % of the total), whilst the 5 September 2022 M=6.8 earthquake at Luding in Sichuan led to 76 geological hazard fatalities and 25 missing from a total of 118 fatalities (c.86% of the total). In six of the 14 examples, geological hazards caused at least 50% of the fatalities.
Sun et al. (2026) highlight that “fatalities from geological hazards concentrate in geologically complex, mountainous provinces, i.e., Sichuan, Yunnan, Gansu, Guangxi, and Guizhou”. They note that even small events can trigger fatal landslides – for example, six people were killed in a rockfall triggered by a M=4.3 earthquake in Guizhou in 2010, whilst a M=2.8 aftershock from the Yanjin earthquake in 2006 triggered a rockfall that killed a person.
This is an incredibly useful study. It starts to shed light on the impact of landslides in large earthquakes. It is not the definitive study, and questions remain – not least, the pattern of landslide losses in very large earthquakes, like the 2010 Wenchuan event, in which landslides were ferocious. But it forms the basis for such investigations, starting to fill a major gaps in our understanding.
Editors’ Highlights are summaries of recent papers by AGU’s journal editors.
Source: Journal of Geophysical Research: Solid Earth
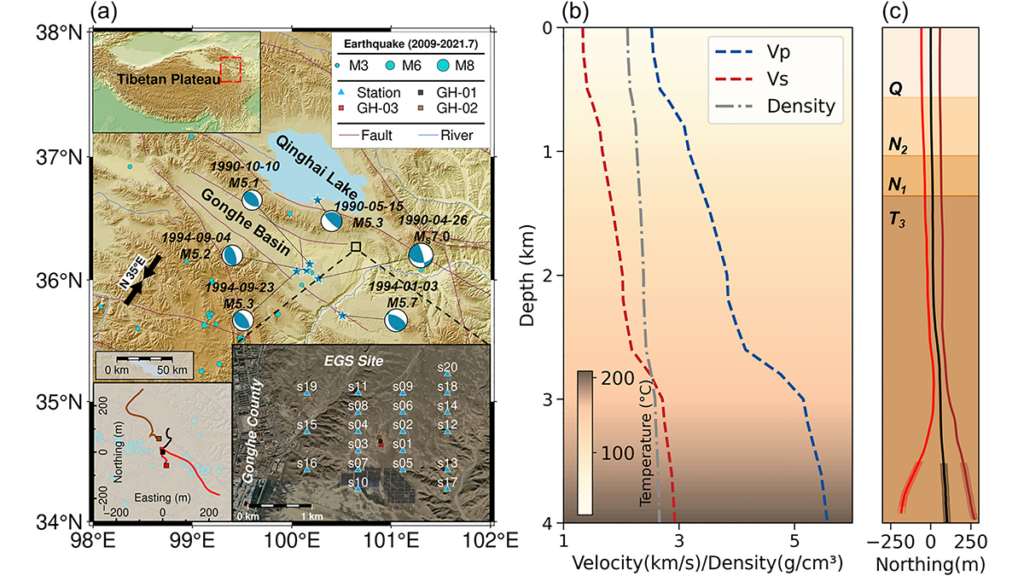
Enhanced Geothermal Systems (EGS) can expand low-carbon energy production, but fluid injection may trigger earthquakes whose locations and mechanisms are difficult to predict. Feng et al. [2026] investigate induced seismicity at China’s first EGS site in the Gonghe Basin using a comprehensive observational dataset. Machine learning processing of data from 20 su
Source: Journal of Geophysical Research: Solid Earth
Enhanced Geothermal Systems (EGS) can expand low-carbon energy production, but fluid injection may trigger earthquakes whose locations and mechanisms are difficult to predict. Feng et al. [2026] investigate induced seismicity at China’s first EGS site in the Gonghe Basin using a comprehensive observational dataset. Machine learning processing of data from 20 surface seismic stations produced a high-resolution earthquake catalog with well-constrained locations and focal mechanisms. Stress inversion and modeling, constrained by borehole stress measurements, reveal mechanically weak faults with low friction coefficients, indicating that low-to-moderate fluid overpressure can trigger seismic slip. Site-scale analysis shows that seismicity reflects shear reactivation of pre-existing natural faults, rather than the creation of new tensile fractures. Further integration with borehole image logs reveals a fine-scale relationship between the main seismogenic zones and stress heterogeneity, expressed as rotations of the principal stress axes that likely reflect localized lithological contrasts and fault-damage zones.
Together, these integrated analyses show that geothermal-induced seismicity is controlled by inherited fault architecture at the site scale and localized stress heterogeneity at the borehole scale. By linking seismic observations to borehole stress and image-log evidence, the study provides a more physically constrained framework for seismic-hazard assessment and stimulation design in enhanced geothermal reservoirs.
Citation: Feng, P., Wang, R., Zhang, H., Zhang, C., Schultz, R., & Yang, L. (2026). Pre-existing structures and stress variations jointly control the induced seismicity in enhanced geothermal system of Gonghe Basin, China. Journal of Geophysical Research: Solid Earth, 131, e2025JB033158. https://doi.org/10.1029/2025JB033158
Editors’ Highlights are summaries of recent papers by AGU’s journal editors.
Source: Journal of Geophysical Research: Solid Earth
Earthquakes release energy and result in source properties defined across a wide range of scales that are not represented in conventional frictional laws. Norisugi and Noda [2026] introduce a new rate- and roughness-dependent friction (RRF) law which incorporates both effects from fault slip rate and multi-scale variation in fault topography. By limiting the nu
Source: Journal of Geophysical Research: Solid Earth
Earthquakes release energy and result in source properties defined across a wide range of scales that are not represented in conventional frictional laws. Norisugi and Noda [2026] introduce a new rate- and roughness-dependent friction (RRF) law which incorporates both effects from fault slip rate and multi-scale variation in fault topography. By limiting the number of state variables in the RRF formulation, the authors show with efficient earthquake cycle simulation that this multi-scale approach can reproduce a key observed relationship between fracture energy and fault slip.
Although further refinement is needed to better represent roughness evolution, this study marks a major advance in earthquake modeling by demonstrating the necessity and feasibility of incorporating multi-scale fault topography in the characterization of earthquake source process.
Citation: Norisugi, R., & Noda, H. (2026). Multi-scale rate- and roughness-dependent frictional constitutive law and dynamic earthquake sequence simulation. Journal of Geophysical Research: Solid Earth, 131, e2025JB033580. https://doi.org/10.1029/2025JB033580
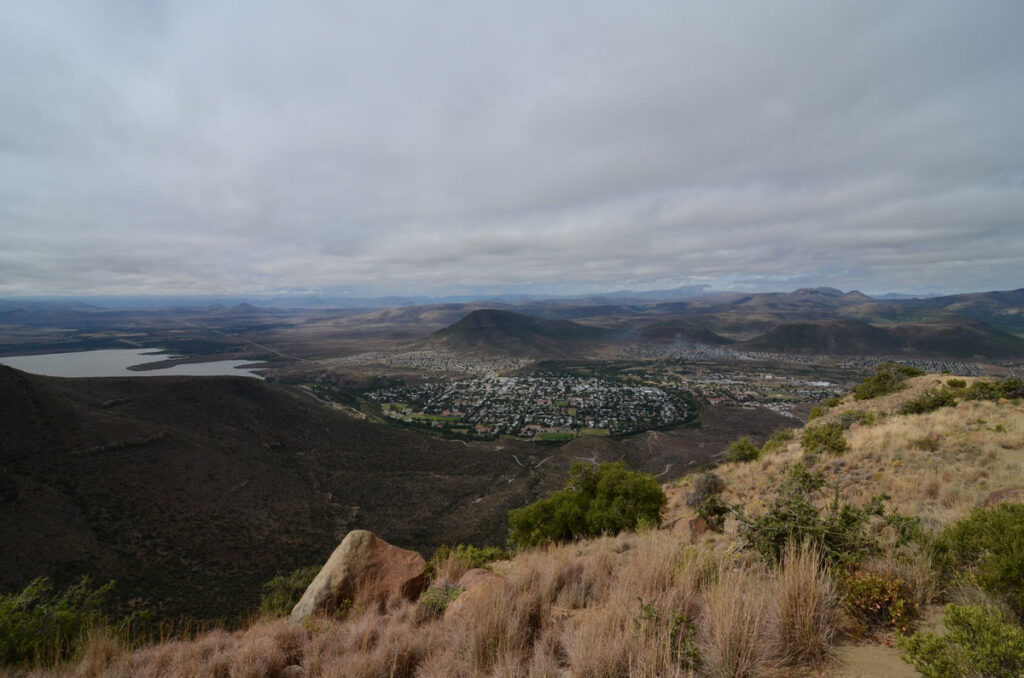
Roughly the size of Texas, the Karoo Basin of central western South Africa is brutally dry, sparsely populated, and known in part for its potentially “massive” hydrocarbon deposits.
South Africa, which consumes more energy than any other country in sub-Saharan Africa, has shown a growing interest in commercial fracking for shale gas and oil across the Karoo hinterland, with the country moving in late 2025 to lift a 13-year ban on shale gas exploration in the area.
However, a recent study
Roughly the size of Texas, the Karoo Basin of central western South Africa is brutally dry, sparsely populated, and known in part for its potentially “massive” hydrocarbon deposits.
South Africa, which consumes more energy than any other country in sub-Saharan Africa, has shown a growing interest in commercial fracking for shale gas and oil across the Karoo hinterland, with the country moving in late 2025 to lift a 13-year ban on shale gas exploration in the area.
However, a recent study from the University of Cape Town, published in Seismological Research Letters, cautioned that the Karoo might not be as seismologically calm as it appears, meaning fracking efforts could have the potential to induce earthquakes in the region.
A Swarm of Earthquakes
The researchers observed 66 earthquakes in this cluster between 2007 and 2022, ranging from 0.7 to 4.8 in magnitude.
The researchers investigated what they call a sudden swarm of earthquakes that occurred in the Leeu Gamka cluster, a region of the Karoo that was previously considered seismically stable. They observed 66 earthquakes in this cluster between 2007 and 2022, ranging from 0.7 to 4.8 in magnitude.
“The individual earthquakes here are very small,” said Alastair Sloan, a tectonics and structural geologist at the University of Cape Town.
Using ambient noise tomography, previous geophysical surveys, and information about the locations of past earthquakes, the researchers identified a critically stressed fault underlying the region. The fault appears to extend for at least 30 kilometers roughly west-northwest to east-northeast.
Looking at South Africa more generally, there are other places where there have been “fairly large” earthquakes with a similar orientation, Sloan said. He cited a series of large earthquakes in the early 20th century in a place called Koffiefontein, north of the study area, and the disastrous 1969 Tulbagh earthquake, west of the team’s study area.
Both of those earthquakes occurred in regions that are geologically similar to the Karoo, though they’re outside of the area being considered for shale gas exploration, Sloan said.
Fracking Risks?
In other parts of the globe, such as Oklahoma in the United States, processes related to oil and gas extraction have led to “induced earthquakes.” Most of these earthquakes have been triggered by wastewater disposal associated with oil production, not by fracking directly.
Researchers are unsure if industrial fluid injection in the Karoo, as is applied in shale gas fracking processes, could trigger significant seismic action in the region’s existing faults.
“Some locations which undergo shale gas development don’t see very much seismicity, and there is a catalog of things which need to be present for [seismicity] to be something that you would particularly worry about,” Sloan said.
For instance, if faults are only within the crystalline basement and therefore separated from the sedimentary layers where the fracking occurs, then it’s not likely they’ll be reactivated, because there’s no way for the fracking fluid to get down to the fault zone itself. Another factor, Sloan added, is that for significant earthquakes to occur, large faults that are already critically stressed need to be present in the region undergoing fracking.
The new study showed that both of these conditions may be met in the Karoo: Microseismicity does extend to the depths at which the carbonaceous shale is present. And this microseismicity is occurring on a reasonably extensive structure with a similar orientation to larger earthquakes that have already occurred in the region.
However, Sloan stressed, this isn’t a cause for immediate panic.
“I don’t want to be too alarmist; the size of the structure revealed by the microseismicity is not huge, and so we do not have evidence to expect an earthquake much larger than the damaging historical earthquakes that we have already seen in the wider region,” he said. “Globally, large earthquakes triggered by fracking (rather than associated deep wastewater exposure) are very rare, but the study suggests the necessary preconditions are present. And so the possibility needs to be considered and monitored carefully.”
Not Unique
Raymond Durrheim, a geoscientist and the South African Research Chair in Exploration, Earthquake and Mining Seismology at the University of the Witwatersrand, and who also examined the Ph.D. thesis on which the new study is based, said no area is perfectly seismically quiet.
“We know the way seismicity works in this whole area of southern Africa is that swarms occur,” he said. “They’ll last for years or even decades, and then they’ll die away. This is not a unique occurrence.”
This study was “useful,” though, Durrheim added, especially with the possibility of shale gas development in the Karoo. “It’s very important that we understand this because we know that when you inject fluid under high pressure, there’s always a chance you could trigger an earthquake,” he said, noting examples of fluid injection triggering earthquakes in places such as Canada. “It’s always a risk.”
To mitigate risks, Sloan suggested it would be useful to have a much denser network of seismometers within this region of South Africa.
Citation: Mwareya, R. (2026), A swarm of earthquakes in South Africa’s Karoo Basin poses questions for oil and gas development, Eos, 107, https://doi.org/10.1029/2026EO260159. Published on 20 May 2026.
Earthquake was region’s strongest tremor in nearly 150 years and was also felt in parts of Mexico including CancúnAn earthquake on Monday off the coast of Cuba, which was that region’s strongest tremor in nearly 150 years, could be felt in Florida and parts of Mexico.The 6.1-magnitude earthquake, which struck in the afternoon, occurred approximately 65 miles (105km) north-west of Mantua, Cuba, according to the US Geological Survey (USGS). The USGS added that the earthquake had a depth of 16 mile
Earthquake was region’s strongest tremor in nearly 150 years and was also felt in parts of Mexico including Cancún
An earthquake on Monday off the coast of Cuba, which was that region’s strongest tremor in nearly 150 years, could be felt in Florida and parts of Mexico.
The 6.1-magnitude earthquake, which struck in the afternoon, occurred approximately 65 miles (105km) north-west of Mantua, Cuba, according to the US Geological Survey (USGS). The USGS added that the earthquake had a depth of 16 miles.
Initial analyses suggest that the earthquake this morning has the potential to have triggered significant numbers of landslides and areas of liquefaction.
At the time of writing, the impacts of the M=7.8 earthquake that occurred offshore the south coast of Mindanao in the Philippines remain unclear. Initial reports in the local press suggest 15 fatalities so far, but as always it could be the case that there is no information from those areas most seriously impacted.
The USGS Pager s
Initial analyses suggest that the earthquake this morning has the potential to have triggered significant numbers of landslides and areas of liquefaction.
At the time of writing, the impacts of the M=7.8 earthquake that occurred offshore the south coast of Mindanao in the Philippines remain unclear. Initial reports in the local press suggest 15 fatalities so far, but as always it could be the case that there is no information from those areas most seriously impacted.
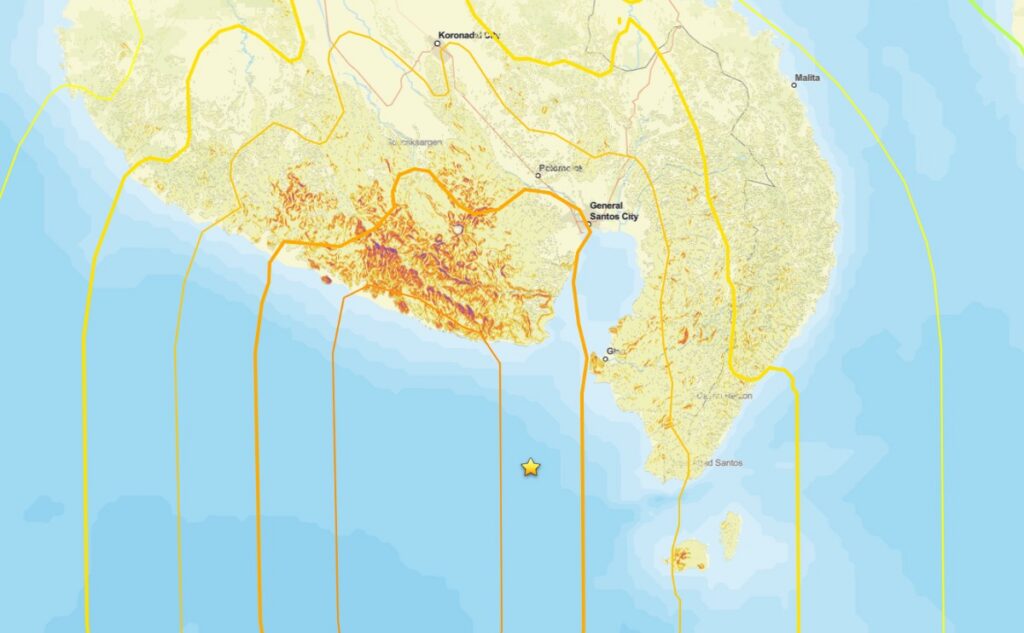
The USGS Pager site is the best source of information about potential landslide impacts, bearing in mind there is a high level of uncertainty. This estimates that the area exposed to landslides is at the high end of the “significant” scale and that the population exposed to landslides lies in the 1,000 to 10,000 people range. This is the Pager landslide hazard map:-
Initial Pager map of landslide hazard from the 8 June 2026 earthquake offshore Mindanao in the Philippines. Source: USGS.
The area with the highest level of landslide hazard is remote and rural, so we may not get good information from this area for a while.
The potential for liquefaction may be even more serious, with a broad swathe having a high level of hazard:-
Initial Pager map of liquefaction hazard from the 8 June 2026 earthquake offshore Mindanao in the Philippines. Source: USGS.
One final point to note is that the Philippines is just entering the typhoon season. Fortunately, Mindanao is sufficiently far south to be away from the main typhoon zone. However, these storms are so large that they can bring very heavy rainfall – see for example Typhoon Bopha in 2012. A similar event this year could have very significant consequences.
To date news reports suggest two fatal landslides with a combined toll of 17 people.
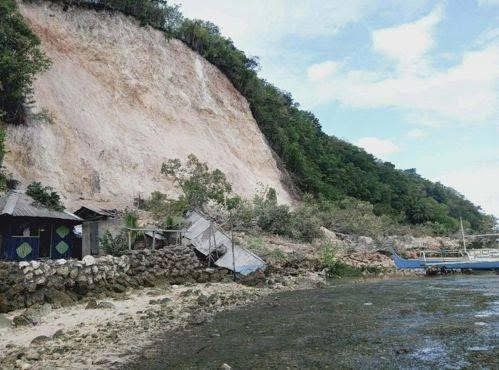
There are various news reports trickling in about the landslides triggered by the 8 June 2026 M=7.8 earthquake offshore Mindanao in the Philippines. As usual, the remote locations of many of the landslides means that the information is a bit hit and miss at this point.
To date, the most serious event appears to have occurred at a community called New Aklan, located in Glan, Sarangani. It appears that
To date news reports suggest two fatal landslides with a combined toll of 17 people.
There are various news reports trickling in about the landslides triggered by the 8 June 2026 M=7.8 earthquake offshore Mindanao in the Philippines. As usual, the remote locations of many of the landslides means that the information is a bit hit and miss at this point.
To date, the most serious event appears to have occurred at a community called New Aklan, located in Glan, Sarangani. It appears that New Aklan is at: [5.7705 N, 125.3356]. News reports indicate that 13 people were killed, although there are also indications of additional fatalities in this area.
A failure in a coastal cliff at Sitio Buhangin, Barangay Patuco, Sarangani following the 8 June 2026 earthquake near Mindanao. Image tweeted by Radyo Pilipinas.
As the Indian and Eurasian continental plates collide, the Tibetan Plateau is slowly deforming. For decades, geoscientists debated how this deformation occurs: Is the plateau like a block of crumbly aged cheddar, deforming mostly at its faults, or is it more like French brie, moving like a very viscous liquid being pushed slowly to the east?
A new study published in Science shows that both theories are at work. The study’s findings provide the most comprehensive picture yet of the Tibetan Pl
As the Indian and Eurasian continental plates collide, the Tibetan Plateau is slowly deforming. For decades, geoscientists debated how this deformation occurs: Is the plateau like a block of crumbly aged cheddar, deforming mostly at its faults, or is it more like French brie, moving like a very viscous liquid being pushed slowly to the east?
A new study published in Science shows that both theories are at work. The study’s findings provide the most comprehensive picture yet of the Tibetan Plateau’s deformation and offer valuable information for earthquake hazard assessments in the region.
The new model that combines the two theories is a “significant advance,” said Eric Fielding, a geodesist who was not involved in the study. Fielding is a staff member at NASA’s Jet Propulsion Laboratory but did not speak on behalf of the agency. “It’s clearly the result of a very large amount of work,” he said.
A Deformation Investigation
For decades, scientists have held differing views on the Tibetan Plateau’s deformation. One camp modeled the plateau’s deformation with movement occurring mostly at its faults, while the other modeled the movement like a thick fluid deforming areas beyond faults.
“These two communities have carried on modeling deformation in different ways” and have never fully resolved the differences between their models, said Tim Wright, a geodesist at the University of Leeds in the United Kingdom and lead author of the new study.
It’s tricky to measure the plateau’s deformation, though, because it changes so slowly: One of the fastest faults on the plateau, the Kunlun Fault, moves at about just 10 millimeters per year. “These are rates that are less than your fingernails growing,” Wright said.
And because much of the Tibetan Plateau’s terrain is inaccessible, there’s a dearth of ground-based stations to track movement, meaning most geodetic data for the area must come from satellites.
“It’s a boon for science to have that consistent acquisition of the same kind of data for 10 years.”
Tracking such nearly imperceptible movement with satellites hundreds of kilometers above requires enormous amounts of data collected over many years. Wright and his colleagues finally had those data after 10 years of observations from the European Space Agency’s Sentinel-1 satellite mission, which launched in 2014.
“Because the signals are so small, you need to wait for some time before you accrue enough deformation that you can actually measure it,” Wright said. The 2014–2024 data they analyzed are “giving us a really clean signal,” he said.
“It’s a boon for science to have that consistent acquisition of the same kind of data for 10 years,” Fielding said.
Using tens of thousands of satellite images alongside ground-based satellite navigation system stations, Wright and the team constructed comprehensive velocity maps of the deformation of the plateau. Results showed that a mix of theories best describes the mechanism.
“We think what’s really happening is a combination of both,” Wright said.
Wright, who described himself as “formerly of the viscous deformation camp,” was surprised by the prominent role that faults played in the plateau’s deformation. Previously, he said, he would have described the faults as passive markers within the underlying flow of the landmass. But the data show that the faults influence a much broader area of the plateau: “The whole deformation of the plateau is influenced by those faults,” he said.
The study “shows clearly that these major fault systems are responsible for a large part of the strain within the plateau,” Fielding said.
Mapping Seismic Hazards
“We have very little information about the history of earthquakes on these faults in this area.”
Knowing how the plateau deforms can also help scientists create more accurate seismic hazard assessments for the millions of people who may be affected by earthquakes there, particularly at the edges of the plateau. “We have very little information about the history of earthquakes on these faults in this area,” Fielding said.
The research team is working with the Global Earthquake Model Foundation, a nonprofit earthquake research collaboration, and other organizations to incorporate their findings into hazard assessments.
Wright and the research team recently used a similar methodology to map the deformation field of the entire Alpine-Himalayan belt, which stretches from Spain to eastern China. The same methods could be used to map the deformation of the western United States, another area where both viscous and fault-related deformation may affect large population centers, Fielding said.
Citation: van Deelen, G. (2026), Weak faults play a strong role in the Tibetan Plateau’s deformation, Eos, 107, https://doi.org/10.1029/2026EO260162. Published on 22 May 2026.