Normal view

Mysterious signals keep coming from space. We have found their ‘Rosetta stone’

Simulated magnetic field lines for a binary system that is close enough for the stars to interact. Carl Knox (OzGrav/Swinburne) & Joshua Preston Pritchard (CSIRO)

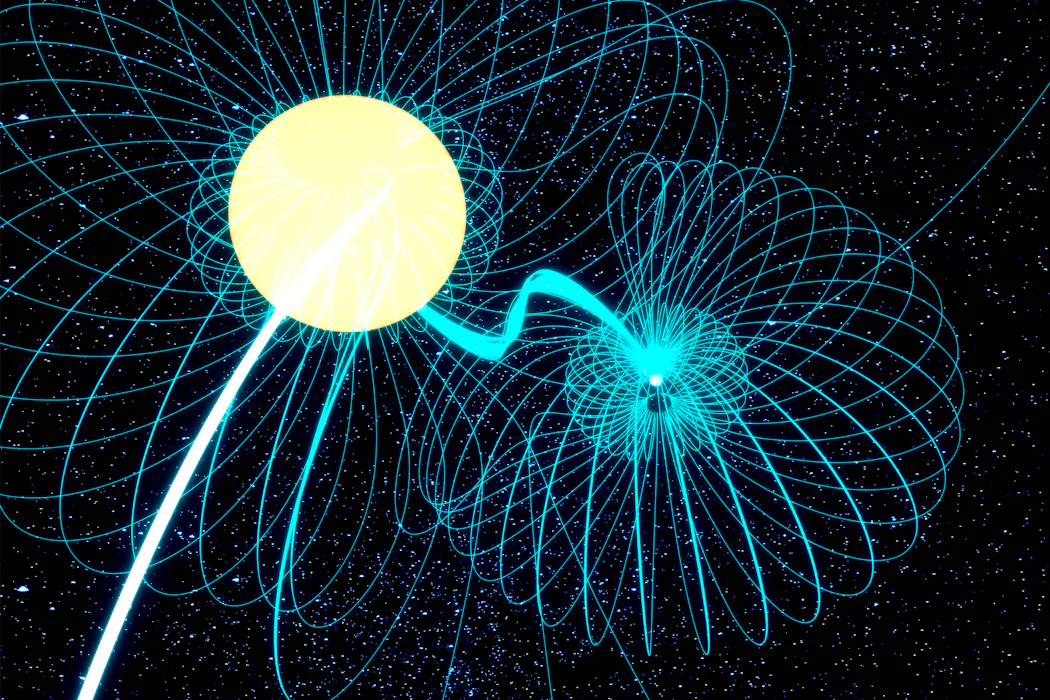
A pair of stars spiralling around each other. That’s the origin of a new source of repeating radio bursts we’ve detected, called ASKAP J1745.

In recent years, astronomers have been puzzling over mysterious bursts of radio signals, known as long-period transients because of how slowly they repeat. They were first discovered by chance with telescopes scanning large chunks of the sky.

To date, astronomers have only found a dozen of these weird sources, and we’re still trying to understand exactly what they are.

In a new study published today in Nature Astronomy, we describe a first-of-its-kind detection – both radio and X-ray bursts repeating with each orbit.

ASKAP J1745 is exciting because we’ve figured out what it is, unlike 10 of the 12 known long-period transients. Even better, we were able to detect it with a bunch of different telescopes that observe all different kinds of light.

Bearing the same message in three forms of writing, the famous Rosetta stone once helped scholars decipher ancient Egyptian hieroglyphs. Similarly, this extra information we found about ASKAP J1745 will help astronomers better understand the mystery of all long-period transients.

What do long-period radio transients look like?

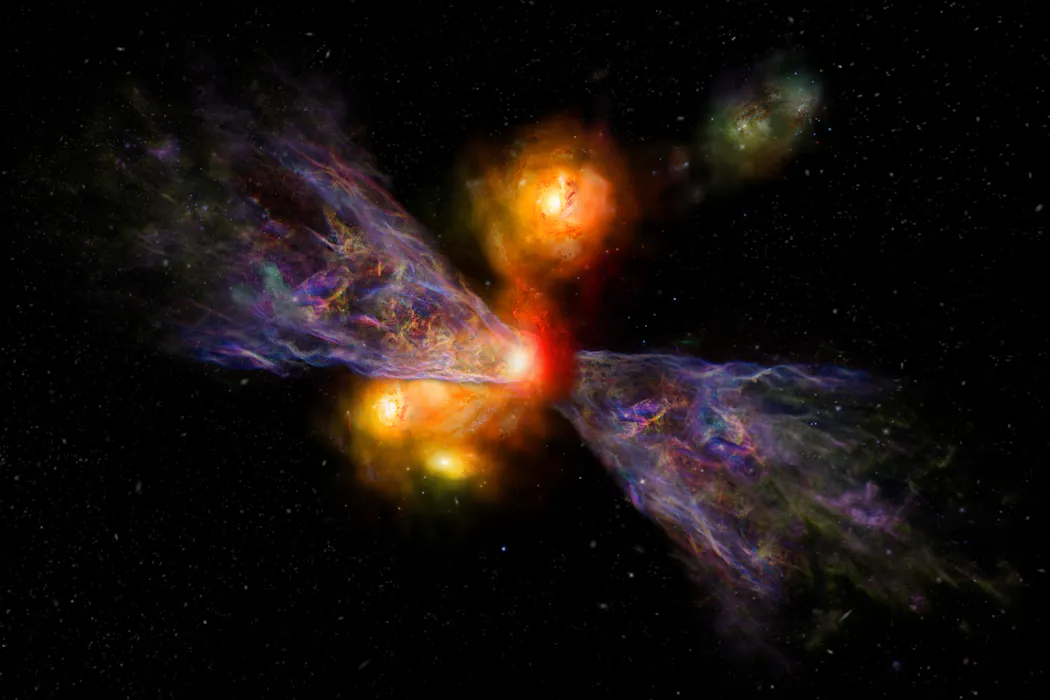
Long-period transients are things in space that produce bright, repeating bursts of light at radio wavelengths. Little is known about the origins of most long-period transients. In addition, many have been discovered close to the dusty region in the middle of our galaxy, so it can be hard to see them with visible-light telescopes.

Even with just a dozen of these strange sources discovered so far, they seem to come in a few different shapes and sizes. Their radio bursts repeat on timescales of minutes to hours.

Some have been making regular pulses for more than 30 years, while others turn off for days at a time or go permanently radio-silent.

Galactic map of long-period transients (LPTs), including those with evidence of binary systems, and galactic centre radio transients (GCRTs). Author-provided composite. Background image: ESA/Gaia/DPAC, A. Moitnho

Where do they come from?

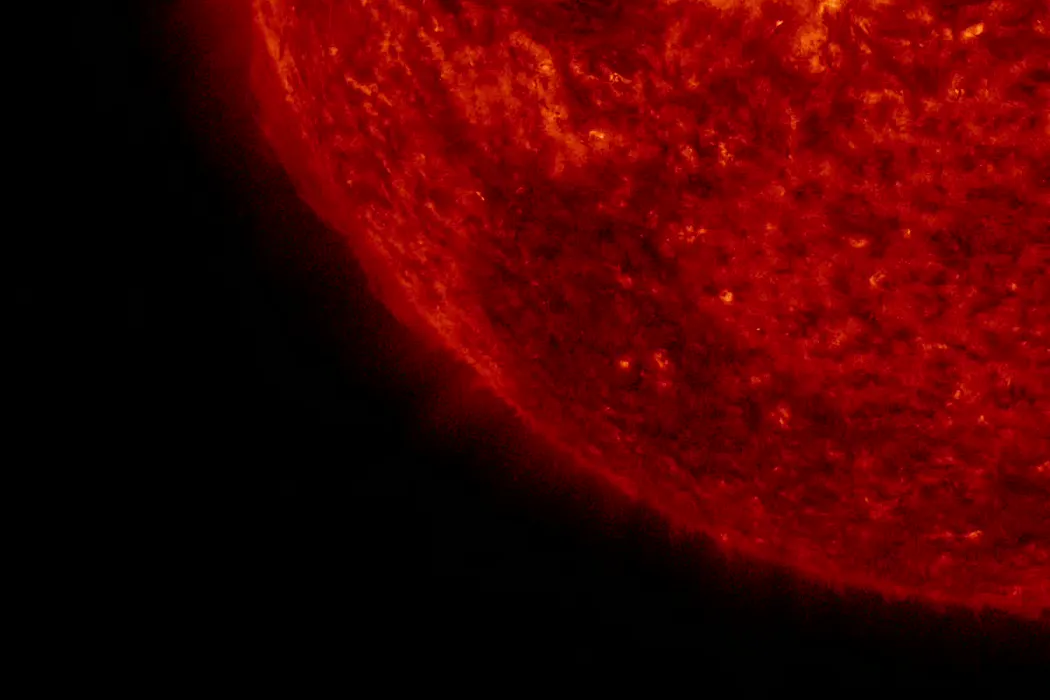
Astronomers initially thought long-period transients were just very slowly spinning neutron stars, called pulsars. These are the fast-rotating dense cores left after the supernova explosions of massive stars.

The first few of these radio transients discovered were repeating roughly every 20 minutes. That’s much slower than the average pulsar, which repeats every few seconds.

Furthermore, when pulsars slow down their spin, they should stop producing radio light. This means we shouldn’t see radio bursts from neutron stars rotating so slowly.

So astronomers investigated other theories involving white dwarfs – the slowly cooling dead centres of less massive stars. And recently we discovered some long-period transients in binary systems (two stars in a close orbit) with evidence of both a white dwarf and a lower-mass red dwarf star.

The ASKAP radio telescope at Inyarrimanha Ilgari Bundara, the CSIRO Murchison Radio-astronomy Observatory on Wajarri Yamaji Country in Western Australia. Alex Cherney/CSIRO

The discovery of ASKAP J1745

ASKAP J1745 is a new long-period radio transient we found with the ASKAP radio telescope, owned and operated by CSIRO, Australia’s national science agency. It’s the first one of these strange sources that we’ve identified as a “cataclysmic variable”.

Cataclysmic variables are systems with two stars – one of them a white dwarf – that orbit each other closely enough to interact. If the stars are close enough, the white dwarf’s gravity can pull (or “accrete”) material from the other star. That’s why these systems are also known as accreting white dwarf binaries.

Another long-period radio transient was recently discovered with X-ray bursts, repeating with the same regularity as the radio. However, the origin of the bursts and their shared timing remained unclear.

Now, for the first time, we have combined observations from radio, X-ray and optical telescopes to find that ASKAP J1745 produces both X-ray and radio bursts with each orbit of its two stars.

Simulation of magnetic fields in a closely orbiting binary system. Carl Knox (OzGrav/Swinburne) & Joshua Preston Pritchard (CSIRO)

In these rapidly orbiting systems, the X-ray light is thought to come from the material heating up as it streams onto the white dwarf.

The bright radio bursts were a bit more of a mystery. But knowing that this is an accreting binary system helped us figure things out.

The type of pulsed radio light we detected is typically caused by energetic particles interacting with strong magnetic fields. Here, we have the perfect combination: two stars with strong magnetic fields (typically thousands of times stronger than an MRI machine), with charged particles flowing towards the white dwarf from the other star.

What this means for the future of astronomy

This discovery is unique because we have more information and at more different wavelengths than any other previous long-period transient.

Just like the Rosetta stone was key to decoding ancient Egyptian symbols, ASKAP J1745 will be key to deciphering the origins of other long-period radio transients that lack information at other wavelengths.

ASKAP J1745 is the first long-period transient showing signs of accretion across the spectrum of light – from radio waves to visible to X-rays. And this stream of charged material is a crucial ingredient for making the radio light we detect from these systems.

Exploring the mechanism that produces long-period radio bursts gives us a new laboratory to learn about extreme physics such as plasma flows and magnetic fields in conditions we can’t recreate on Earth.

We acknowledge the Wajarri Yamaji as the Traditional Owners and Native Title Holders of Inyarrimanha Ilgari Bundara, the CSIRO Murchison Radio-astronomy Observatory where ASKAP is located.

The Conversation

Kovi Rose does not work for, consult, own shares in or receive funding from any company or organisation that would benefit from this article, and has disclosed no relevant affiliations beyond their academic appointment.

South African telescope detects record-breaking signal from the early universe

Astronomers using the MeerKAT radio telescope in South Africa have discovered the most distant hydroxyl megamaser ever detected, opening a new radio astronomy frontier. A hydroxyl megamaser is a natural space laser, and this one is located in a violently merging galaxy more than 8 billion light-years away.

We spoke to the astronomers, Thato Manamela, a postdoctoral researcher at the University of Pretoria, and Roger Deane, director of the Inter-University Institute for Data Intensive Astronomy and a professor at the universities of Cape Town and Pretoria, about their study.

What you’ve found has been described as a ‘new frontier’ in space research. Why is it extraordinary?

This discovery is extraordinary because of the record distance at which we’ve detected it, over eight billion light-years away. That places it deep into the early universe. This means that we aren’t seeing the galaxy as it exists today. We are seeing it as it was 8 billion years ago. Since the Big Bang happened about 13.8 billion years ago, we are looking at a “toddler” version of the universe. At that stage where the maser signal was transmitted by the host galaxy, galaxies were much more “chaotic”, they collided more often and were much more active than the stable, mature galaxies we see nearby today.

It gives us a rare glimpse of galaxy interactions and extreme star-forming environments when the cosmos was less than half its current age. Think of light like a letter in the mail. If a friend sends a letter from overseas, by the time you read it, the news is old. In space, light is the letter. The “news” from this galaxy took 8 billion years to reach us. We see the galaxy as a “toddler” even though, in its own time, it has already grown up or changed.

We detected this megamaser, which operates on a scale of power millions of times greater than a typical galactic maser. Both megamasers and gigamasers are cosmic radio lasers. While a megamaser is a million times more luminous than a standard maser found in the local universe, a gigamaser is a billion times more luminous, making it 1,000 times more powerful than a megamaser.

In just five hours of observing time we found a signal that typically requires hundreds of hours of observation, given its distance and rarity. But gravitational lensing boosted the signal enough to detect it. Additionally, while we were targeting neutral hydrogen, MeerKAT’s wide bandwidth enabled the surprise discovery of the megamaser signal in the same data.

This rapid detection suggests that future surveys with MeerKAT and the upcoming SKA Observatory could uncover many more such distant, extreme objects. Its ability to find this so quickly proves that we finally have the technology to see faint signals from the very distant past. It’s a preview of what the upcoming Square Kilometre Array (SKA), a unique, one-of-a-kind international mega-project, might achieve.

But a highly complementary next-generation facility called the next-generation Very Large Array (ngVLA) is being planned and designed for construction in the US. The SKA Observatory (SKA-Low and SKA-Mid) focuses on low-to-mid radio frequencies. The ngVLA will operate at much higher frequencies. Together, they will form two of the major pillars of next-generation global radio astronomy. The finding gives astronomers a new way to study how galaxies evolved in the early universe.

What technologies or capabilities made this possible?

The discovery was made possible by the sensitivity and wide frequency coverage of the MeerKAT radio telescope. Its ability to detect faint signals over a broad frequency range allows us to search for spectral lines across large cosmic volumes. A spectral line is a cosmic chemical fingerprint. Every atom or molecule emits electromagnetic waves at specific frequencies. Detecting those frequencies tells astronomers what the gas is made of.

In this case, MeerKAT’s wide bandwidth allowed us to detect both the hydroxyl line and neutral hydrogen absorption in a single observation. Previously, with older technology, this would have taken two separate observations.

Equally important are advances in data processing and computing. The data were processed using high-performance computing resources at the Inter-University Institute for Data Intensive Astronomy (IDIA).

Processing such massive amounts of data is like trying to drink from a firehose. MeerKAT collects gigabytes of information every second, resulting in files far too large for a standard computer to handle. To find a signal from 8 billion years ago, which is millions of times fainter than a cell phone signal, we must use robust calibration pipelines. These act like an automated high-tech car wash to scrub away digital noise and sharpen the telescope’s focus. This “cleaning” process requires trillions of mathematical calculations, necessitating the use of supercomputers that work for days to transform raw radio interference into a clear scientific discovery.

Gravitational lensing also played a key role. A massive foreground object, like a star or galaxy, for example, amplified the signal from the distant galaxy, effectively acting as a natural telescope and boosting our ability to detect it.

How does what you’ve found change our understanding of the universe?

It’s rare that a single astrophysical system, a collection of celestial objects, in this case, two galaxies forming a lens system, can change our understanding of the universe. We typically need large sample sizes to do that. But the combination of the recording-breaking distance and the speed of the discovery was impressive.

It suggests that systematic searches – such as those conducted by deep MeerKAT surveys – could convert these once-rare finds into powerful probes of extreme, yet highly obscured star formation in the distant universe. As a result of this observation, the SKA Observatory and other future telescopes won’t just be looking for more of the same; they will be looking for hidden history.

Hydroxyl megamasers are usually associated with galaxy mergers. We expect some galaxy mergers to host pairs of supermassive black holes. Almost every large galaxy has a supermassive black hole at its centre. When galaxies merge, the supermassive black holes at their centres can eventually spiral towards each other, producing gravitational waves, ripples in space-time. Finding systems like this helps astronomers study an important stage in galaxy evolution and the environments where these extreme events occur.

By using megamasers to find these pairs, we can study the final stages of how the largest objects in the universe are built. This is a major milestone in a galaxy’s life. By finding these galaxies now, we are catching them at a key evolutionary stage, the final countdown before they collide and release a massive burst of energy that our next generation of detectors will be able to hear.

The strength of the MeerKAT-detected hydroxyl signal after such a short observation time therefore implies that astronomers will be able to detect large numbers of these systems across most of cosmic time.

What does the discovery say about South Africa’s place in data-intensive radio astronomy?

This discovery highlights South Africa’s leading role in radio astronomy. Facilities such as MeerKAT, combined with data-intensive platforms like IDIA, provide world-class capabilities for both observation and analysis. It also demonstrates strong local expertise in handling large, complex datasets.

Discoveries like this rely on advanced data processing, signal extraction and scientific interpretation. These are all key strengths within the South African research community. As we move from using current scout telescopes like MeerKAT to building and operating the world’s largest radio observatory, the SKAO, South Africa is well positioned to remain a hub for data-intensive astronomy. Results like this reinforce the country’s role in shaping the future of the field.

The Conversation

Thato Manamela works for the University of Pretoria. He receives funding from the National Research Foundation (NRF SARAO). He is affiliated with UP and IDIA.

Roger P. Deane previously held an SKA Research Chair in Radio Astronomy, funded by the South African Radio Astronomy Observatory, which is a facility of the National Research Foundation (NRF), an agency of the Department of Science, Technology and Innovation (DSTI).

Astronomers found a galaxy in the throes of death – and they know what’s killing it

Powerful galaxy winds that blast gas into space may be a common killer of massive galaxies in the early universe. Joshua Worth, CC BY

At the start of cosmic history, galaxies were big clouds of gas, and they grew by turning that gas into stars. If a galaxy runs out of gas, it will stop forming stars and die.

Present-day galaxies have had more than 10 billion years to grow old and die. But this is not true in the early universe: we expect to see very few dead galaxies in the first billion years of cosmic time.

In 2022, the James Webb Space Telescope gave us our first clear glimpse of galaxies in the early universe. What we saw completely defied our expectations: there were too many big, dead galaxies, far earlier than expected.

Astronomers came up with many possible explanations. Some suggested that dark energy – the mysterious phenomenon believed to be driving the universe’s expansion – may have been stronger in the early universe than current theories predict. This would allow galaxies to grow (and die) faster. However, the real solution may be much simpler.

Our new study, published today in the Monthly Notices of the Royal Astronomical Society, reveals an early massive galaxy in the throes of death: its gas is being rapidly blasted into space by a powerful “galaxy wind”, and it may very soon run out of gas. This galaxy offers a new solution to the mystery of what killed big galaxies in the early universe.

Prime suspects for massive galaxy death

There are two ways to eject gas from galaxies: exploding stars (called supernovae) that push gas away, and supermassive black holes that accelerate gas to such high speeds that it escapes the gravitational pull of the galaxy. Both produce fast-moving gas streams that astronomers call galaxy winds.

These winds have long been considered one of the main causes of galaxy death.

Black holes produce faster winds than exploding stars, making them the favoured means for ejecting gas from the largest, most massive galaxies. Many theories suggest that only the powerful winds driven by supermassive black holes can kill the largest galaxies.

However, testing these predictions is hard. As the gas in the wind leaves a galaxy, it becomes very faint very quickly, making galaxy winds difficult to see even in nearby galaxies.

In distant galaxies, they were almost invisible until recently.

Transforming our view of the early universe

Designed to look deeper in space than any telescope before it, the James Webb Space Telescope has transformed our view of the early universe. It allows us to see things that were previously undetectable – including hot, fast-moving gas ejected from early massive galaxies.

For our new study, we paired observations from the James Webb Space Telescope with data from the Atacama Large Millimeter Array, the world’s most powerful radio telescope, which measures cold star-forming gas swept out of galaxies by winds.

Together, these telescopes give us the most complete picture yet of galaxy winds in the early universe.

One galaxy, called CRISTAL-02, stood out to us immediately. We noticed it was forming stars twice as fast as other similar-sized galaxies. Our extremely sensitive observations revealed a huge plume of cold gas extending far away from CRISTAL-02. This plume was almost as long as the galaxy itself – a telltale sign the gas was being driven out of the galaxy.

The wind from CRISTAL-02 was ejecting twice as much gas as the galaxy converts into stars, and this gas was likely travelling fast enough to escape the galaxy. If the wind kept ejecting gas at the same rate, the galaxy would run out of fuel in less than 100 million years – a blink of an eye in cosmic terms – forming a massive dead galaxy less than 1.5 billion years after the Big Bang.

Paradoxically, the wind appeared to be driven by the same intense star formation that was making the galaxy grow so quickly.

A patch of orange, green and purple light against a black background.
The cold gas plume (white contours) extends away from CRISTAL-02, revealing a galaxy wind. Rebecca Davies

Cosmic collisions may hold the answer

To complete the picture, we need to understand why CRISTAL-02 was growing so fast in the first place.

The answer may lie in the fact that CRISTAL-02 is not a single galaxy, but multiple galaxies in the final stages of a cosmic collision. During such collisions, gas funnels towards the galaxy centres, triggering strong bursts of star formation.

In the present-day universe, galaxy collisions are relatively rare: they are seen in only a few percent of galaxies. But one billion years after the Big Bang, the universe was far more compact, meaning galaxies were packed much closer together.

Recent studies suggest around 40% of big galaxies in the early universe are in the process of merging. Some of these galaxies will likely face a similar fate to CRISTAL-02: undergoing frenzied bursts of star-formation, followed by powerful winds that lead to their deaths.

Our findings show that powerful winds capable of killing galaxies do not originate exclusively from supermassive black holes: they can also be triggered by the intense star-formation that causes galaxies to grow rapidly.

If many early galaxies collide and experience rapid growth, then it may not be surprising at all that we see so many dead galaxies in the early universe. CRISTAL-02 offers a natural solution to the mystery of why these massive galaxies live fast and die young.

The Conversation

Rebecca Davies receives funding from the Australian Research Council.

Deanne Fisher receives funding from Australian Research Council.

We tested the new World Cup ball – this is what you need to know about how it will fly, dip and swerve

Small variations in the ball can influence how it behaves once it leaves the foot. Robbie Jay Barratt/AMA/Getty Images

Every four years, the men’s World Cup delivers some certainties. The pitch dimensions are tightly regulated, offside is signaled with a flag, and referees end the match with a blast of a whistle. But one key piece of equipment is changed on purpose: the ball.

Adidas, which has supplied World Cup soccer balls since 1970, introduces a new match ball for every tournament, and with that comes fresh aerodynamic calculations for players. How will it fly through the air, weave and dip?

For the past 20 years, my engineering colleagues in Japan and England and I have put the new balls through their paces, investigating soccer ball aerodynamics. Our work begins by putting balls in wind tunnels to measure drag, side and lift forces. We use the measurements from these tests in trajectory simulations that tell us how the ball will behave in a real-game setting.

Putting the 2026 World Cup ball through the wind tunnel test.

That may all sound a little academic, and we do produce an academic paper on our findings. But what our data indicates could mean the difference between a goal or a miss for strikers, a save or a blunder for goalkeepers, and jubilation or heartache for fans.

At the World Cup, the ball is the most important piece of equipment in the biggest tournament of the world’s most popular sport.

This year’s ball, the Trionda, is especially interesting. When FIFA and Adidas unveiled it in fall 2025, the first thing many people noticed was the color and the paneling.

An orange ball and a black and white ball are under a trophy.
Earlier World Cup balls used many panels; modern balls use far fewer. Manfred Rehm/picture alliance via Getty Images

The ball’s red, blue and green graphics correspond to the three host countries, with maple leaf, star and eagle motifs representing Canada, the United States and Mexico. And for the first time in men’s World Cup history, matches will be played with a four-panel ball.

But with so few panels, has Adidas made the ball too smooth? That is the trap engineers fell into with the Jabulani ball used at the 2010 World Cup in South Africa that became notorious for sudden dips and swerves, which made goalkeepers’ lives far trickier.

You do not want the World Cup ball to feel like the start of a science experiment once it is in the air. And if it behaves strangely, players and goalkeepers notice immediately.

The evolution of soccer balls

World Cup balls have come a long way over the decades. If you go back to 1930, the ball looked very different. The first World Cup final used two different leather balls: Argentina’s Tiento in the first half and Uruguay’s T-Model in the second. Both were hand-sewn, multipaneled balls, inflated through a bladder opening that had to be tied off and tucked back beneath the laces. In damp conditions, the leather absorbed water, making the ball heavier and less predictable in play.

A ball nestles in the top of a goal.
Uruguayan keeper Enrique Ballestrero fails to save a shot from Argentina’s Carlos Peucelle in the final of the first World Cup. Keystone/Getty Images

By 1994 – when the United States last hosted the men’s tournament – the official ball, Adidas’ Questra, had evolved into a foam-based design. The modern World Cup ball is no longer just stitched leather. It is an engineered aerodynamic surface.

Trionda pushes that evolution further. It has only four panels, the fewest in men’s World Cup history, which have been thermally bonded – melded together using heat and adhesive.

Fewer panels might suggest less total seam length and therefore a smoother ball. And smoothness matters because the thin boundary layer of air clinging to the ball determines where the flow separates, how large a wake forms, and how much drag the ball experiences.

The Trionda has intentionally deep seams, three pronounced grooves on each panel and fine surface texturing.

But will these textures and grooves do the trick? To find that out, my colleagues and I measured the ball’s seam geometry and overall aerodynamic behavior. We compared it with Trionda’s four predecessors: 2022’s Al Rihla, 2018’s Telstar 18, the Brazuca used in 2014 and the Jabulani in 2010.

What the measurements show

In our wind tunnel tests at the University of Tsukuba, we measured something called the drag coefficient, which is a way of describing how much air resistance a ball experiences as it moves.

Using this data, we gained insights into how the airflow changes around the ball after it is kicked. The tests helped identify the drag crisis, the speed range in which changes in the boundary layer and flow separation produce a sharp change in drag, which can alter the ball’s acceleration, trajectory and range.

A ball is seen suspended.
The Trionda soccer ball prepares for the wind tunnel. Goff/Hong/Liu/Asai

We found that the Trionda is effectively rougher than those predecessors.

Trionda reaches its drag crisis at a lower speed, at about 27 mph (43 kph). That is below the roughly 31-40 mph (50-65 kph) range for Al Rihla, Telstar 18 and Brazuca, and far below Jabulani’s roughly 49-60 mph (79-97 kph) range, depending on orientation.

Why does all that matter? Because a ball can feel ordinary off the boot and still behave differently in flight. When the drag crisis occurs in the middle of game-relevant speeds, small changes in launch speed, orientation or spin can shift the ball from one aerodynamic regime to another.

That was Jabulani’s problem. Once kicked with little spin, it had a tendency to slow down too much as it passed through its critical-speed range.

Trionda does not look like that kind of ball. It has a more steady and consistent drag coefficient in the range of speeds associated with corner kicks and free kicks.

But there is a trade-off. Our measurements also showed that once Trionda enters the higher-speed, turbulent-flow regime, its drag coefficients are somewhat larger than those of Brazuca, Telstar 18 and Al Rihla.

In plain language, that suggests a hard-hit long ball may lose a little range.

In our simulations, the difference is not huge. But it is large enough that players may notice long kicks coming up a few meters short.

It is also important to note that we tested a nonspinning ball. As such, our results do not provide a prediction of every pass, clearance or free kick fans will see this summer. Balls in flight often spin due to off-center kicks. That, along with altitude, humidity, temperature and air pressure all influence how a ball flies through the air once kicked.

A ball mounted on a rod.
Close-up of the Trionda ball during wind tunnel testing. Goff/Hong/Liu/Asai

The big test yet to come

Fewer panels and more texturing aren’t the only differences with the new ball.

Trionda also carries technology that has little to do with its flight and a great deal to do with officiating. Like Al Rihla, Trionda includes “connected-ball technology” that lets computers know when the ball is kicked, helping with offside decisions.

But the architecture has changed. In 2022, the measurement unit was suspended at the center of the ball. With Trionda, it sits in a specially created layer inside one panel, with counterbalancing weights in the other three panels. The chip sends data to the video assistant referee, or VAR, system and the tournament’s semi-automated offside system.

That tweak will help referees, but will the new ball in general help or hinder players?

The evidence from our tests suggests that the ball won’t be behaving in a way that leads to baffling and erratic flight.

But the more intriguing possibilities are subtler and outside the scope of our tests. Will the grooves on Trionda help players generate more backspin on the ball, generating more lift and possibly offsetting Trionda’s somewhat larger high-speed drag coefficient?

That is why I keep studying World Cup balls both in the lab and through their behavior in play. Every four years, a new design offers a fresh way to watch physics enter the game, not in theory, but in the movement of an object in which every player on the soccer field must place their trust.

The Conversation

John Eric Goff currently works as a visitor in the Department of Physics at the University of Puget Sound in Tacoma, Washington. Following the conclusion on 30 June of that one-year appointment, he will start on 1 July as Professor of Engineering Practice in the Weldon School of Biomedical Engineering and the School of Mechanical Engineering at Purdue University.

Falling space debris poses an escalating risk as spacecraft get stronger and more heat resistant

Not all space debris burns up in the atmosphere before it makes it back to Earth. PaulFleet/iStock via Getty Images

When it comes to space debris, what goes up is coming down more often – and not safely.

When spacecraft launch, some components, including nonreusable rocket boosters, are jettisoned to decrease weight, leaving them to intentionally burn up as they reenter the atmosphere. Satellites also enter the atmosphere at the end of their life, supposedly burning up. But in many cases, they are not doing so as predicted.

Debris from partially burned-up spacecraft components and satellites reentering Earth’s atmosphere can pose a risk to people and structures on the ground. The surge in launches, driven largely by private players such as SpaceX, is turning a once-remote risk into a growing threat.

Our materials research group at the University of Wisconsin-Stout is studying the materials that allow reentry debris to survive. We look for ways to safely modify their exceptional heat-resistant qualities to make them safer for atmospheric reentry.

Debris landing on Earth

Reentry debris has fallen on both private and public property around the world multiple times since 2021. Some of the most notable events involve pieces from SpaceX Dragon’s carbon fiber trunk, which stays attached to the crewed capsule until just hours before its reentry. These trunks are larger than a 15-passenger van and used for storage.

Trunk debris from the Crew 7 mission to the International Space Station has landed in North Carolina, and fragments from the Crew 1 mission landed in New South Wales, Australia. Similarly, debris from the Axiom 3 mission landed in Saskatchewan, Canada.

A large piece of space debris from a SpaceX Dragon capsule was found by a campsite groundskeeper in North Carolina in 2025.

In addition to trunk debris, carbon fiber components that hold pressurized gases to adjust a spacecraft’s orientation also make up a lot of recovered reentry debris. Some of these most recent recoveries have been in Australia, Argentina and Poland.

Most of the debris that reenters the atmosphere burns up, so why are these pieces making it down to Earth’s surface?

Atmospheric reentry

Satellites such as SpaceX’s Starlink reside in low Earth orbit, typically between 190 and 1,240 miles (300 and 2000 kilometers) above the Earth’s surface. To stay there, they need to move really fast, at about 17,000 miles (27,000 km) per hour. To reach this speed, a rocket with a million pounds of fuel had to accelerate it, and part of this energy is still contained within the satellite’s momentum.

As an object in orbit drifts down, closer to Earth’s upper atmosphere, it starts to collide with air molecules, slowing the object down. The amount of heat generated from this interaction rapidly consumes the satellite, melting metal at over 3,000 degrees Fahrenheit (1,600 degrees Celsius).

More launches

Countries around the world have been launching items into space since the 1950s, so why is reentry a concern now?

Starting in the 1960s, about 100 objects were launched into space every year – or at least that was the case until 2016. Since then, the number has been increasing exponentially. In 2016, 200 objects launched. But in 2025, that number was 4,500, meaning 20% of all objects launched into space since the 1950s were launched last year.

Most of these launches came from companies in the United States, such as SpaceX and Rocket Labs. Companies like these, along with those outside of the U.S., have plans for large satellite constellations composed of hundreds of thousands to a million satellites.

The more objects and payloads launched, the more reentry events occur. Satellite operators are required to remove their decommissioned satellites from orbit after 25 years to comply with regulations set in place by international committees. Groups across the world, including the Federal Communications Commission in the U.S., have pushed to shorten the deorbit window to five years. Because of these guidelines, the full influx of reentry debris events from these recent launches will not be felt for another 10 or more years.

The objects launched and policy decisions made today will have a lasting effect on future safety.

Carbon fiber

As the world has progressed technologically, efficiency for launching items into space has too.

Satellites and spacecraft are becoming lighter, stronger and more heat resistant because of materials such as carbon fiber-reinforced plastics and new metals. These strong materials are sought after because they’re lightweight, but they can also cause deorbiting debris to withstand reentry temperatures.

Carbon fiber, once used exclusively in space technology, is now found in common items such as bicycle frames and racing car bodies. It is still the gold standard for fabricating high-strength, low-weight materials for spacecraft components such as rocket fuselages, interstaging – the protective housing found between the rocket stages – and pressure vessels that experience extreme temperatures and high mechanical stress and strain.

Simple metals such as aluminum and steel melt and burn away, while complex materials such as carbon fiber, which is manufactured at up to 5,000 F (3,000 C), burn away unpredictably, changing the way jettisoned components break up upon reentry.

Since the early 2000s, a majority of recovered space debris contains either carbon fiber-reinforced plastic sections or metal components wrapped with carbon fiber. The carbon fiber can act as an unintentional heat shield for heavier, more harmful debris.

A map showing the world with dots spread across the U.S., South America, the coasts of southern Africa, Australia and Southeast Asia.
This map shows locations where confirmed space debris has been recovered. With the increase in launches, the European Space Agency predicts that future space debris could fall practically anywhere across the world. European Space Agency

Design For demise

Design for demise is a major area of research focused on mitigating the risk of reentry debris. Instead of relying on controlled and meticulously timed deorbits that send components that survive reentry into the ocean at the end of their lives, spacecraft components are engineered to ensure they completely disintegrate while deorbiting through the atmosphere.

Design for demise can take many forms. These range from changing to more heat-susceptible materials to relocating harder-to-burn components to areas of the spacecraft that will be hotter during reentry, or using linkages that break apart at high temperatures to separate structures into smaller components to help them burn up.

With so much focus historically on spacecraft being made from the lightest, strongest and most heat-resistant materials available, it may seem counterintuitive to intentionally make some materials weaker. The key is making materials smarter, so they maintain their strength during their mission but weaken under the heat of reentry.

The Conversation

Matthew Ray's lab is developing and working toward patenting a system to decrease risk from future carbon fiber based reentry debris.

Reese Hufnagel conducts research on space debris and is developing ways to make future carbon composites safer for use in orbit.

We analyzed paper money printed by Ben Franklin to uncover his anti‑counterfeiting techniques and materials innovations

Ben Franklin played a key role in America's founding, which included helping to design its paper currency. Kristina Davis

Benjamin Franklin understood something fundamental about money that still shapes modern economies: Money only works when people believe it is real.

In the early 18th century, the British colonies suffered from a chronic shortage of gold and silver coins, forcing local governments to rely on paper bills for trade and everyday commerce. But paper currency created a dangerous new problem: Unlike metallic coins, paper money could be easily copied, altered and faked.

Long before his experiments with electricity or his role in the American founding now 250 years ago, Franklin spent years working with paper, ink and printing. In the process, he developed a practical understanding of materials and manufacturing.

Nearly three centuries later, modern scientific analysis reveals how sophisticated some of his anti-counterfeiting strategies were. My colleagues and I in materials science recently analyzed hundreds of surviving colonial American bills, including notes printed by Franklin.

Using modern imaging and scientific methods, we examined fibers, pigments and microscopic structures hidden in the paper. The results suggested that Franklin approached currency as a practical materials problem.

Printing money that people could trust

Although paper money originated in China more than a thousand years ago, it did not appear in Europe until the 17th century. By the early 18th century, the American colonies lacked enough gold and silver coins to support a growing economy. To keep commerce moving, many colonies began issuing paper money instead. But paper currency also created anxiety because the colonial bills were relatively easy to fake.

A piece of paper reading 'three pence' and 'printed by B. Franklin and D. Hall'
A three-pence note of paper currency issued by the Province of Pennsylvania and printed by Benjamin Franklin and David Hall in 1764. Godot13/Wikimedia Commons

Forged notes circulated widely. Printers even put variations of the phrase “To Counterfeit Is Death” on colonial money and detailed harsh punishments for counterfeiters in their newspapers.

Franklin became involved in money printing in the early 1730s, soon after establishing himself as a printer in Philadelphia. During his career, Franklin printed millions of pounds worth of paper money for Pennsylvania and several other colonies. In 1749, he brought in the printer David Hall as a business partner. Hall carried on the practice with William Sellers after Franklin left the practice in the mid-1760s.

Franklin also created a network of printers in other colonies, supplying them with printing presses, paper and ink. This network printed paper notes for the Delaware, New Jersey, New York, Maryland and South Carolina colonies. Printing money required greater precision than printing newspapers or pamphlets. Franklin understood that a bill’s physical characteristics and the materials used to prepare it could shape whether people trusted it.

A printer who experimented with materials

Franklin approached printing as a craftsman, constantly experimenting with new printing techniques and materials.

Colonial papermakers produced paper sheets by pulping old linen and cotton rags in water, lifting the suspended fibers onto screens, and compressing the wet pulp by hand.

Under magnification, this old paper resembles a dense network of tangled fibers. Franklin explored ways to make his bills harder to copy by embedding additives into the paper. Some notes included indigo-colored fibers or threads mixed into the pulp.

Those innovations forced counterfeiters to reverse-engineer the paper, not just the printed image. Franklin also experimented with imitating designs from natural objects. For example, by pressing leaves into soft material, he captured complex vein patterns with high precision.

He later printed those patterns on colonial bills, producing designs that were difficult to copy because no two leaves share the same structure.

Franklin had written a famous pamphlet to advocate for paper money, though it did not record his exact techniques. Alongside his main account book, he kept a separate ledger – never found – to record dealings with the papermaker Anthony Newhouse in 1742 and 1743. In the mid to late 1740s, he purchased “money paper” from Newhouse.

Historians have speculated that Franklin was developing this new money paper with Newhouse and separated the accounts to keep its security features confidential.

Ben Franklin was an active figure in the printing world.

What modern analysis reveals

When my colleagues and I began investigating nearly 600 colonial bills, we wanted to understand the materials they contained. We employed imaging methods capable of examining structures thousands of times thinner than human hair. Those techniques allowed us to reveal the chemical makeup of the inks, fiber colorants and mineral particles used.

Some findings surprised us. Franklin’s black ink differed from many conventional printing inks of the period, which often used soot-based black pigment produced by burning vegetable oils or charring animal bone.

Instead, in many of Franklin’s bills, we found layered carbon structures similar to graphite, the naturally occurring form of carbon used in modern pencils. Unlike soot-based pigments, graphite consists of stacked layers of carbon atoms that give it distinctive physical and optical properties. These results suggested that Franklin experimented with ink composition more extensively than historians previously thought.

We also identified mica particles embedded in the paper. These particles reflect light, producing a faint shimmer. Whether added intentionally or introduced during papermaking, they created another visual feature that would have been difficult for counterfeiters to reproduce consistently.

Under advanced microscopes, the fibers revealed differences in manufacturing techniques, paper quality and material preparation. What appeared to be a simple colonial bill became a complex engineered object under the microscope.

Today, many banknotes contain similar particles, specialized threads and layered optical features designed to deter counterfeiters. Franklin’s materials were simpler than modern security technologies, but they relied on similar principles.

The material science of trust

Franklin never described himself as a materials scientist. Yet his work on colonial money reflected many of the ideas that guide secure printing today. He understood that an object’s physical properties could help build trust. The bill’s texture, fibers, pigments and printed details all helped convey authenticity.

That insight proved important far beyond the printing shop. Paper money provided a practical way to support trade, public projects and economic growth in the face of coin shortages. But paper currency could only serve those purposes if people trusted it. By making bills more difficult to counterfeit and easier to recognize as genuine, Franklin helped strengthen confidence in a financial system that supported a rapidly growing colonial economy.

Modern analysis now reveals details that earlier generations could not see: Franklin’s paper money was more than a financial instrument. It embodied a principal effort to engineer trust directly into everyday materials, an idea that still informs the design of modern money.

It is perhaps fitting that Franklin’s portrait appears on today’s US$100 bill. Long before becoming one of the faces of American money, he helped develop some of the ideas that made paper money trustworthy in the first place.

The Conversation

Khachatur Manukyan does not work for, consult, own shares in or receive funding from any company or organization that would benefit from this article, and has disclosed no relevant affiliations beyond their academic appointment.

Solar activity follows an 11-year cycle – here’s how it controls eruptions and solar flares

The Sun's surface is dynamic, affected by convection in its interior. NASA/Solar Dynamics Observatory

When you look up at the sky on a sunny day, the Sun might seem like a bright spot, unchanging in the sky. But the Sun is a complex, dynamic celestial body, wrapped in electrical currents and magnetic fields that constantly move and tangle as it rotates. At times the Sun’s surface is very active, casting out powerful bursts of plasma called coronal mass ejections, while at other times it is calmer.

I’m a solar physicist who has spent over a decade researching the Sun. Its movement and activity is directly linked to conditions on Earth: Solar flares and ejections can cause space weather that produces beautiful Northern lights but threatens satellites. This activity follows a roughly 11-year-long cycle, and learning about this cycle helps researchers predict future space weather.

Inside the Sun

The Sun is a star composed of plasma: a hot, ionized gas. The plasma acts as an electrically conductive fluid, and generates large-scale magnetic fields that encircle the Sun.

The Sun is composed of several layers, all made up of a plasma that’s about 70% hydrogen and 28% helium by mass.

The Sun has a solid core at its center and a dense layer outside the core, where particles of light bounce around, transferring energy outwards. Beyond that layer is a thin line called the tachocline that separates those inner layers from the outer layer. This outer zone is cooler and less dense, allowing plasma to move around.

A diagram showing all the different regions and layers of the Sun
The Sun’s interior is made up of several layers. Kelvinsong/Wikimedia Commons, CC BY-SA

Inside the core, particles collide and release incredible amounts of energy, which radiate out from the Sun in the form of light – a process called nuclear fusion. The light travels outward towards the radiative zone outside the core, before reaching the tachocline.

At the outer layer of the Sun above the tachocline, called the convective zone, the hot plasma travels from deep in the Sun to its surface. As it moves, the plasma cools and contracts, causing it to sink back down. This cyclic process is called convection.

Explaining sunspots, solar cycle and solar dynamo.

The Sun is constantly generating magnetic fields that grow and twist below its surface. Two processes control these magnetic fields by moving the electric charges around in the plasma. One is convection, and the other is the Sun’s rotation.

Scientists think that together, these two processes are ultimately responsible for the Sun’s magnetic activity cycle, during which the Sun shifts from an organized to a less organized magnetic field arrangement. The entire cycle, called the Schwabe Cycle, takes roughly 11 years. Over the course of two Schwabe cycles, the Sun’s magnetic poles flip, and then return to their original orientation.

The Schwabe cycle

When the Sun is in an organized state, the center of the Sun resembles a giant vertical bar magnet with positive and negative ends at the top and bottom, or vice versa – called a magnetic dipole. In the 11-year solar cycle, this phase is known as solar minimum.

A diagram showing the Sun with the top pole labeled '+' and bottom pole labeled '-'. Magnetic field lines come from each pole and curve down vertically to reach the other pole.
During the solar minimum, the Sun’s magnetic field is a simple dipole, with a positive pole and a negative pole on either end. Throughout the solar cycle, the magnetic fields go from simple lines to tangled chaos. NSF/AURA/NSO

Although you cannot see the invisible magnetic field directly, the glowing plasma sticks to these field lines. The magnetic field’s shape during the solar minimum is similar to Earth’s magnetic field, with open-ended magnetic field lines at the north and south poles and closed, looped fields near the equator. After the solar minimum state, the Sun’s magnetic field grows tangled over time. Eventually, it reaches its solar maximum state, where the solar atmosphere resembles tangled up spaghetti.

Two main forces tangle the magnetic field as the Sun rotates and plasma churns away in the convection zone: the Omega and Alpha effects.

Alpha and Omega effects

The Sun doesn’t rotate as a solid body everywhere. The interior of the Sun – the core and radiative layers – spins as a solid sphere, like a basketball. Outside these layers, the convection zone and the surface of the Sun do not spin all together.

By observing the Sun’s visible surface, scientists found out that the solar equator in the center rotates faster than the poles, near the top and bottom of the Sun. It takes the solar equator about 25 days to make a full rotation, while the poles take longer – about 35 days. Because the equator moves faster, it overtakes the poles in a phenomenon called differential rotation.

Differential rotation stretches the vertical magnetic field lines around the Sun, causing them to wrap around the Sun horizontally like a belt. The field lines pull on the Sun more tightly as differential rotation continues throughout the solar cycle, in a process known as the Omega Effect.

A diagram showing the magnetic field lines wrapping around the Sun and doubling back.
Differential rotation – where the poles of the Sun rotate more slowly than the center – leads the solar magnetic field lines to stretch as they wrap around the Sun. CoronalMassAffection/Wikimedia Commons, CC BY

The second effect, called the Alpha Effect, is thought to arise from convection taking place below the Sun’s surface coupled with its rotation. Like bubbles rising to the surface in boiling water, the tangled magnetic field becomes buoyant and kinked, popping through the surface to create sunspots.

Sunspots look like clusters of dark spots on the Sun’s surface. Scientists can also identify active regions of intensely strong and complex magnetic field bundles by taking images of the Sun in ultraviolet light, where the bundles appear as bright structures.

Solar eruptions called solar flares and coronal mass ejections occur most frequently in these active regions. The appearance of more sunspots, active regions and solar eruptions all signal to scientists that the Sun is entering its solar maximum phase.

Moving magnetic poles

Over the course of the solar cycle, the Sun’s magnetic poles move. At solar minimum, the magnetic poles are oriented vertically through the Sun’s center. But over the course of the solar cycle, the poles begin to tilt, until the pole previously at the top of the Sun is pointed roughly at its equator.

The Sun flipping its magnetic field.

But at the same time, all the tangled magnetic fields make the poles less defined. This chaotic magnetic state partially leads to sunspots and solar eruptions. After solar maximum, as the Sun’s magnetic state grows more organized again, the poles reappear and continue migrating back towards the top and bottom of the Sun.

However, the magnetic pole previously pointed at the top now points to the bottom, and vice versa. The configuration appears upside down from what it was 11 years ago. A full magnetic cycle takes two Schwabe Cycles – during this time, the Sun’s poles flip twice and return back to the original orientation.

Scientists have observed that several other stars, not just our Sun, have a magnetic activity cycle, though their duration can vary. And, like our Sun, other stars also produce eruptions like stellar flares and coronal mass ejections, likely due to their activity cycles.

Studying magnetic cycles in other stars can help astronomers determine whether distant planets could support life. A star’s magnetic activity directly dictates the amount of space weather the planets around that star experience. These effects can strip away the protective atmospheres around planets, prohibiting them from supporting life.

The Conversation

Yeimy J. Rivera does not work for, consult, own shares in or receive funding from any company or organization that would benefit from this article, and has disclosed no relevant affiliations beyond their academic appointment.

As corporations race for the stars, we need international collaboration on space governance

A satellite burns up as it travels through Earth's atmosphere. Several of these large satellite re-entries now occur every day. (European Space Agency/David Ducross), CC BY-SA

The science academies of G7 member countries have identified international space governance as a pressing issue for the G7 Leaders’ Summit, to be held from June 15-17 in Evian, France.

The explosive growth of large satellite constellations over the last decade offers great promise for near-universal access to broadband internet. But this growth comes with risks that are not yet fully understood.

These include contamination of the night sky, disruption of astronomy research, increasing risk of satellite collisions and hazards from large numbers of satellites falling back to Earth.


Read more: A million new SpaceX satellites will destroy the night sky — for everyone on Earth


Our understanding of the human impact on the near-Earth space environment is at a similar stage to our understanding of climate change back in the 1990s. We know that increased human activity is causing large disruptions to the space environment, but whether a tipping point is soon to be reached is not yet clear.

In this context, one of the most significant recommendations for G7 member states is to establish an intergovernmental panel on space sustainability (IPSS).

Impacts on atmospheric chemistry

Research and understanding of human impacts in space is still at a very early stage. For example, we don’t really know when some orbital altitudes will become so overpopulated with space debris that they reach operational capacity.

Scientists have also recently recognized that the increased global rocket-launch rate — with more than one rocket now being launched every day — may lead to a reversal in the recovery of the ozone layer.

Similarly, we are aware that satellites burning up as they fall back to the Earth’s atmosphere will have significant effects on the chemistry in the upper atmosphere. We know there are now several of these large satellite re-entries occurring every day, but the full effects of this are not clear.

Messy space governance

Several scientific bodies now advise on policy in different areas of space sustainability. One is the Inter-Agency Space Debris Coordination Committee, which focuses on space debris degradation of the environment.

Another is the International Astronomical Union Centre for the Protection of the Dark and Quiet Sky, which co-ordinates efforts to reduce the impact of satellites on optical and radio astronomy.

A dark night sky filled with stars and the pink and blue coloured and butterfly-shaped 'Butterfly Nebula.'
An image of NGC 6302, known as the ‘Butterfly Nebula,’ taken using the Hubble Space Telescope. The telescope is increasingly impacted by satellite constellations in low-Earth orbit. (NASA)

But no single body exists to provide comprehensive policy input to governments for policy and regulatory decisions. The situation is similar to that in climate change research, when the early Advisory Group on Greenhouse Gases (AGGG), formed in the 1980s, transitioned to the Intergovernmental Panel on Climate Change (IPCC).

We urgently need an intergovernmental panel on space sustainability (IPSS).

Ten years ago, the number of active satellites in low-Earth orbit numbered almost 2,000; today, it’s close to 20,000. In recent years, governments and corporations have announced plans for up to a million more.

Defining global thresholds

How could this IPSS be structured, to approach space governance in a similar way to how the IPCC approached the climate change problem?

A primary goal should be to define global thresholds for sustainability. Much like the 1.5 C limit in climate science, the panel should identify thresholds beyond which specific orbital altitudes have reached carrying capacity.

Like the IPCC, an IPSS should include several working groups to provide transparent and accessible summaries of scientific results for policy makers.

One should focus on the physical science of the orbital environment. This means the state of low-Earth orbit as a finite resource — including estimates of space debris and collision growth, effects of space weather and models of sustainable future launch traffic.

A satellite, breaking into fragments, with the Earth behind.
A satellite breaks up in orbit. (ESA/ID&Sense/ONiRiXEL), CC BY-SA

Another working group should centre on the environmental and societal impacts of large satellite constellations. This would assess stratospheric ozone depletion caused by rocket launch emissions, the effects of higher satellite re-entry rates, changes to atmospheric chemistry and increased casualty risks. It would also quantify their impact on ground-based astronomy.

Finally a working group on mitigation and policy could set the stage for clear international standards for post-mission satellite disposal, active debris removal and new licensing requirements that account for a constellation’s “system-wide” rather than “per-satellite” risk.

Space traffic footprints

A useful addition to the IPSS would be a Task Force on Space Traffic Footprints. Modelled after the IPCC’s Task Force on National Greenhouse Gas Inventories, this body would develop standardized methodologies for states to report their “space traffic footprint” — the burden their space objects pose to the safety and sustainability of the low-Earth orbit environment.

Similar to the IPCC’s role in vetting climate models, the IPSS needs to provide independent assessment of claims regarding satellite demisability — the way satellites are safely decommissioned and de-orbited. This should evaluate how successful de-orbiting technologies are and how well we can track satellites and estimate their location uncertainties.

By creating a co-ordinated international approach now, the IPSS will help balance the enormous promise of commercial activity in space with the environmental risks — just as the IPCC has done with Earth’s changing climate from human activities.

The Conversation

Peter Brown receives funding from the Natural Sciences and Engineering Research Council of Canada, the United Sstates National Aeronautics and Space Administration, the European Space Agency, Natural Resources Canada and Defence Research and Development Canada

Upcoming telescopes could shed light on dark matter – astronomers are looking for these ‘fingerprints’ of the elusive substance

Dark matter makes up a large proportion of galaxies like the Milky Way, but scientists are still figuring out what it is. RubinObs/NOIRLab/SLAC/NSF/DOE/AURA/B. Quint, CC BY

NASA’s plans to return astronauts to the Moon through the Artemis program and ultimately send humans to Mars highlight just how far space exploration has come. Yet while the Moon and Mars remain compelling destinations filled with scientific mysteries, looking beyond our solar system raises even deeper questions about the universe itself.

Among the biggest of those mysteries is matter – the substance that makes up everything around us. Surprisingly, most of the matter in the universe is invisible, and astronomers still do not know what it is.

Physicists estimate that about 85% of all matter is made of something we cannot see, touch or directly detect. This elusive substance is known as dark matter. It doesn’t emit light like stars or galaxies. The only reason scientists know it exists is because of its gravity.

Galaxies rotate too fast to be held together by just the matter that can be seen. Light bends more strongly than expected as it travels through space. Galaxies within clusters fly past one another much faster than they should based on their visible mass alone.

Based on data from across the cosmos, scientists keep coming to the same conclusion: There is something out there that cannot be seen, but whose presence is unmistakable. It’s a question that has intrigued astronomers like us for more than 50 years.

So what is dark matter, and why does it matter?

A missing piece of the cosmic puzzle

Everything in our everyday world is made of atoms, which are combinations of protons, neutrons and electrons. These particles form stars, planets, people and everything you see.

Dark matter, scientists believe, is fundamentally different. It is likely made of entirely new kinds of particles yet to be discovered. Understanding what those particles are would fill a major gap in the scientific understanding of physics. But the importance of dark matter goes far beyond particle physics.

Dark matter played a crucial role in shaping the universe. Shortly after the Big Bang that kicked off the birth of the universe, it acted as a kind of gravitational scaffolding, helping ordinary matter clump together to form the first galaxies and stars. Even today, it acts as the invisible glue that holds galaxies together.

In other words, without dark matter, the universe as you know it might not exist.

Looking for invisible matter

Because dark matter does not emit light, scientists must search for it indirectly. One promising approach is to look for the signals it might produce when its particles collide and destroy each other through a process known as annihilation.

This idea may sound exotic, but it has a familiar analogy. In medical imaging, devices such as positron emission tomography scanners, or PET scanners for short, detect radiation produced when particles of antimatter – positrons – annihilate with electrons, which are normal matter.

Antimatter is just a form of matter made of particles that have the same mass as ordinary matter, but opposite charges and quantum properties. The annihilation signals in PET scanners allow doctors to map cancerous tissues inside the human body.

Scientists hope something similar could happen with dark matter. If dark matter particles annihilate with each other, they may produce high-energy radiation called gamma rays. These gamma rays could act as fingerprints, revealing where dark matter is concentrated and its properties.

As astrophysicists who study gamma rays, we and our collaborators use space-based telescopes to search for these signals.

A diagram showing a web of energy
Visualization from the Aquarius Project, a high-resolution cosmological dark matter simulation. The image shows the dark matter structure on both large cosmological scales, left panel, and on the scale of the Milky Way. Volker Springel/Virgo Consortium, The Aquarius Project

A mysterious signal at the heart of our galaxy

One of the most powerful tools for this search is NASA’s Fermi Large Area Telescope, known as Fermi-LAT, which has been observing the gamma-ray sky since 2008. Gamma rays are the most energetic form of light, and they are produced by some of the universe’s most extreme phenomena.

For years, Fermi has detected an unexplained glow of gamma rays coming from the center of the Milky Way. Based on gravitational observations such as galaxy rotation curves, stellar motions, and the bending of light, combined with cosmological simulations, astrophysicists expect this region to be extremely rich in dark matter, making it an intriguing place to look for annihilation signals.

Could this glow be evidence of dark matter?

Possibly. But there’s a complication: The center of our galaxy is also crowded with more conventional astrophysical gamma ray sources, such as rapidly spinning neutron stars, which are produced from the collapse of massive stars. These objects can produce gamma rays that mimic the expected signal from dark matter.

At the moment, scientists cannot say for certain what is causing the emission. The signal could be a breakthrough, or it could be something more ordinary.

Clues from smaller galaxies

To help resolve this mystery, researchers also study much smaller systems, known as dwarf galaxies, which orbit the Milky Way. These galaxies contain dark matter but relatively few other sources of gamma rays, making them cleaner environments to search for dark matter-related signals.

So far, no definitive detection has been made.

However, an analysis published in March 2024 led by our team at Clemson University found hints of a signal emerging from these dwarf galaxies, and updated results collected since have supported these findings.

Using the latest Fermi-LAT data, combined with an updated census of dwarf galaxies and improved estimates of their dark matter content, we searched for faint gamma-ray signals across the population of dwarf galaxies. This led us to uncover an excess of gamma rays that earlier studies had also hinted at. The more data we’ve collected, the more significant the excess appears to become.

The evidence is not yet strong enough to claim a detection of dark matter, but it is intriguing. The properties of this signal are also consistent with what scientists see in the center of the Milky Way. If both signals share the same origin, the case for dark matter would grow stronger.

An illustration of the Fermi telescope in orbit over Earth. It looks like a metal box with two solar panels protruding off either side.
The Fermi spacecraft surveys the sky searching indirectly for dark matter. NASA's Goddard Space Flight Center/Chris Smith (USRA/GESTAR)

The next decade could be decisive

Confirming a dark matter signal will require more data and better instruments working together.

Future observations from the Fermi-LAT will continue to improve the sensitivity of these searches. Additionally, new facilities such as the Vera C. Rubin Observatory in Chile, are expected to discover more dwarf galaxies for researchers to study.

Another key mission is NASA’s Compton Spectrometer and Imager, or COSI, scheduled for launch in 2027. COSI will offer a new view of the gamma-ray sky and could help clear up several longstanding mysteries. Among these mysteries is yet another unexplained bright glow from the center of the galaxy, produced when electrons and positrons annihilate, just as in PET scans.

An illustration of a telescope which is cylindrical with a solar panel off on its side.
The COSI telescope will study antimatter in the galaxy. COSI artist's concept, above — Northrop Grumman Systems Corporation

Despite discovering the annihilation signal more than 50 years ago, scientists still don’t know where these positrons are coming from. By mapping this emission in unprecedented detail, COSI could help reveal what’s producing the glow, and whether it might be connected to dark matter and other unexplained signals in the Milky Way.

These efforts, along with many other ongoing searches, may help determine whether scientists are truly seeing the fingerprints of dark matter or something else entirely.

As humans push further into space, from the Moon to Mars and beyond, new worlds wait to be discovered. In parallel with the new age of space exploration, with each new observation, scientists may be getting closer to answering one of the most fundamental questions in physics.

The Conversation

Marco Ajello receives funding from NASA.

Christopher Karwin receives funding from NASA.

Ocean monitoring is in trouble: without the US, it’s up to Europe and Asia to avoid losing sight of the world’s deep-sea ecosystems

The world relies on a modest number of countries to keep watch over the ocean. That arrangement is starting to fail. Europe and Asia must now decide whether to let the system unravel, or to take it up together.

Right now, in every ocean basin on Earth, a global network of instruments measures the state of the sea.

Research ships steam along oceanographic transects from surface to seafloor. Anchored buoys watch the tropical oceans for the first signs of El Niño or tropical cyclones and take the pulse of the thermohaline circulation. Some four thousand autonomous floats sink every ten days to two thousand metres before rising to transmit temperature and salinity to ground stations via satellite. Underwater gliders patrol continental margins, and drifting buoys ride the surface in the most remote waters. Hundreds of elephant seals carry miniaturised sensors beneath the polar sea ice…

Together, this network produces invaluable information that allows societies to anticipate and respond to a changing ocean and weather conditions, and protect the ocean in return.

It is also far more fragile than most people, and most governments realise. A new study published in Nature Climate Change has measured for the first time just how fragile the ocean watch network is.

The result is alarming. If observations from a single major contributor, the United States, were withdrawn from the Global Ocean Observing System (GOOS), the errors in our estimate of how fast the ocean is warming would jump by 163 percent. That is worse than randomly losing 80 percent of all global ocean data. The reason is geographical: US instruments cover every ocean basin and plug critical gaps that no other nation currently fills.

This is not a theoretical concern. Proposed cuts to National Oceanic and Atmospheric Administration (NOAA) and the National Science Foundation in the United States now threaten exactly this contribution. And the situation is barely better on the other side of the Atlantic.

The pressures are not confined to one side of the Atlantic, nor to the West. In China, scientists and policymakers are working to build a more resilient national contribution to ocean observation, but without the resources the moment requires. The marine monitoring system the world relies on is under strain almost everywhere.

An observing system, not a programme

Public conversations about ocean observations often focus on Argo floats.

Designed to monitor ocean conditions, Argo floats are part of an international program that collects data on salinity, temperature and currents using a fleet of robotic instruments that drift and move up and down between the surface and mid-water level. D. Luquet IMEV, Fourni par l'auteur

Each Argo is essentially a sealed cylinder of pressurised electronics with a clever buoyancy chamber: it floods with seawater to sink and is evacuated to rise again. These autonomous robots have transformed ocean science this century.

However, Argo is just one component of GOOS and the complementarity of its parts matters.

  • Argo profiles the upper two kilometres of the open ocean.

  • Research vessels go deeper: GO-SHIP cruises survey from surface to seafloor along long repeated transects, providing the high-precision reference measurements that calibrate every other instrument and help validate climate models.

  • Moored buoys deliver continuous time series critical for monitoring El Niño, the Atlantic Meridional Overturning Circulation, and the conditions in which tropical cyclones form.

  • Underwater gliders target coastal currents, eddies and continental margins that floats cannot resolve.

  • Elephant seals carry sensors into under-ice regions of the polar oceans that no other instrument can reach.

Each platform answers questions the others cannot.

Remove any one of these ocean watch components, and the observing system’s ability to deliver reliable information degrades not in proportion to the volume of data lost, but in proportion to where the gaps appear.

What this network actually delivers

The Global Ocean Observing System is too often described as “climate monitoring,” but it does so much more.

Every operational weather forecast is built on these data. The numerical weather prediction systems run by the European Centre for Medium-Range Weather Forecasts, by Météo France, and by every other major weather service ingest ocean observations many times a day.

Without them, forecasts drift quickly out of skill.

The new artificial-intelligence-based forecast systems Pangu-Weather and GraphCast, despite their impressive performance, rely entirely on the same observational stream.

AI does not replace observations; it depends on them.

Sub-seasonal to seasonal forecasting, to help anticipate harvest seasons, energy demand and water availability weeks to months ahead, depends critically on knowledge about subsurface ocean heat and salinity.

Tropical cyclone track and intensity forecasts, central to early warning and evacuation decisions, depend on ocean heat content beneath the surface, not just sea surface temperature, because hurricanes draw their explosive energy from the warm layers down to at least 200m depth.

Marine heatwave warnings, now used routinely by fisheries managers worldwide, are impossible without sustained subsurface observation.

Sea-level projections used to design coastal infrastructure require decades of consistent measurements, and salinity adds the density information essential for determining all ocean currents, including the AMOC.

In short, GOOS underpins operational services from tomorrow’s storm warnings to next century’s adaptation plan. It is not a luxury but essential.

Why models and artificial intelligence alone cannot save us

There is a persistent misconception, amplified by the rise of AI, that sufficiently advanced models can substitute for direct observations. They cannot.

Every forecast model, whether traditional or AI- based, relies on data assimilation: a continuous nudged adjustment of the simulation toward real-world measurements. An AI model trained on a richly observed past will perform poorly in a sparsely observed present. In a world of rising extremes and shifting ocean states, historical patterns become less reliable.

An observation not made is lost forever. Satellite measurements of the sea surface cannot tell us what is happening hundreds or thousands of metres below, where heat accumulates, currents reorganise, and the precursors of the next season’s weather are already forming. To see beneath the surface, we need instruments in the water.

The cheapest insurance we have

The argument that ocean observation is too expensive collapses on contact with the numbers.

The total annual cost of the global system, across all platforms and personnel, runs on the order of one billion euros worldwide. The European share is a fraction of that.

Extreme weather events linked to ocean conditions caused tens of billions of euros in damage across Europe in 2024 alone.

A single major North Atlantic hurricane season can cost the United States hundreds of billions of dollars. Marine heatwaves have collapsed fisheries worth billions and triggered mass coral bleaching on every reef system on Earth. Failed seasonal forecasts cascade through agriculture, energy and humanitarian response, with consequences rarely tallied.

Every euro spent on ocean observation returns many times its value. It is one of the highest-return public investments available.

Europe’s choice

Europe needs to treat ocean observations as critical infrastructure, equivalent to satellite navigation or meteorological services. That means stable, multi-year funding for the operational backbone of the system: the floats, ships, moorings, gliders and data centres that process and deliver the data.

France has the second-largest Exclusive Economic Zone in the world but contributes around 5 percent of global ocean temperature profile data. Present in the Atlantic, Pacific and Indian Oceans, France has five departments and regions and seven overseas collectivities, which are home to 2.7 million French citizens.

Australia contributes more than three times as much.

The European Union contributes about 12 percent, less than a quarter of the American share. Europe, and France in particular, should substantially increase its contribution.

OceanObs’29, the decadal international conference set to be held this time in China, is an opportunity to negotiate a more balanced global system, reflecting economic capacity and maritime interests rather than historical accident.

Europe-China scientific cooperation should increase, as they have largely complementary observing footprints. Together, they would cover much of the global ocean.

The narrowing window

The danger is a gradual erosion of the information on which a growing share of human activity and the blue economy now depends.

Cyclone warnings become less reliable, seasonal forecasts less skilful, sea-level projections less precise. Each loss maybe individually tolerable. Together, they amount to flying blind into the most consequential transformation of the planet’s climate in human history.

The ocean observing system is a planetary public service, built over decades by many nations. France and Europe possess the institutions, expertise and the maritime interest to play a far larger role.

What is missing is the political decision to act, while the system can still be sustained. The loss of collaboration among nations would force a rebuild far more difficult and expensive than sustained investment in what already works.

The window remains open but is narrower than it was.


A weekly e-mail in English featuring expertise from scholars and researchers. It provides an introduction to the diversity of research coming out of the continent and considers some of the key issues facing European countries. Get the newsletter!


The Conversation

Sabrina Speich a reçu des financements de l'ERC, EU Horizon 2030, CNES TOSCA et ANR. Sabrina Speich est présidente du comité d'experts du "Ocean Observations for Physics and Climate" des programmes UN GOOS et GCOS.

John Abraham, Kevin Trenberth et Lijing Cheng, ne travaillent pas, ne conseillent pas, ne possèdent pas de parts, ne reçoivent pas de fonds d'une organisation qui pourrait tirer profit de cet article, et n'ont déclaré aucune autre affiliation que leur poste universitaire.

Falling space debris poses an escalating risk as spacecraft get stronger and more heat resistant

Not all space debris burns up in the atmosphere before it makes it back to Earth. PaulFleet/iStock via Getty Images

When it comes to space debris, what goes up is coming down more often – and not safely.

When spacecraft launch, some components, including nonreusable rocket boosters, are jettisoned to decrease weight, leaving them to intentionally burn up as they reenter the atmosphere. Satellites also enter the atmosphere at the end of their life, supposedly burning up. But in many cases, they are not doing so as predicted.

Debris from partially burned-up spacecraft components and satellites reentering Earth’s atmosphere can pose a risk to people and structures on the ground. The surge in launches, driven largely by private players such as SpaceX, is turning a once-remote risk into a growing threat.

Our materials research group at the University of Wisconsin-Stout is studying the materials that allow reentry debris to survive. We look for ways to safely modify their exceptional heat-resistant qualities to make them safer for atmospheric reentry.

Debris landing on Earth

Reentry debris has fallen on both private and public property around the world multiple times since 2021. Some of the most notable events involve pieces from SpaceX Dragon’s carbon fiber trunk, which stays attached to the crewed capsule until just hours before its reentry. These trunks are larger than a 15-passenger van and used for storage.

Trunk debris from the Crew 7 mission to the International Space Station has landed in North Carolina, and fragments from the Crew 1 mission landed in New South Wales, Australia. Similarly, debris from the Axiom 3 mission landed in Saskatchewan, Canada.

A large piece of space debris from a SpaceX Dragon capsule was found by a campsite groundskeeper in North Carolina in 2025.

In addition to trunk debris, carbon fiber components that hold pressurized gases to adjust a spacecraft’s orientation also make up a lot of recovered reentry debris. Some of these most recent recoveries have been in Australia, Argentina and Poland.

Most of the debris that reenters the atmosphere burns up, so why are these pieces making it down to Earth’s surface?

Atmospheric reentry

Satellites such as SpaceX’s Starlink reside in low Earth orbit, typically between 190 and 1,240 miles (300 and 2000 kilometers) above the Earth’s surface. To stay there, they need to move really fast, at about 17,000 miles (27,000 km) per hour. To reach this speed, a rocket with a million pounds of fuel had to accelerate it, and part of this energy is still contained within the satellite’s momentum.

As an object in orbit drifts down, closer to Earth’s upper atmosphere, it starts to collide with air molecules, slowing the object down. The amount of heat generated from this interaction rapidly consumes the satellite, melting metal at over 3,000 degrees Fahrenheit (1,600 degrees Celsius).

More launches

Countries around the world have been launching items into space since the 1950s, so why is reentry a concern now?

Starting in the 1960s, about 100 objects were launched into space every year – or at least that was the case until 2016. Since then, the number has been increasing exponentially. In 2016, 200 objects launched. But in 2025, that number was 4,500, meaning 20% of all objects launched into space since the 1950s were launched last year.

Most of these launches came from companies in the United States, such as SpaceX and Rocket Labs. Companies like these, along with those outside of the U.S., have plans for large satellite constellations composed of hundreds of thousands to a million satellites.

The more objects and payloads launched, the more reentry events occur. Satellite operators are required to remove their decommissioned satellites from orbit after 25 years to comply with regulations set in place by international committees. Groups across the world, including the Federal Communications Commission in the U.S., have pushed to shorten the deorbit window to five years. Because of these guidelines, the full influx of reentry debris events from these recent launches will not be felt for another 10 or more years.

The objects launched and policy decisions made today will have a lasting effect on future safety.

Carbon fiber

As the world has progressed technologically, efficiency for launching items into space has too.

Satellites and spacecraft are becoming lighter, stronger and more heat resistant because of materials such as carbon fiber-reinforced plastics and new metals. These strong materials are sought after because they’re lightweight, but they can also cause deorbiting debris to withstand reentry temperatures.

Carbon fiber, once used exclusively in space technology, is now found in common items such as bicycle frames and racing car bodies. It is still the gold standard for fabricating high-strength, low-weight materials for spacecraft components such as rocket fuselages, interstaging – the protective housing found between the rocket stages – and pressure vessels that experience extreme temperatures and high mechanical stress and strain.

Simple metals such as aluminum and steel melt and burn away, while complex materials such as carbon fiber, which is manufactured at up to 5,000 F (3,000 C), burn away unpredictably, changing the way jettisoned components break up upon reentry.

Since the early 2000s, a majority of recovered space debris contains either carbon fiber-reinforced plastic sections or metal components wrapped with carbon fiber. The carbon fiber can act as an unintentional heat shield for heavier, more harmful debris.

A map showing the world with dots spread across the U.S., South America, the coasts of southern Africa, Australia and Southeast Asia.
This map shows locations where confirmed space debris has been recovered. With the increase in launches, the European Space Agency predicts that future space debris could fall practically anywhere across the world. European Space Agency

Design For demise

Design for demise is a major area of research focused on mitigating the risk of reentry debris. Instead of relying on controlled and meticulously timed deorbits that send components that survive reentry into the ocean at the end of their lives, spacecraft components are engineered to ensure they completely disintegrate while deorbiting through the atmosphere.

Design for demise can take many forms. These range from changing to more heat-susceptible materials to relocating harder-to-burn components to areas of the spacecraft that will be hotter during reentry, or using linkages that break apart at high temperatures to separate structures into smaller components to help them burn up.

With so much focus historically on spacecraft being made from the lightest, strongest and most heat-resistant materials available, it may seem counterintuitive to intentionally make some materials weaker. The key is making materials smarter, so they maintain their strength during their mission but weaken under the heat of reentry.

The Conversation

Matthew Ray's lab is developing and working toward patenting a system to decrease risk from future carbon fiber based reentry debris.

Reese Hufnagel conducts research on space debris and is developing ways to make future carbon composites safer for use in orbit.

Three hours of free power a day sounds good – but is Australia’s scheme fair?

xavierarnau/Getty

From July 1, many Australians can choose something that once sounded absurd: free electricity in the middle of the day. The federal government’s opt-in Solar Sharer Offer will give three hours of free power to households with smart meters in New South Wales, South Australia and southeast Queensland. Victoria’s separate scheme will launch in October.

Free power sounds like a giveaway. It isn’t. It’s meant to encourage people to use more electricity during the hours when solar power flows into the grid. The real aim is to get people to shift the use of water heaters, pool pumps, air-conditioning and electric vehicle charging to the middle of the day. At other times, power prices will be slightly more expensive.

The main challenge for Australia’s power systems is no longer how to meet peak demand in the evening. We now have to use or manage the floods of very cheap solar during the sunniest hours when there’s more supply than demand. If this imbalance isn’t managed, electricity voltage and frequency can move outside safe limits, equipment can trip, and the risk of outages rises.

The scheme makes sense. But there are still questions about its fairness. Electrified households will benefit most, while renters and other groups may benefit less.

The challenge of solar abundance

About one in three Australian homes now has solar. At times, this power source can supply 50% of total demand on Australia’s biggest power grid, the National Energy Market. Wholesale prices have regularly gone negative in recent quarters.

In big solar states such as South Australia, solar can supply more power than the state can use. Surplus power is exported, stored in batteries or curtailed – wasted.

The Solar Sharer Offer is meant to make better use of these floods of solar power.

This financial year, the three hours of free power will be 11am to 2pm daily in NSW and southeast Queensland and 12 to 3pm in South Australia. Australia’s energy regulator chose these times to match when solar output is highest, and network and wholesale costs are lowest. This may change year by year.

The reason the scheme isn’t national is because it’s tied to the Default Market Offer — a regulated safety net plan for electricity customers – which only applies in NSW, SA and southeast Queensland.

red brick apartment block in sunshine.
Renters and people in apartments may find it harder to benefit from the free power scheme. Andrew Merry/Getty

Who will benefit most?

Ensuring fair access has been a constant challenge for household clean-energy schemes. People who own their homes and have access to capital are usually better placed to benefit. This scheme has the same issue.

It’s easy to picture the ideal customer for three hours of free power – a homeowner with a smart meter, flexible hot water, electric vehicle, home battery and the ability to choose when power-hungry appliances run.

That’s great for them. But what about everyone else? For instance, you have to have a smart meter to be eligible. Only about 60% of households have one.

The harder question is whether this offer is fair for other households.

Renters, apartment residents and people on embedded networks in retirement villages, caravan parks or shopping centres face another barrier. If they opt in without being able to make good use of the free power, they could actually be worse off due to the higher prices at other times. These concerns were raised during the consultation process.

Making it fairer

The government is aware of these issues. The free power period is capped at 24 kilowatt hours a day, enough to cover several large daytime loads such as hot water, dishwashing, laundry, air-conditioning or part-charging of an EV.

The cap matters because offering electricity for free still incurs costs for energy retailers. To recover the missed revenue during the free window, retailers will boost other usage charges. Capping free power at 24 kWh a day limits how much high-consumption households can use at zero price, which limits how much revenue has to be recovered from usage at other times of day.

More needs to be done to ensure it’s fair. A key step is unglamorous but effective: helping households heat water during the day. Heating water takes a lot of power. Electric hot-water systems are often on controlled-load tariffs designed for overnight operation. A South Australian trial moved close to 50% of water heating from night to day with little reported inconvenience.

Where safe and practical, retailers and network businesses could shift the time these systems charge to the middle of the day. Governments could help rentals and apartment residents by supporting the use of timers, smart controllers and efficient heat-pump hot-water systems. The same logic applies to other flexible loads.

The free lunch is real. The question is who gets a seat at the table.

The Conversation

Saman Gorji receives funding from the Recycling and Clean Energy Commercialisation Hub (REACH), supported by the Australian government's Trailblazer Universities Program.

Alireza Ganjovi does not work for, consult, own shares in or receive funding from any company or organisation that would benefit from this article, and has disclosed no relevant affiliations beyond their academic appointment.

❌
Subscriptions