A New Approach Can Better Predict Debris Flow Hazards Years After Fires
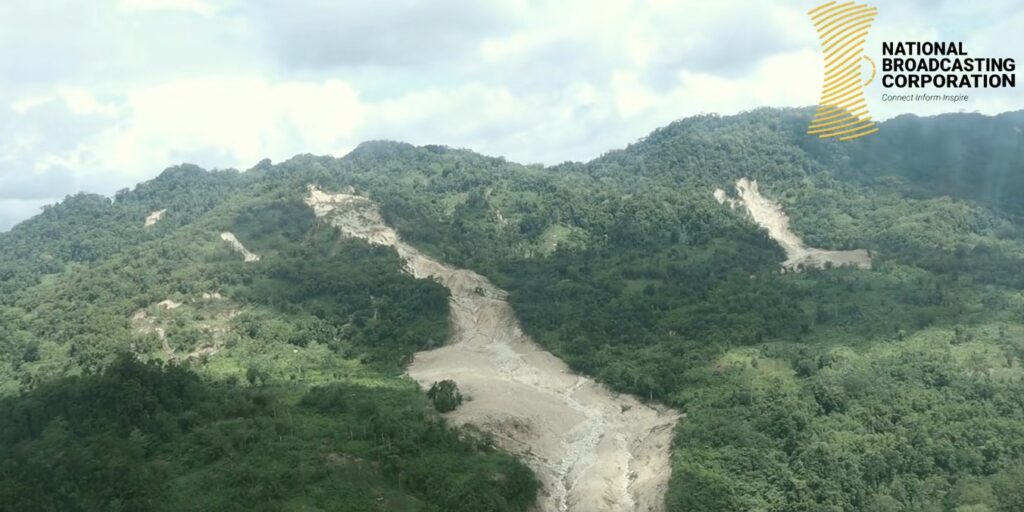
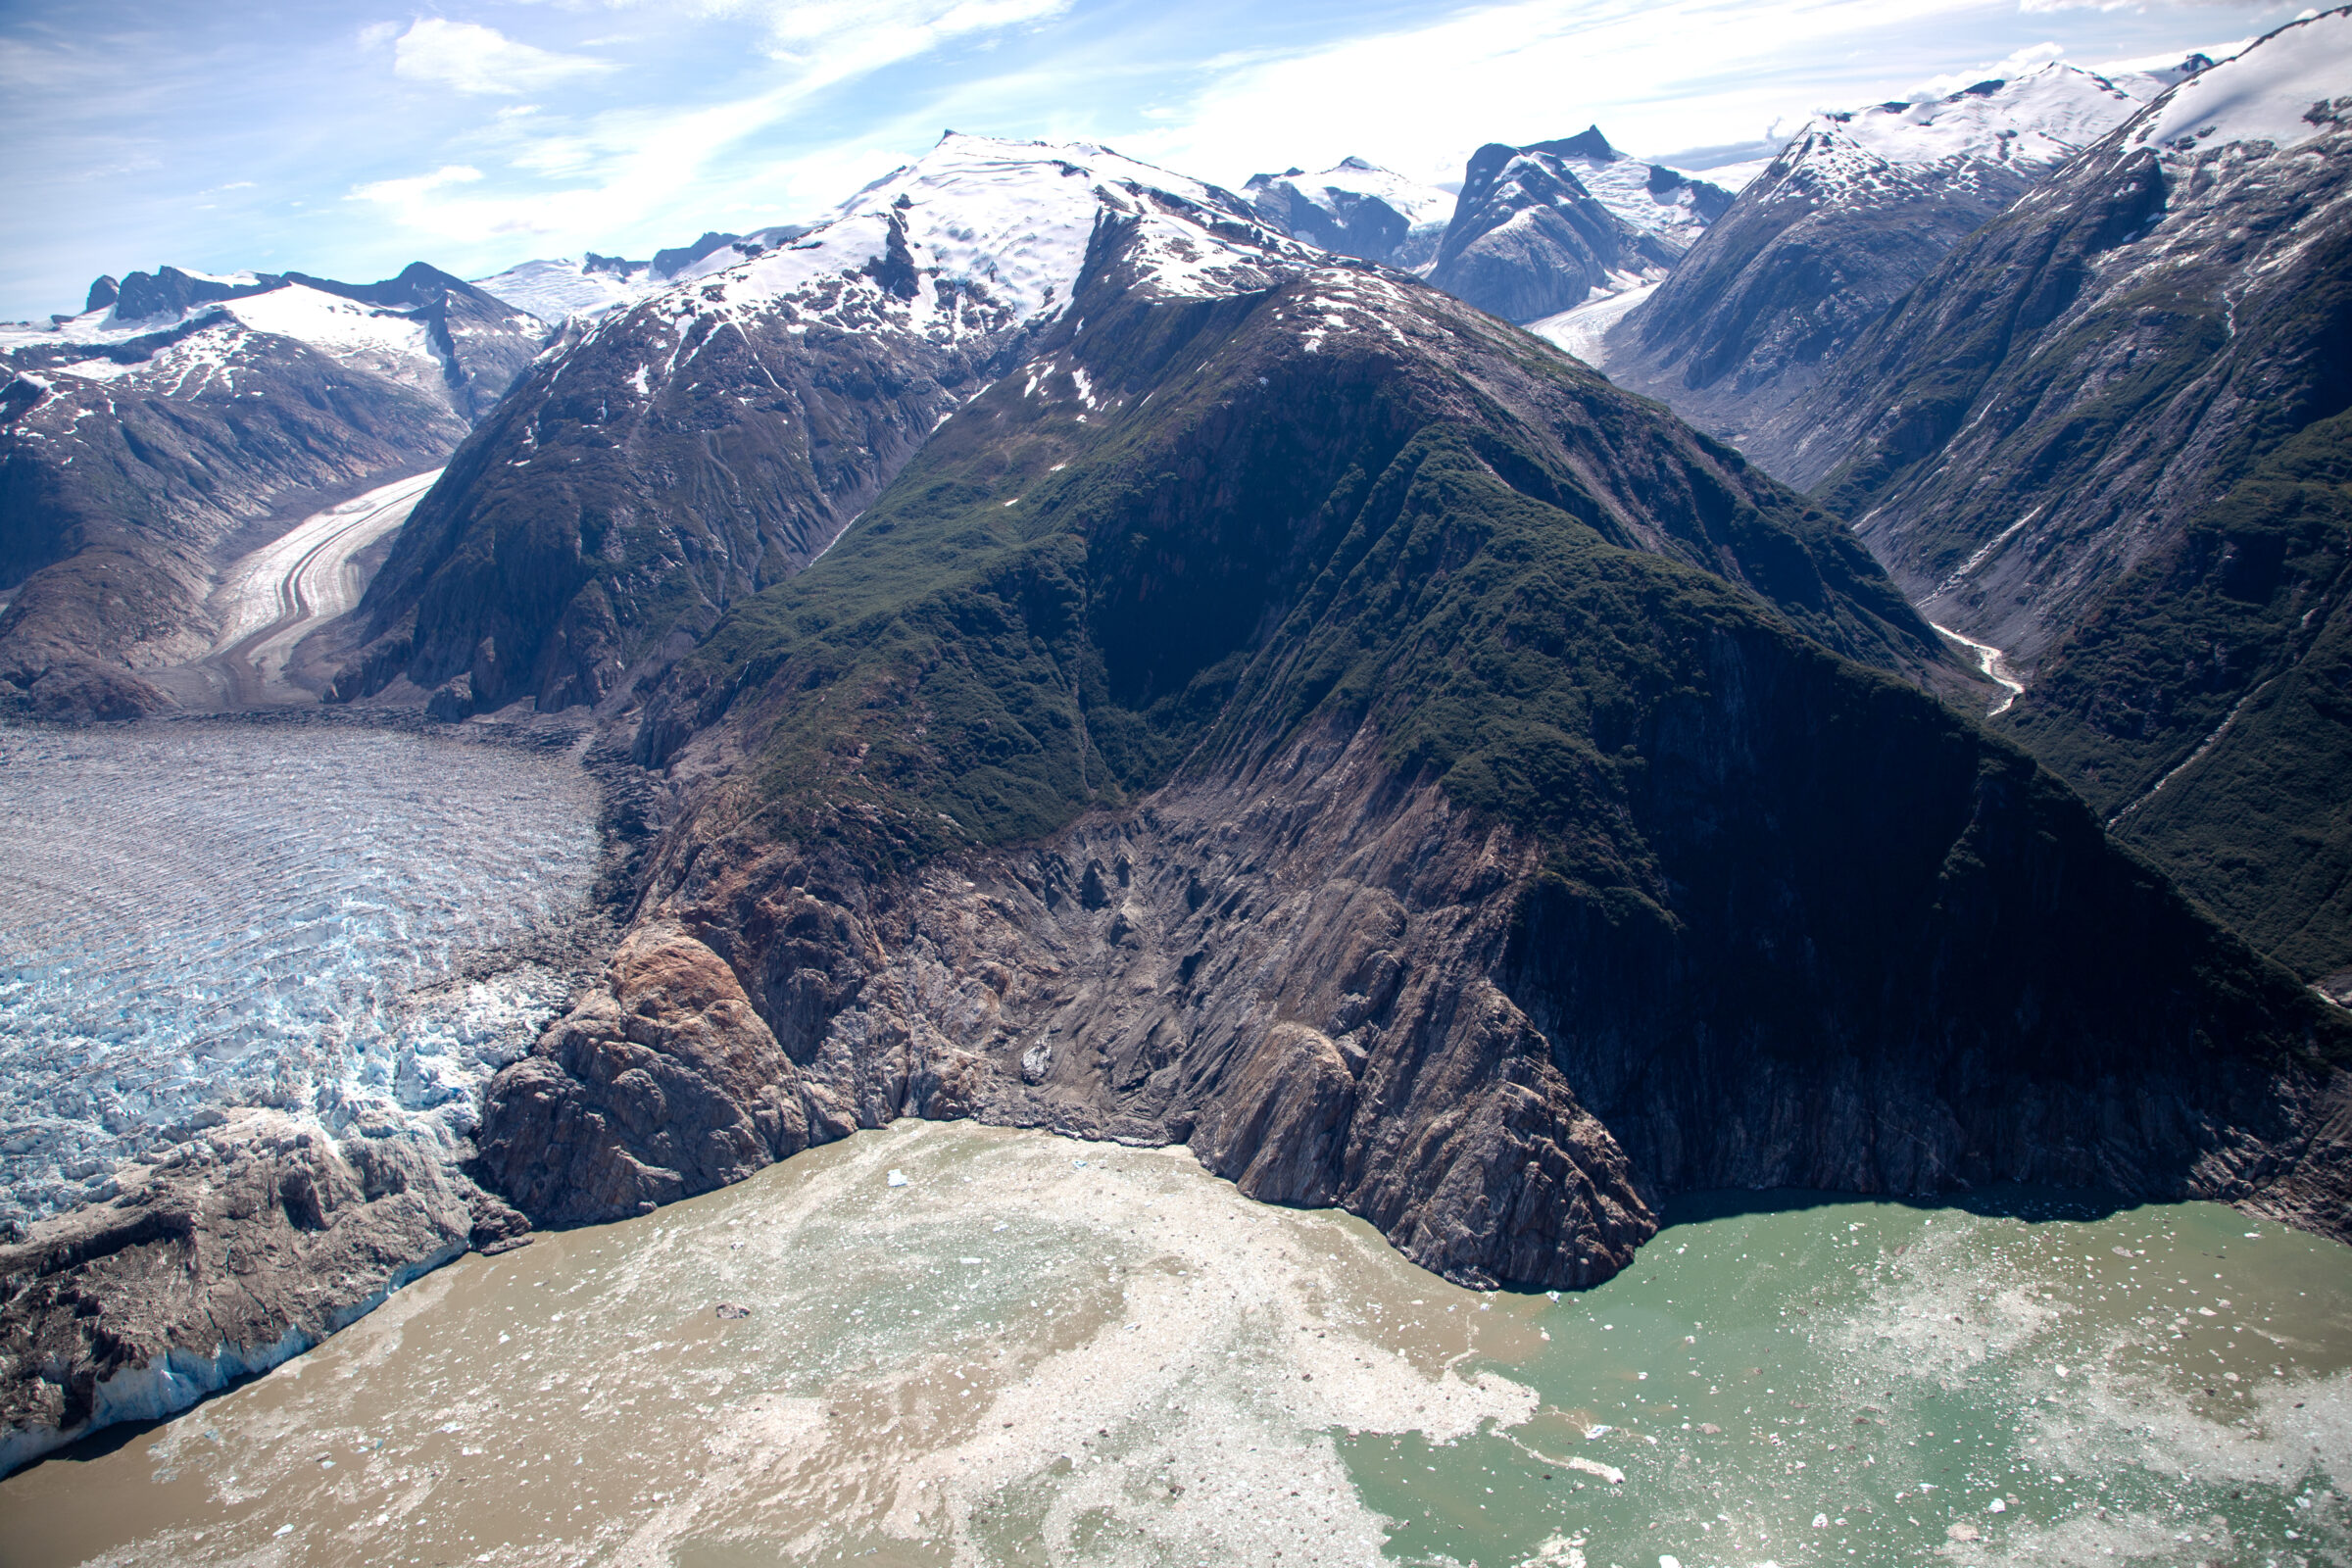
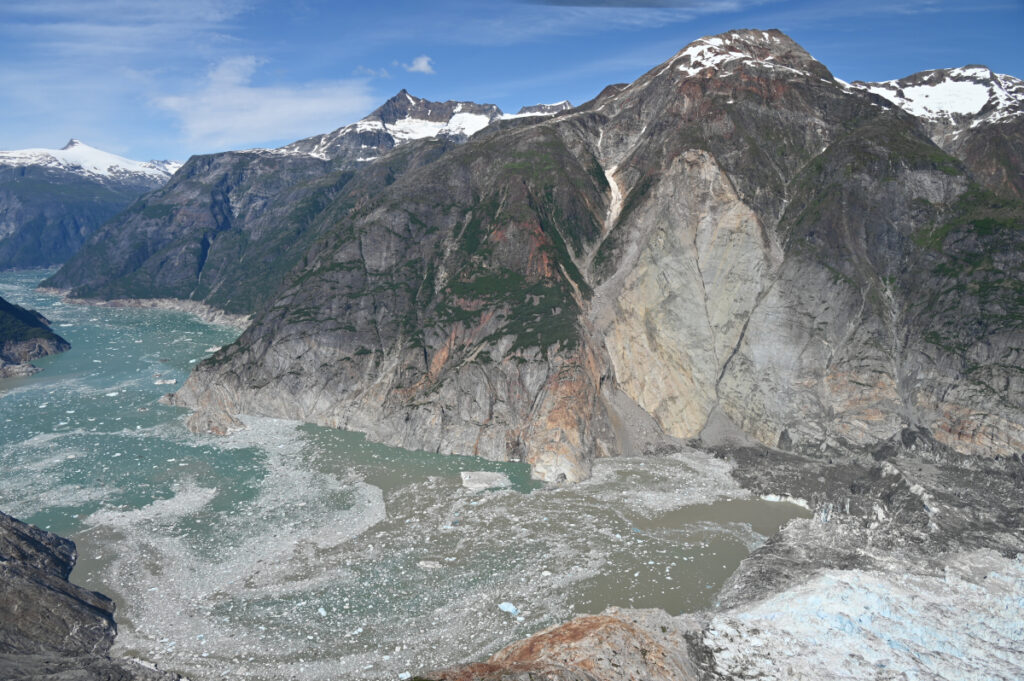
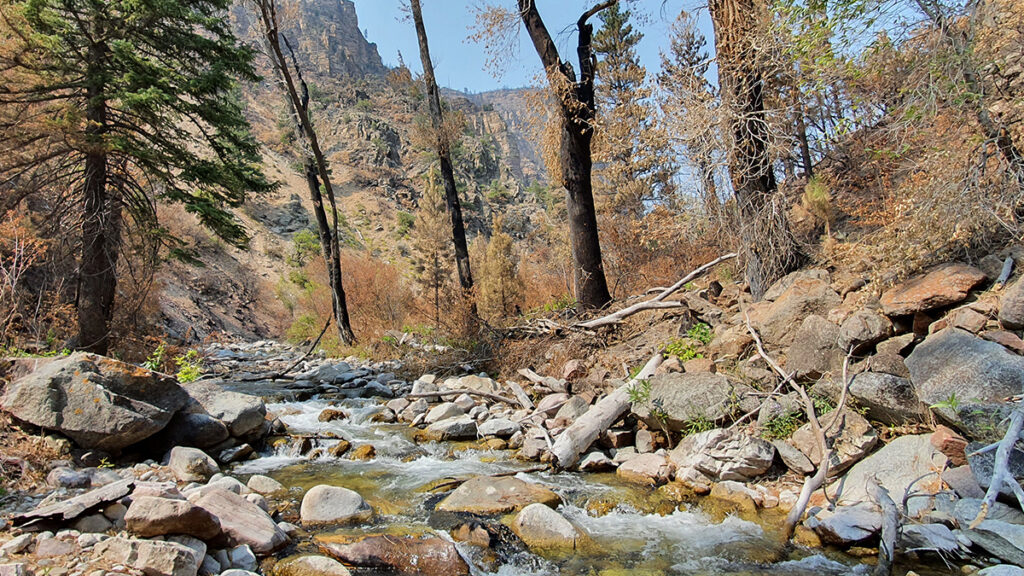
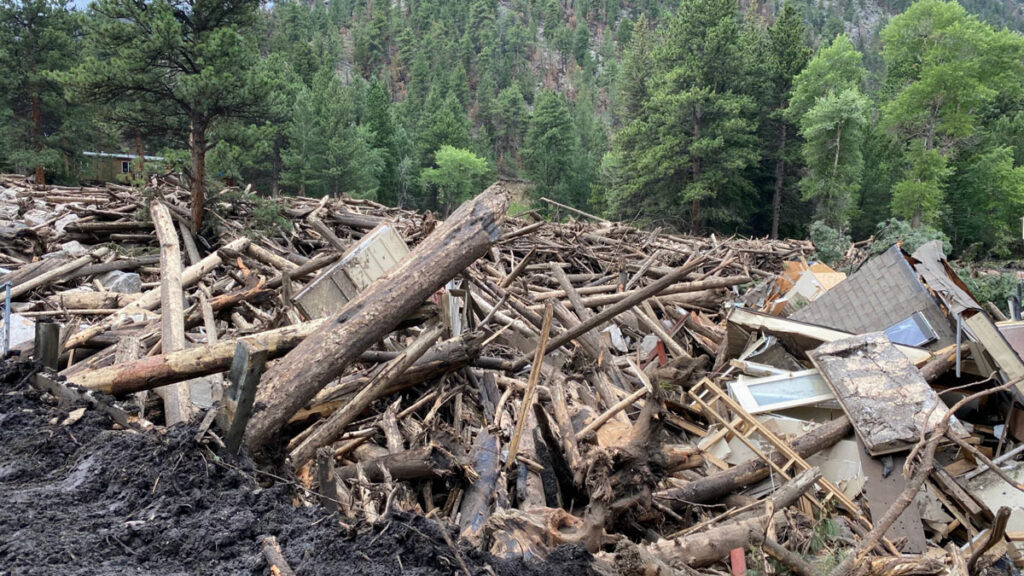
Months after wildfires eliminate vegetation that holds hillside sediment together, debris flows—destructive landslides that carry bulky material down once-stable slopes—can devastate infrastructure, taking out roads and buildings in their wake.
Though the U.S. Geological Survey (USGS) creates hazard predictions used to warn communities of the risk of these postfire debris flows, those predictions haven’t fully considered how recovering vegetation reduces risk over time—until now.
A new study published in Geosphere presents a new way to calculate postfire debris flow risk that takes vegetation recovery into account. The USGS will begin using the new method this wildfire season to create more accurate maps of debris flow hazard in the years after a fire.
“I’m so appreciative that the focus on how the debris flow hazard changes over time after fire is being addressed,” said Nancy Calhoun, a geologist and postwildfire debris flow program manager at the Washington Geological Survey who was not involved in the new study. Calhoun said she relies on the USGS hazard assessments for virtually everything her job requires.
“We’re glad to have a way that we can help our partners moderate those situations where the hazard has decreased,” said Andrew Graber, a geologist at the USGS Landslide Hazards Program and lead author of the new study.
Assessing Hazard, Again
After a wildfire, the USGS creates hazard maps that incorporate information about soil type, steepness, and burn severity (how much vegetation has been lost) to show where the risk of a debris flow may be elevated.
Then, the agency distributes this guidance to the National Weather Service, which uses it to set rainfall thresholds: levels of rainfall at which a debris flow becomes likely. State, county, and city agencies use those rainfall thresholds to issue warnings or take action when rainfall is imminent, for example, by closing highways or triggering evacuations.
“That left us with some uncertainty when we started to get further away in time from the fire.”
The methods used to create the USGS maps, however, historically relied on a snapshot of the burned area taken just after the fire, and the maps weren’t updated to reflect conditions as vegetation grew back and began holding soil in place again.
That led to situations where public safety decisions were made on the basis of outdated maps and rainfall thresholds. For example, concern over debris flows after the 2020 Grizzly Creek Fire in Colorado led to several closures of Interstate 70 in 2022, but the debris flows never happened.
“What [the original assessments] didn’t capture is how the vegetation came back,” Graber said. “That left us with some uncertainty when we started to get further away in time from the fire.”
To test an improved method for these hazard assessments, Graber and the research team incorporated satellite imagery of 12 burned areas that showed the degree of vegetation recovery right after the fire, 1 year after the fire, and 2 years after the fire. Then, they tested their new method by comparing its predictions to rainfall and debris flow data from the 12 burned areas.
The updated method better reflected what had actually happened after the fires, reducing the number of unnecessary warnings without missing real-world debris flows.
Risk Recalibration
The USGS plans to begin using their new workflow to create hazard maps for some higher-profile fires during the coming wildfire season.
“It’s a really important question: Are we still worried about this burn scar?”
That’s exciting for Calhoun. As part of her job, she’s in constant contact with emergency managers who periodically ask how worried they should be about debris flows in areas that burned years ago. “It’s a really important question: Are we still worried about this burn scar?” she said.
Right now, Calhoun has no data to point to in the years after a fire to give an updated answer to that question. Using the new method from Graber and the research team, she will.
“Because they’re using satellite [imagery] and repeatable quantitative methods to look at these burn scars over time, we’ll actually be able to say something useful and informed about vegetation recovery,” she said.
Having a deeper understanding of how debris flow risk evolves over time is especially important because debris flows themselves are becoming a greater risk to the public as a result of increasingly intense wildfires and rainstorms. In addition, more accurate assessments can reduce warning fatigue, which occurs when too many false alarms lead to people ignoring or opting out of alerts.
Graber hopes he and the USGS will continue to improve their methods for assessing debris flow hazards by collecting more debris flow data across the country and improving the underlying equation for hazard assessments so that it better reflects the unique conditions of different ecosystems in the United States. USGS researchers also published a new study in March presenting a method to generate maps of where debris flows might travel if they do occur.
“It’s a big year for USGS’s useful postfire products,” Calhoun said.
—Grace van Deelen (@gvd.bsky.social), Staff Writer
This news article is included in our ENGAGE resource for educators seeking science news for their classroom lessons. Browse all ENGAGE articles, and share with your fellow educators how you integrated the article into an activity in the comments section below.