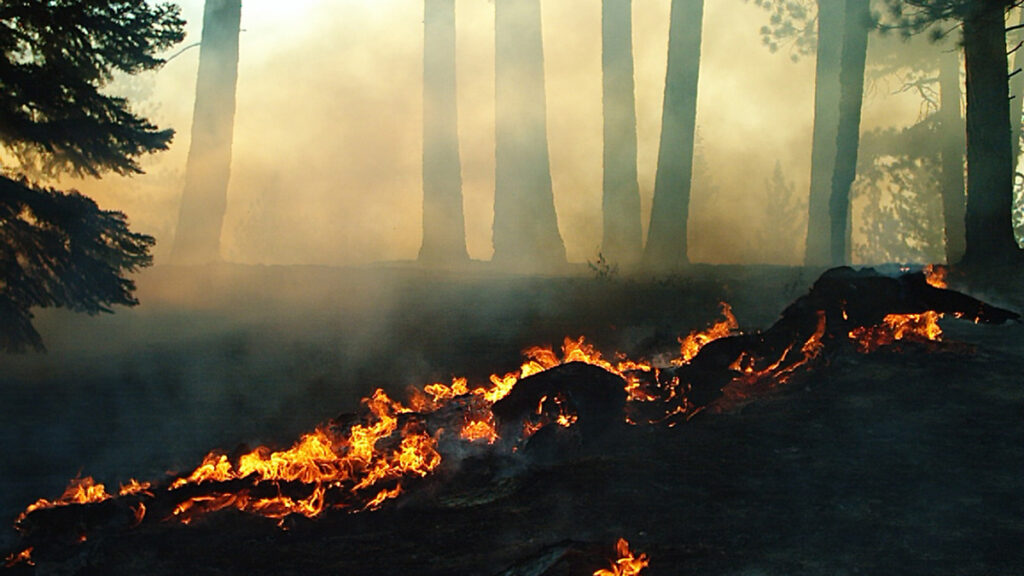
How Much Will Western Wildfires Worsen Under Warming?
Source: AGU Advances
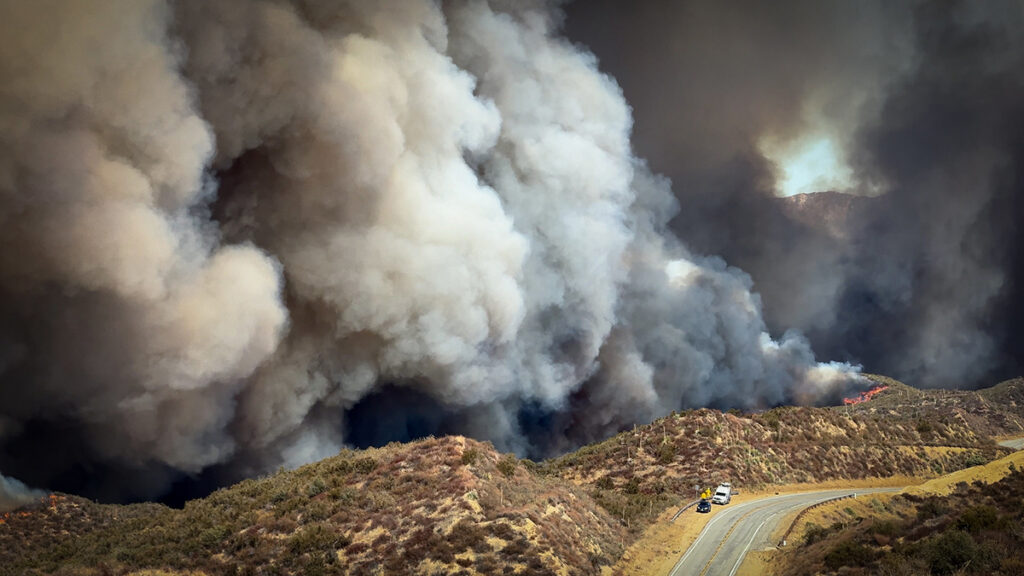
Across the western United States, wildfires are increasing in size and intensity. As the climate continues to warm, more extreme wildfires will reshape landscapes and pose a growing risk to human health and natural ecosystems throughout the West.
Climate models, used to predict other effects of climate change, are unable to directly simulate wildfires. Instead, researchers link previously burned areas to climate variables such as temperature, precipitation, drought, and evaporation, then apply those relationships to future climate projections.
Many recent studies have connected higher vapor pressure deficit (VPD)—a measure of atmospheric dryness—to more area burned in previous fires. VPD increases as the temperature rises, so models that rely on it generally predict an increase in wildfire activity as the climate warms.
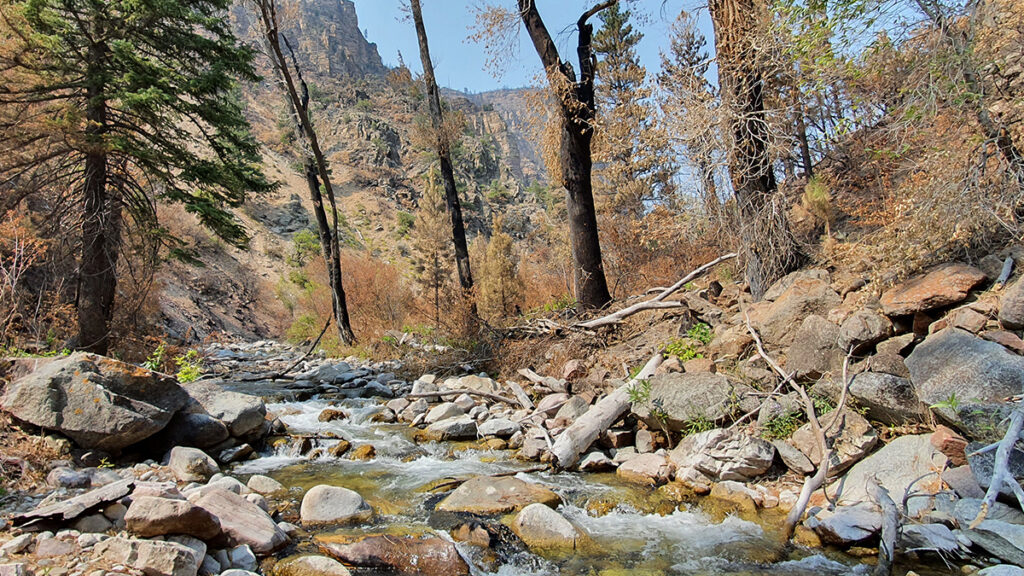
Cheng et al. raise questions about the role VPD plays in modeling wildfire, suggesting that VPD is a poor measure of fuel dryness at larger scales and overestimates potential burned areas under significant warming conditions. Instead, researchers suggest soil moisture could be a more reliable indicator of fuel dryness and lead to more moderate projections of wildfire increases.
The researchers looked at five forested ecoregions in the western states. Using the Western US MTBS-Interagency wildfire dataset from 1984 to 2020 combined with climate data (temperature, VPD, and soil moisture), the researchers analyzed drivers of the area burned from May through October. They connected this information with output from climate models to look at future burn potential.
VPD-based wildfire predictions increase sharply under warming conditions. These predictions showed that under 3°C of average global warming, 16 times as much land would burn by the end of the century, compared to historical levels. Under 4°C of warming, up to 66 times more land would burn by the end of the century. This “truly massive” increase, the authors say, would mean fires consuming vegetation almost as soon as it regrows.
Soil moisture, on the other hand, provides a more moderate, though still concerning, picture. Under the same warming scenarios, soil moisture changes would lead to an increase in burned area of only 2–3 times that of the historical period. The researchers argue that projections relying on VPD severely exaggerate wildfire risk. (AGU Advances, https://doi.org/10.1029/2026AV002350, 2026)
—Rebecca Owen (@beccapox.bsky.social), Science Writer