Typically gravitating toward dreamy palettes of soft blues, grays, and oranges, Scottish artist Andrew McIntosh opts for a sanguine red in a new body of work. The crimson paintings continue McIntosh’s otherworldly landscapes that cast familiar forms like mountains and valleys in a strange, uncanny light. Glowing orbs float among the craggy terrain and veil the scenes in mystery.
“These works sit somewhere between memory and invention—familiar landscapes interrupted by something I don’t ful
Typically gravitating toward dreamy palettes of soft blues, grays, and oranges, Scottish artist Andrew McIntosh opts for a sanguine red in a new body of work. The crimson paintings continue McIntosh’s otherworldly landscapes that cast familiar forms like mountains and valleys in a strange, uncanny light. Glowing orbs float among the craggy terrain and veil the scenes in mystery.
“These works sit somewhere between memory and invention—familiar landscapes interrupted by something I don’t fully understand,” the artist says.
“Whitney” (2026), oil on linen, 170 x 130 centimeters
On view at School Gallery, these bold pieces comprise the artist’s solo exhibition, I Hope This Transmission Finds You Soon. Evoking alien communication and the unknowns that surround us, even in recognizable spaces, the show draws on Cormac McCarthy’s 1985 novel Blood Meridian, a Gothic Western rife with violence and an unyielding desire for dominance.
The gallery offers insight into the exhibition with an apt quote from the book:
The truth about the world … is that anything is possible. Had you not seen it all from birth and thereby bled it of its strangeness it would appear to you for what it is, a hat trick in a medicine show, a fevered dream, a trance be populate with chimeras having neither analogue nor precedent, an itinerant carnival, a migratory tent show whose ultimate destination after many a pitch in many a mudded field is unspeakable and calamitous beyond reckoning.
I Hope This Transmission Finds You Soon is on view through May 30 in Folkestone, U.K. Find more from McIntosh on Instagram.
“K2” (2026), oil on linen, 38 x 43 centimeters“Gasherbrum” (2026), oil on linen, 38 x 43 centimeters“Matterhorn” (2026), oil on board, 20 x 15 centimetersDetail of “Whitney” (2026)
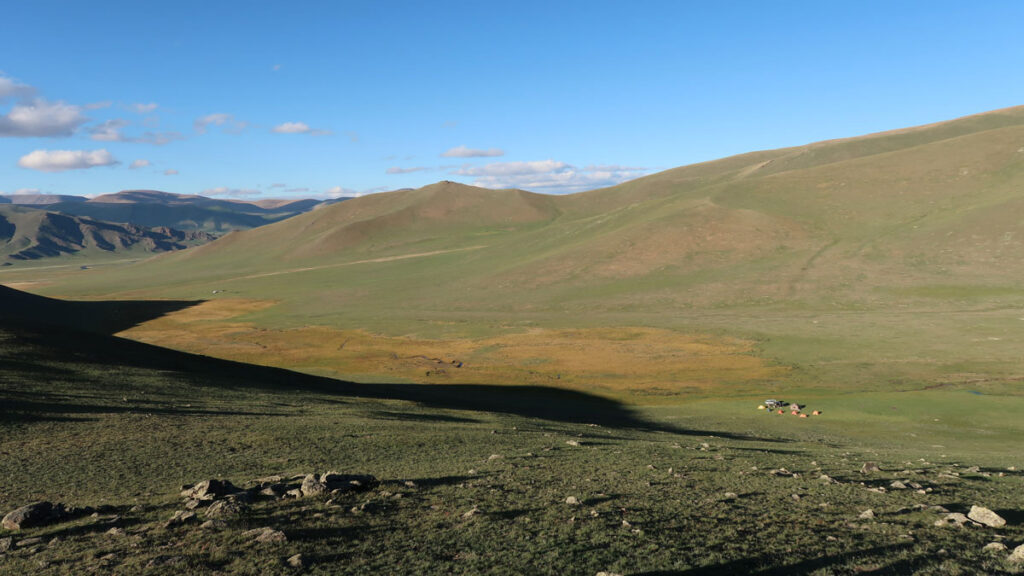
Central Mongolia’s Hangay Mountains have long posed a conundrum. Rising 4 kilometers above sea level, the dome-shaped range plays a key role in shaping the region’s climate. But it couldn’t have formed in the same way as most equally tall mountain ranges.
“These mountains in central Mongolia are very far from any plate boundary, about 5,000 kilometers away from the Pacific margin,” said Pengfei Li, a geologist at the Chinese Academy of Sciences’ Guangzhou Institute of Geochemistry. “
Central Mongolia’s Hangay Mountains have long posed a conundrum. Rising 4 kilometers above sea level, the dome-shaped range plays a key role in shaping the region’s climate. But it couldn’t have formed in the same way as most equally tall mountain ranges.
“These mountains in central Mongolia are very far from any plate boundary, about 5,000 kilometers away from the Pacific margin,” said Pengfei Li, a geologist at the Chinese Academy of Sciences’ Guangzhou Institute of Geochemistry. “It’s very hard to understand why we have such a mountain range so far from the plate boundary.”
Li recently led research finding that geochemical evidence supports a compelling explanation of how these oddball mountains formed. The researchers proposed that at the site of the future mountains, a U-shaped bend in a tectonic plate led to an extra-thick lithosphere. A chunk of that heavy lithosphere eventually broke off and sunk into the mantle. Free of the extra weight, the crust then rebounded upward as the Hangay Mountains.
Bend and Snap
“It’s the first discovery of volcanism for this period.”
Tectonic plates are far from rigid. As they move above, below, and against each other, sections of the plates far from the boundary can develop curves and folds like a scrunched up tablecloth. Curved sections, called oroclines, are common around the world. At about 6,000 kilometers long, the Mongolian orocline is one of the longest, and the Hangay Mountains sit right at the curviest part of the orocline’s U shape.
Li and his colleagues suspected that the Hangays’ location along the orocline is no coincidence. During multiple field expeditions from 2018 through 2026, the researchers collected rock samples from several sites in the Hangay Mountains that showed signs of ancient volcanic activity. Uranium-lead dating of zircons within those samples showed that the area experienced volcanic activity in the early Cretaceous period 124–114 million years ago.
“When I saw the age, I was surprised,” Li said. “120 million years—no one had ever reported volcanoes [in Mongolia] during this period.…It’s the first discovery of volcanism for this period.”
The team also analyzed the samples for major and trace elements to determine the depth at which the rocks formed. Their geochemical analysis revealed that the rocks formed in the lithosphere 80 kilometers below the surface. They published these results in Geology in April.
It’s pretty odd that the rocks originated so deep, Li said, because the modern-day lithosphere is only 70 kilometers thick.
The team proposed that when the continental plate folded and created the Mongolian orocline 200 million years ago, the lithosphere bunched up and became thicker in the curve of the U shape. That thicker section of lithosphere, a root at least 80 kilometers thick, would have been unstable in the long term, Li explained.
The lithospheric root would have been too heavy to remain attached to the crust above for long, and a chunk of it would have eventually snapped off. When it sunk, or foundered, into the deep mantle, it would have melted and generated the volcanic activity recorded in the rocks the team studied. Free from the weight of that lithospheric root, the crust above would have rebounded into the dome-shaped mountain range visible today.
Complicated Yet Compelling
“Their story, though complicated, makes a great deal of sense and in a way provides affirmation of a prediction made some time ago regarding oroclines.”
“The story that [the researchers] have put together to explain the massive Hangay topographic ‘dome’ of central west Mongolia is a compelling one that spans more than the past 200 million years of Earth history,” said Stephen Johnston, a tectonics researcher at the University of Alberta in Canada who was not involved with this research. Past research into the Iberian orocline suggested that oroclines might lead to lithospheric thickening, and this explanation of the Hangay Mountains fits that narrative.
“Their story, though complicated, makes a great deal of sense and in a way provides affirmation of a prediction made some time ago regarding oroclines,” Johnston added.
Johnston said that the new explanation of how the Hangay Mountains formed makes him wonder why it took so long—80 million years—between when the orocline formed and when the lithospheric root sank.
“This seems a long time for a gravitationally unstable mantle root to have remained attached to the overlying crust,” he said. He hopes that future work can help determine whether this process has taken place at other oroclines around the world and has simply been overlooked or whether there is something special about the Mongolian orocline.
Li and his team have turned their attention to how the formation of the Hangay Mountains shaped the region’s ancient climate. Today, the towering mountain range prevents moist air from northern Mongolia from reaching the parched Gobi Desert in the south. They hope to connect how a process deep underground, like lithospheric foundering, affected the paleoclimate and, consequently, the region’s habitability.
“It’s very new to try to understand the Earth’s habitability from a deeper sense,” Li said.
This news article is included in our ENGAGE resource for educators seeking science news for their classroom lessons. Browse all ENGAGE articles, and share with your fellow educators how you integrated the article into an activity in the comments section below.
Citation: Cartier, K. M. S. (2026), Mongolian mountains rose when the crust bounced back, Eos, 107, https://doi.org/10.1029/2026EO260153. Published on 15 May 2026.
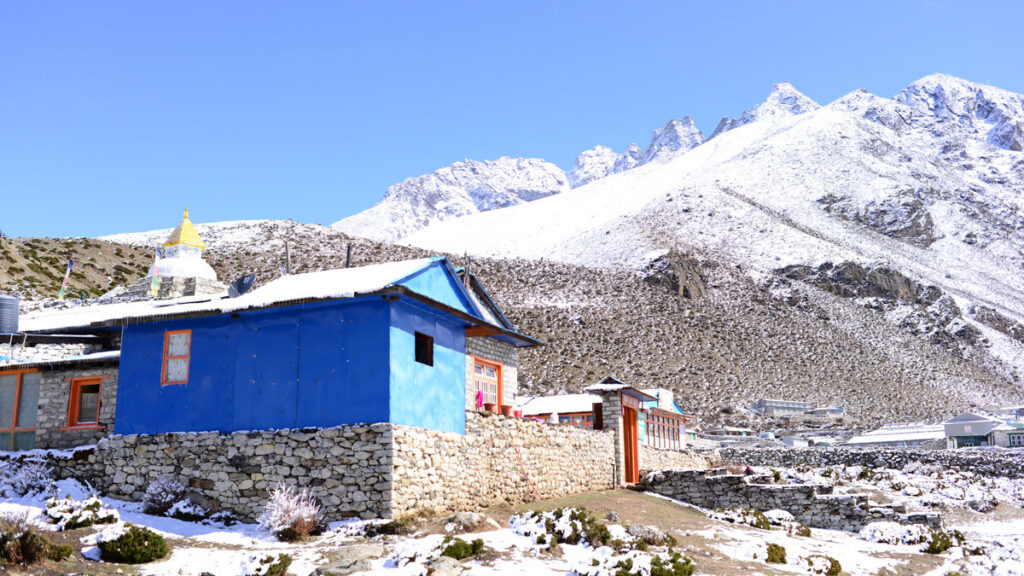
When it comes to thriving at high elevation, diminutive plants are always a safe bet. And low-lying vegetation is in fact colonizing higher and higher reaches as the climate changes, new results reveal. Researchers analyzed more than 2 decades’ worth of satellite data and showed that the vegetation line in the Himalayas is moving upward, in some cases by up to several meters per year. These changes have implications for the hydrology of the region and therefore for water resources for the popul
When it comes to thriving at high elevation, diminutive plants are always a safe bet. And low-lying vegetation is in fact colonizing higher and higher reaches as the climate changes, new results reveal. Researchers analyzed more than 2 decades’ worth of satellite data and showed that the vegetation line in the Himalayas is moving upward, in some cases by up to several meters per year. These changes have implications for the hydrology of the region and therefore for water resources for the population centers located downstream, the team reported last month in Ecography.
Mountains and People
“If you’re going to understand climate change across the Himalayas, you can’t just look at one location.”
The Himalayas, with their massive stores of frozen water, are part of a region known as the planet’s “Third Pole.” Nearly a billion people rely on water sourced from this area, but the Himalayas aren’t immune to climate change—shifts in temperature and precipitation patterns are causing glaciers to melt and permafrost to thaw, among other effects. “The Himalayan mountains are experiencing a lot of ecosystem changes,” said Ruolin Leng, an Earth scientist who led this new research while at the University of Exeter in the United Kingdom. She currently works at H2Tab, a wellness company.
And while the macroscopic effects of climate change in mountainous regions—the melting of the aforementioned glaciers, for example—have been readily studied, shifts in vegetation are often overlooked, said Leng. That’s a problem because plant cover affects everything from soil moisture levels to water runoff to the albedo of the planet’s surface, all of which have consequences for how water moves through the larger system, she said. “It’s a very important factor in the hydrological system.”
Leng and her colleagues focused on six sites, each roughly 40,000 square kilometers in size, in Bhutan, Nepal, and politically disputed areas farther west. Altogether the locales spanned roughly 15° in longitude (about the width of a U.S. time zone). The choice to analyze several locations along an east-west gradient was deliberate, said Stephan Harrison, a climate scientist also at the University of Exeter and a member of the research team. “The western Himalayas are very different from the eastern Himalayas in terms of climate. If you’re going to understand climate change across the Himalayas, you can’t just look at one location.”
Spotting Vegetation from Space
For each of those sites, the researchers mined satellite observations collected from 1999 to 2022 by the NASA/U.S. Geological Survey Landsat program. The researchers focused on visible and near-infrared observations to calculate a metric known as the normalized difference vegetation index (NDVI). Vegetation tends to reflect relatively little visible light while reflecting much more near-infrared light, and that fact can be exploited to infer the presence of vegetation in remote sensing data, said Karen Anderson, a remote sensing scientist at the Environment and Sustainability Institute at the University of Exeter and a member of the research team.
After masking out pixels too obscured by clouds or snow to correctly analyze, Leng and her colleagues calculated the NDVI for each 30- × 30-meter Landsat pixel within their study regions. The team retained pixels with NDVI levels above a minimum threshold and used those data, combined with topography information, to estimate the maximum elevation that was reliably vegetated each year. All six sites exhibited upward trends in the elevations of their vegetation lines over time, the researchers found. A site in central Nepal straddling the country’s northern border recorded the largest changes: From 1999 to 2022, the elevation of its vegetation line rose from roughly 5,520 meters to 5,670 meters, an increase of just under 7 meters per year on average. The five remaining sites all recorded annual upward shifts ranging from about 1 to 6 meters per year on average.
“Broadly speaking, plants are moving up mountains,” said Anderson. But different regions are responding differently, she added. (And while similar results have been previously noted in the Himalayas, not all plant life everywhere is moving up—recent research has shown that some tree lines are in fact moving downslope.)
A Climatic Culprit?
“People neglect the little plants.”
To investigate the potential drivers behind these changes, the team studied correlations with three climatic parameters: temperature, total precipitation, and snow depth. These data came from the European Centre for Medium-Range Weather Forecasts reanalysis dataset, which has a spatial resolution of roughly 30 kilometers.
Leng and her collaborators found that their site with the fastest-changing vegetation line also recorded the most rapid increase in snow depth over time. These two changes might therefore be linked, but more work is needed, Anderson admitted. “We haven’t addressed the causal link here. We’ve simply looked for patterns.”
There’s also a significant mismatch in the spatial resolution of the team’s meteorological data and their Landsat data, said Trevor Keenan, an ecosystem scientist at the University of California, Berkeley not involved in the research. Such a discrepancy can be particularly problematic in complex landscapes like mountain ranges because the coarse meteorological data might not be capturing the true microclimates that are bound to persist in such places, he said. “With heterogenous terrain and large elevational gradients, you really need that microclimate information.”
Sagarmatha National Park in Nepal, home to Mount Everest, is also host to rhododendron forests like this one. Credit: Peter Prokosch, CC BY-NC-SA 2.0
Anderson knows the geographical complexity of the Himalayas firsthand—in 2017 and 2022, she and other scientists conducted fieldwork in Nepal that informed this research. Those trips were a special opportunity to see plants like dwarf rhododendron thriving in tough conditions, she said. And it was a good lesson in appreciating some of the most diminutive members of the plant kingdom, Anderson added. “People neglect the little plants.”
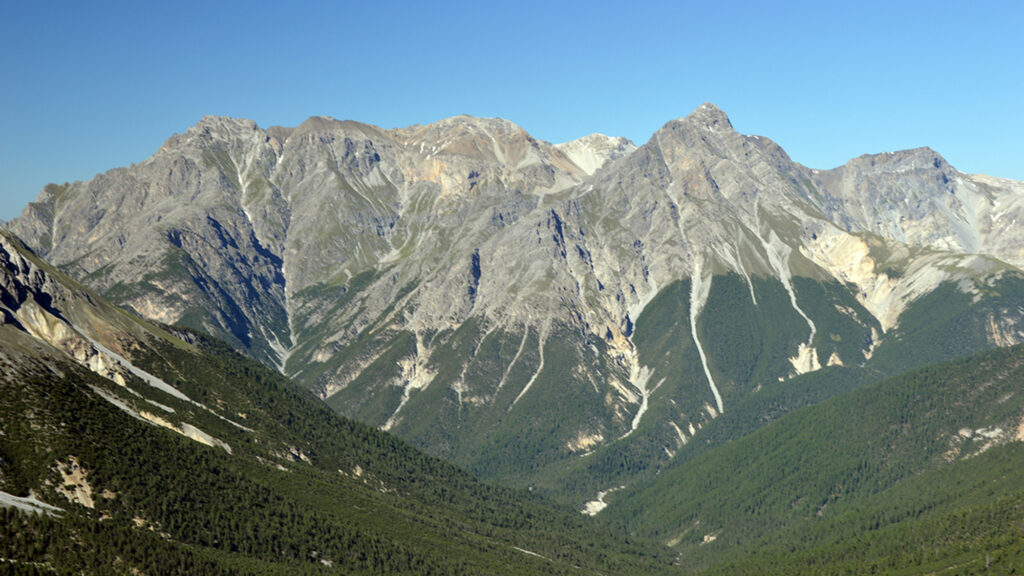
As the climate warms, tree lines are generally understood to move up, because regions that were previously too cold for trees to survive now have higher, more tree friendly temperatures.
A tree line is clearly visible in the Swiss National Park, in Graubünden, Switzerland. Credit: Sabine Rumpf, University of Basel
This migration can be seen in these images of Canada’s Waterton Lakes National Park…
Rising tree lines are visible in Canada’s Waterton Lakes National Park,
As the climate warms, tree lines are generally understood to move up, because regions that were previously too cold for trees to survive now have higher, more tree friendly temperatures.
A tree line is clearly visible in the Swiss National Park, in Graubünden, Switzerland. Credit: Sabine Rumpf, University of Basel
This migration can be seen in these images of Canada’s Waterton Lakes National Park…
Rising tree lines are visible in Canada’s Waterton Lakes National Park, seen here in 1913 (left) and 2007 (right). Credit: Mountain Legacy Project
…and of Jackson Glacier in Montana’s Glacier National Park, for example.
Jackson Glacier, in Montana’s Glacier National Park, is seen here in 1912 and 2009. As the climate has warmed, the glacier has receded significantly, and tree lines have risen. Credit: MJ Elrod, U of M Library–9/3/2009, L McKeon, USGS
But new research, published in the International Journal of Applied Earth Observation and Geoinformation, paints a more complicated picture: Between 2000 and 2020, 42% of tree lines shifted up, true. But 25% of them actually moved downhill.
Sabine Rumpf, an ecologist at the University of Basel in Switzerland, said many studies of tree line shifts tend to be concentrated in limited geographic areas. A preponderance are based primarily on data from North America, Europe, and the Himalayas, where researchers are more likely to have funding to head to the field to take measurements themselves.
“But that also means that a large proportion of the surface of our planet is so understudied,” Rumpf said. “And [to remedy] that, remote sensing data [are] really amazing because you can get a truly global picture, even though there’s nobody, or too few people, observing things in the field.”
Tree Lines Aren’t Living up to Their Potential
So the team set out to take a more global look. They used a world mountain map, developed in 2018, with a 250-meter resolution. They did exclude some regions from their analysis: cells with less than 10% high-mountain coverage (which have so few trees that they don’t have much of a tree line) and cells more than 95% covered with trees (which have so many trees that they don’t have much of a tree line). For their purposes, the team defined the “observed tree line” as the upper limit of trees that stand 3 meters or taller.
Then, said Rumpf, they used a model to calculate the potential tree lines for each area, because, thanks to human effects on the environment, “where these trees could be surviving is almost always higher than where the trees are currently.” The model looked at the growing season length and mean growing season temperature for each cell in the map’s grid. The researchers determined that if a cell had a growing season length of 94 days or longer, and an average growing season temperature of 6.4°C or higher, it could potentially host trees. Cells that didn’t meet both criteria were considered unable to be covered in forest, and thus above the potential tree line.
With this model, “you can calculate based on climatic data where trees could potentially occur or not occur, even though they might not be there in the field,” Rumpf said. “It’s actually super simple. And that’s the beauty of it.”
Credit: Sabine Rumpf, University of Basel
Jordon Tourville, a terrestrial ecologist with the Appalachian Mountain Club, said the overall findings are not surprising, because other studies have shown seemingly “paradoxical downslope shifts in some cases.” But he noted that whereas this study estimated potential tree lines based on temperature constraints, some scientists have suggested that factors such as nutrient availability and wind exposure are also important in determining tree line position.
Unsurprising, on Second Thought
In areas with more human disturbance, the upward spread of trees is suppressed, or even reversed.
Armed with this information about observed versus potential tree lines, the researchers hypothesized that areas with the smallest deviation between the two were mostly responding to climatic factors. In contrast, they speculated, areas with a greater difference between observed and potential tree lines were likely experiencing more anthropogenic disturbance, such as logging, agriculture, and infrastructure development.
Their hypothesis held up. In areas with less human disturbance, tree lines were moving upward more quickly (the researchers noted, though, that the upward migration of tree lines lagged behind the rate of climate change). In areas with more human disturbance, the upward spread of trees is suppressed, or even reversed.
Fire played a big role in tree line shifts as well: The researchers found that 38% of the downslope shifts were linked to fire events. Wildfires played a particularly big role in western North America and Alaska.
Wildfires played a particularly large role in the downward shift of tree lines in western North America. Here, a tree line is visible in California’s Little Lakes Valley. Credit: mlhradio/Flickr, CC BY-NC 2.0
Rumpf and several of her colleagues are located in the Alps, where glaciers are retreating, tree lines are climbing, and towns are generally more threatened by mudslides than by wildfires.
Some of the study’s findings, like a quarter of tree lines shifting down, or such a clear signal from wildfires in some areas, were at first unexpected. But after some reflection, Rumpf realized the diversity of data was a perfect example of why global-scale research is important.
“A lot of scientific funding is based in North America and Europe,” Rumpf said, which means many studies return similar results. “Then we do something global and we are surprised that things are different somewhere else on the globe?… I mean, well, duh.”
This news article is included in our ENGAGE resource for educators seeking science news for their classroom lessons. Browse all ENGAGE articles, and share with your fellow educators how you integrated the article into an activity in the comments section below.
Citation: Gardner, E. (2026), Tree lines are migrating. Some up, some down., Eos, 107, https://doi.org/10.1029/2026EO260146. Published on 12 May 2026.