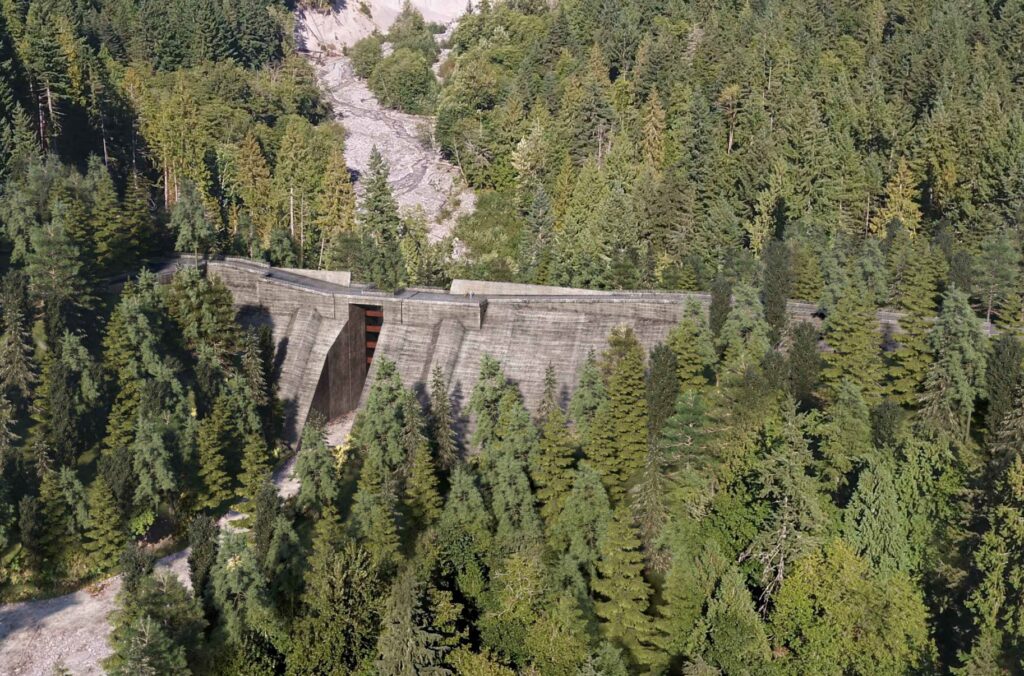
In British Columbia a CAN$115 million project is almost complete to mitigate the risk posed by debris flows to the town of Squamish.
Upstream of the town of Squamish in British Columbia, Canada, an extraordinary project is underway to mitigate the risk of debris flows. Known as the Cheekeye Debris Barrier Project, the scheme involves the construction of a concrete barrier that is 24 metres high across the Cheekeye Fan, designed to catch debris flows with a volume up to 2.4 million cu
In British Columbia a CAN$115 million project is almost complete to mitigate the risk posed by debris flows to the town of Squamish.
Upstream of the town of Squamish in British Columbia, Canada, an extraordinary project is underway to mitigate the risk of debris flows. Known as the Cheekeye Debris Barrier Project, the scheme involves the construction of a concrete barrier that is 24 metres high across the Cheekeye Fan, designed to catch debris flows with a volume up to 2.4 million cubic metres of debris.
This is a fascinating project that makes a great case study for teaching, not least because both the detailed design considerations and the regulatory process for approving the programme are available in detail.
In terms of the detailed design considerations, there is an excellent open access paper in the Canadian Geotechnical Journal (Lesueur et al. 2025) that provides a very comprehensive analysis of the estimation of the potential volume and mobility of the debris flows on the Cheekeye Fan, and of the considerations that went into the final deisign of the structure.
I would highlight the challenges around determining the optimal size of a barrier of this type. The team has been balancing risk against cost, following the principle as outlined in Lesueur et al. (2025):-
“The local government specifies that tolerable debris-flow risks be reduced “as low as reasonably practicable” (ALARP), defined in this project as the point where the cost of additional mitigation measures is grossly disproportionate to the benefits gained.”
Thus, the barrier is not designed to stop the maximum credible debris flow, which is 5.5 million cubic metres (more than double the design event). This is pragmatic engineering at its best, and the Cheekeye Debris Barrier Project provides the level of detail that allows the decision-making process to be fully understood.
These bizarre sandals have gone viral on Japanese social media, so we put them to the test.
If you’re interested in Japan, your timeline and explore pages are likely filled with photos and videos of influencers promoting the country’s latest finds. A lot of the time, though, these influencers miss the true hidden gems that circulate on Japanese social media, and right now there’s one product that locals are raving about: Bare Feet of a Gorilla.
Produced by Osaka-based company Doshisha, as part
These bizarre sandals have gone viral on Japanese social media, so we put them to the test.
If you’re interested in Japan, your timeline and explore pages are likely filled with photos and videos of influencers promoting the country’s latest finds. A lot of the time, though, these influencers miss the true hidden gems that circulate on Japanese social media, and right now there’s one product that locals are raving about: Bare Feet of a Gorilla.
Produced by Osaka-based company Doshisha, as part of its Gorilla Series of quirky lifestyle products, Bare Feet of a Gorilla are acupressure sandals designed to provide a pleasant stimulation to the soles of the feet every time you walk in them.
Ever since their release in late April, users have been heaping praise on the sandals, adoring them not only for their cute similarities to a cloud, but the effect they have on the feet and legs.
▼ Look closer and you’ll find hidden gorillas within the puffy surface of each sandal.
According to Doshisha, these slides were created in response to the growing popularity of so-called “recovery sandals”, which are particularly popular with young people in summer to relieve tired legs. The pleasant stimulation provided by the puffy surface, and the gorillas hidden within them, are said to combat swelling in the legs, an assertion backed by many users of the product, who say their legs look slimmer after wearing them.
From our experience, acupressure sandals tend to have a breaking-in period, where you have to put up with a certain amount of pain before getting used to the stimulation on the soles of your feet. However, when we slid into the Bare Feet of a Gorilla, we were surprised to find that we barely felt any pain.
Although there was a feeling of unevenness, the sensation was soft on the feet, thanks to the EVA material, which had excellent give. The stimulation was moderate, and after just a short period we felt the sluggishness disappear from our legs.
They were wonderfully lightweight, making them very easy to walk in, and we were able to walk about the house for a couple of hours while doing chores before we felt it was time to step out of them. They’re comfortable enough that you could even wear them when ducking out to a nearby convenience store, but they do have an acupressure effect that’s hard on the feet after an extended period of time.
As for the slimming effect, well, we didn’t notice any differences there, but they did help to stimulate the soles of the feet and they also reduced fatigue so they certainly delivered on that promise.
They do look fantatstic, though, and will definitely turn the heads of passersby if you go out in them. Available in black, grey, white, and mint green, the slides come in small, medium and large sizes (22-23 centimetres [8.7–9.1 inches], 23-24 centimetres, and 24-25 centimetres respectively). They can be purchased at Don Quijote stores and affiliated retail chains like Apita and Piago nationwide, priced at 2,189 yen (US$13.76).
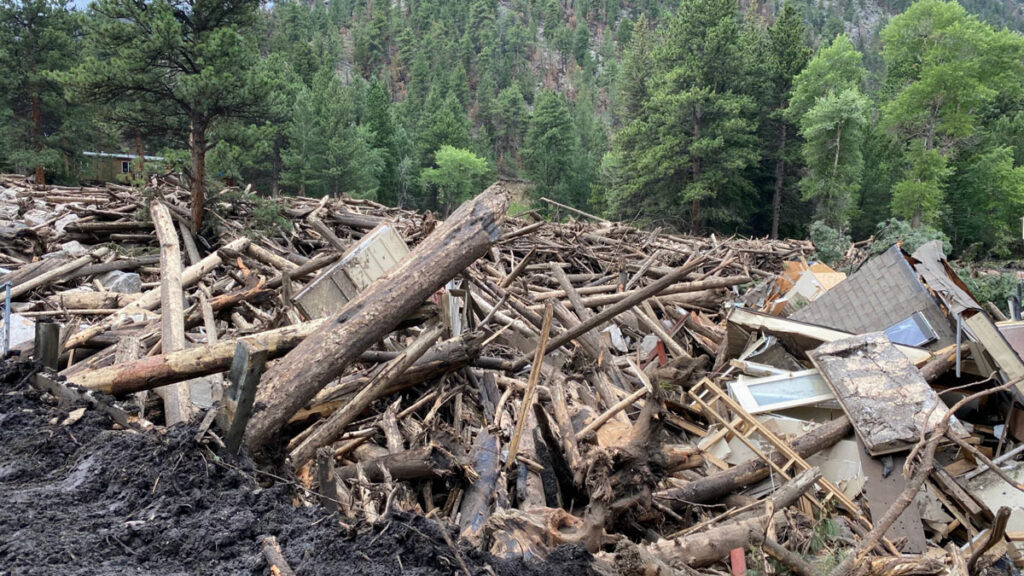
Months after wildfires eliminate vegetation that holds hillside sediment together, debris flows—destructive landslides that carry bulky material down once-stable slopes—can devastate infrastructure, taking out roads and buildings in their wake.
Though the U.S. Geological Survey (USGS) creates hazard predictions used to warn communities of the risk of these postfire debris flows, those predictions haven’t fully considered how recovering vegetation reduces risk over time—until now.
A new study published in Geosphere presents a new way to calculate postfire debris flow risk that takes vegetation recovery into account. The USGS will begin using the new method this wildfire season to create more accurate maps of debris flow hazard in the years after a fire.
“I’m so appreciative that the focus on how the debris flow hazard changes over time after fire is being addressed,” said Nancy Calhoun, a geologist and postwildfire debris flow program manager at the Washington Geological Survey who was not involved in the new study. Calhoun said she relies on the USGS hazard assessments for virtually everything her job requires.
“We’re glad to have a way that we can help our partners moderate those situations where the hazard has decreased,” said Andrew Graber, a geologist at the USGS Landslide Hazards Program and lead author of the new study.
Assessing Hazard, Again
After a wildfire, the USGS creates hazard maps that incorporate information about soil type, steepness, and burn severity (how much vegetation has been lost) to show where the risk of a debris flow may be elevated.
Then, the agency distributes this guidance to the National Weather Service, which uses it to set rainfall thresholds: levels of rainfall at which a debris flow becomes likely. State, county, and city agencies use those rainfall thresholds to issue warnings or take action when rainfall is imminent, for example, by closing highways or triggering evacuations.
“That left us with some uncertainty when we started to get further away in time from the fire.”
The methods used to create the USGS maps, however, historically relied on a snapshot of the burned area taken just after the fire, and the maps weren’t updated to reflect conditions as vegetation grew back and began holding soil in place again.
That led to situations where public safety decisions were made on the basis of outdated maps and rainfall thresholds. For example, concern over debris flows after the 2020 Grizzly Creek Fire in Colorado led to several closures of Interstate 70 in 2022, but the debris flows never happened.
“What [the original assessments] didn’t capture is how the vegetation came back,” Graber said. “That left us with some uncertainty when we started to get further away in time from the fire.”
Intense rainfall in July 2025 triggered a debris flow near Dayton, Wyo., in the 2024 Elk Fire burn area. Credit: USGS, Public Domain
To test an improved method for these hazard assessments, Graber and the research team incorporated satellite imagery of 12 burned areas that showed the degree of vegetation recovery right after the fire, 1 year after the fire, and 2 years after the fire. Then, they tested their new method by comparing its predictions to rainfall and debris flow data from the 12 burned areas.
The updated method better reflected what had actually happened after the fires, reducing the number of unnecessary warnings without missing real-world debris flows.
Risk Recalibration
The USGS plans to begin using their new workflow to create hazard maps for some higher-profile fires during the coming wildfire season.
“It’s a really important question: Are we still worried about this burn scar?”
That’s exciting for Calhoun. As part of her job, she’s in constant contact with emergency managers who periodically ask how worried they should be about debris flows in areas that burned years ago. “It’s a really important question: Are we still worried about this burn scar?” she said.
Right now, Calhoun has no data to point to in the years after a fire to give an updated answer to that question. Using the new method from Graber and the research team, she will.
“Because they’re using satellite [imagery] and repeatable quantitative methods to look at these burn scars over time, we’ll actually be able to say something useful and informed about vegetation recovery,” she said.
Having a deeper understanding of how debris flow risk evolves over time is especially important because debris flows themselves are becoming a greater risk to the public as a result of increasingly intense wildfires and rainstorms. In addition, more accurate assessments can reduce warning fatigue, which occurs when too many false alarms lead to people ignoring or opting out of alerts.
Graber hopes he and the USGS will continue to improve their methods for assessing debris flow hazards by collecting more debris flow data across the country and improving the underlying equation for hazard assessments so that it better reflects the unique conditions of different ecosystems in the United States. USGS researchers also published a new study in March presenting a method to generate maps of where debris flows might travel if they do occur.
“It’s a big year for USGS’s useful postfire products,” Calhoun said.
This news article is included in our ENGAGE resource for educators seeking science news for their classroom lessons. Browse all ENGAGE articles, and share with your fellow educators how you integrated the article into an activity in the comments section below.
Citation: van Deelen, G. (2026), A new approach can better predict debris flow hazards years after fires, Eos, 107, https://doi.org/10.1029/2026EO260160. Published on 19 May 2026.
A new study (Vega et al. 2026) shows that patterns of reported structural damage in Medellin are probably caused by deep-seated deformation driven by a series of ancient landslides under the city.
Medellin is the second largest metropolitan area in Colombia, with a population of around 4 million people. It has grown rapidly, expanding into the surrounding hillsides, with many unplanned and informal communities on steep slopes. Landslides are a common problem.
The rapid rate of growth
A new study (Vega et al. 2026) shows that patterns of reported structural damage in Medellin are probably caused by deep-seated deformation driven by a series of ancient landslides under the city.
Medellin is the second largest metropolitan area in Colombia, with a population of around 4 million people. It has grown rapidly, expanding into the surrounding hillsides, with many unplanned and informal communities on steep slopes. Landslides are a common problem.
The rapid rate of growth has been accompanied with many reports of structural failures in buildings, with a general (and not unreasonable) assumption that these are associated with poor construction quality. But a fascinating new study (Vega et al. 2026) in the journal Landslides challenges this assumption in a most interesting way. The headline from the study is that there is a strong correlation between areas that have a high density of reports of structural damage and ground deformation driven by large, deep-seated landslides.
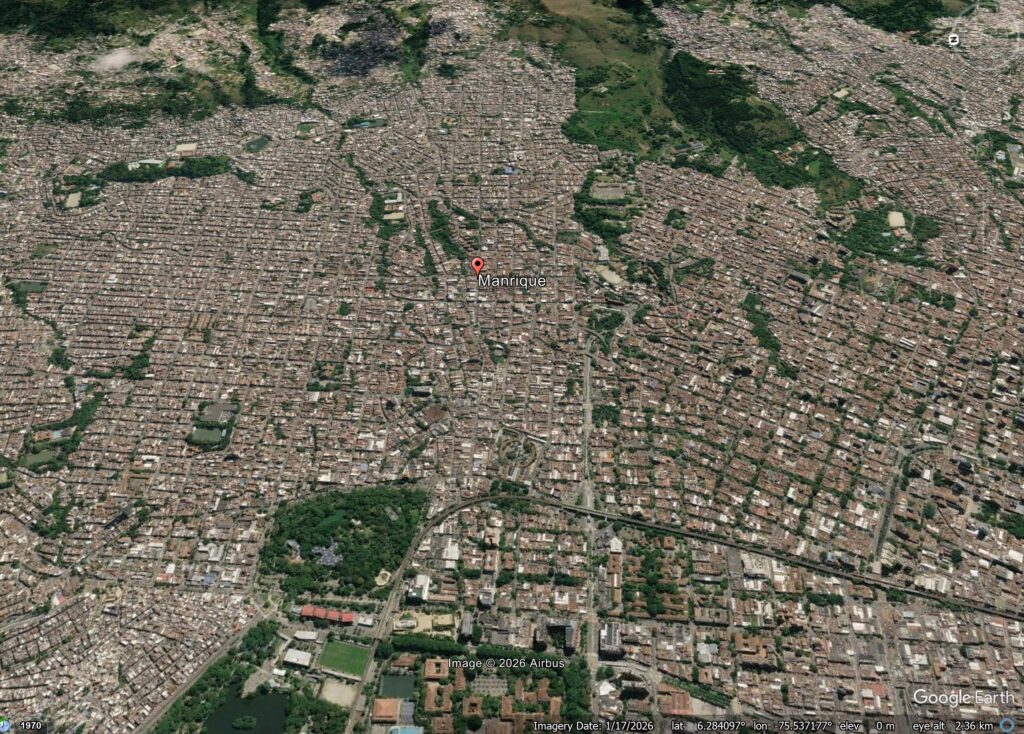
Vega et al. (2026) have used InSAR to map ongoing displacements across Medellin. In three key areas (Doce de Octubre, Manrique and Villa Hermosa) they detected high rates of ground deformation. They were able to show that these areas correspond to mappable deep-seated landslides. An example is in the Manrique neighbourhood of Medellin:-
Google Earth image of the Manrique neighbourhood of Medellin in Colombia.
Interpretation of pre-urbanisation imagery suggests that the topography underlying Manrique includes a series of deep-seated landslides. The InSAR data indicate that these areas are actively deforming, and these deformation zones correspond to areas with a high density of reports of structural damage. Interestingly, the density of damage reports does not correlate with the style of construction of the buildings.
Vega et al. (2026) also note that many of the recent acute landslide events in recent years also lie within these areas of high underlying ground deformation. Fore example, the 24 June 2025 landslide that killed 27 people lies within an area highlighted by the InSAR analysis.
This study highlights two key things for me. First, it is a novel and interesting application of InSAR in an urban setting, allowing the underlying processes that are driving structural damage in the city to be understood. Second, the study highlights the underlying vulnerability of Medellin to deep-seated slope processes. As the climate continues to change, and human processes modify the landscape and the groundwater, management of these slopes would seem to be a high priority.
On 19 July 2025, intense, long duration rainfall triggered over 550 landslides in Sancheong, South Korea, killing at least 10 people.
On 19 July 2025, extremely heavy rainfall triggered multiple landslides in Sancheong, South Korea. This event has been described by a new paper (Nguyen et al. 2026) just published in the journal Landslides. The paper is behind a paywall, but this link should give you access at the time of writing.
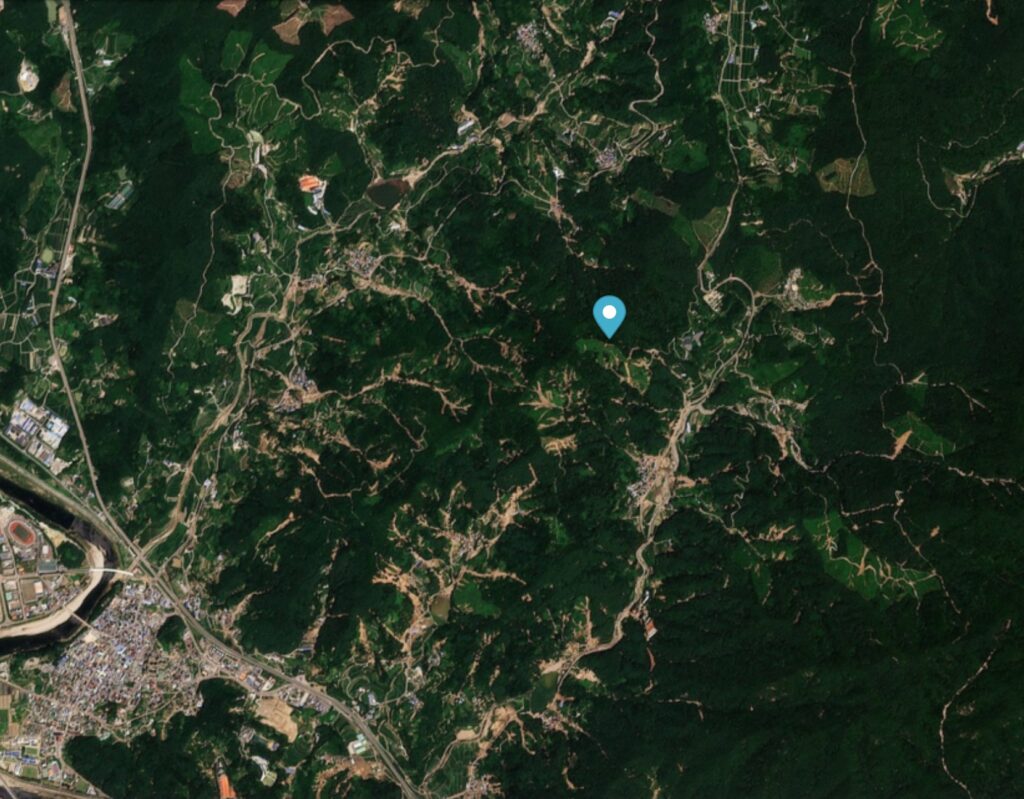
The core of the affected area is at [35.4333, 127.9111]
The core of the affected area is at [35.4333, 127.9111] (as usual, Landslides provides the location in degrees minutes and seconds when digital degrees is so much more useful – a pet frustration of mine!). This is a Planet Labs image of a part of the area, captured before the event. The marker is at the coordinate noted above:-
Planet Labs image of a part of the area affected by landslides during heavy rainfall in Sancheong County, South Korea on 19 July 2025. Image copyright Planet Labs, used with permission. Image dated 10 July 2025.
And this is the same area after 19 July 2025:-
Planet Labs image of a part of the area affected by landslides during heavy rainfall in Sancheong County, South Korea on 19 July 2025. Image copyright Planet Labs, used with permission. Image dated 23 July 2025.
Nguyen et al. (2026) have mapped 568 individual landslides triggered by this rainfall event, triggered by rainfall in the range of 498 – 619 mm over a c. 55 hour period. These landslides killed at least 10 people and caused damage to homes and infrastructure. It is estimated that the restoration costs are in the order of US$800 million.
In common with many other events of this type, the landslides are mainly shallow, translational failures in soil or regolith on steeper slopes. As I have frequently noted, such terrain is very susceptible to unusually intense rainfall events, which often trigger a cluster of landslides in close proximity. These often merge to form channelised debris flows. Nguyen et al. (2026) note however that their modelling indicates that it was a combination of the intensity of the rainfall and its duration that led to these failures.
As rainfall intensities increase due to climate change, we are seeing increasing numbers of these landslide clusters. I greatly welcome studies such as Nguyen et al. (2026) , which allow us to build understanding in each case.
New evidence from the Natural Hazards Commission – Toka Tū Ake (NHC) shows that landslides are now New Zealand’s most costly natural hazard.
New Zealand is a country that is prone to a range of natural hazards. Located on a series of major fault systems, earthquakes cause high levels of loss. The country is also volcanically active, with occasional tragedies. Heavy rainfall brings floods.
To share the cost of these perils, following the 1942 Wairarapa earthquakes, the New Zealand go
New Zealand is a country that is prone to a range of natural hazards. Located on a series of major fault systems, earthquakes cause high levels of loss. The country is also volcanically active, with occasional tragedies. Heavy rainfall brings floods.
In the subsequent years, the EQC has evolved into the Natural Hazards Commission – Toka Tū Ake (NHC), with a purpose “to reduce the impact of natural hazards on people, property, and the community”. Essentially it operates as a financial pool, with home owners paying a levy on top of their insurance to generate the fund. In the event of a loss, the fund pays for the rebuild costs up to a cap (currently NZ$300,000); the remainder is then covered by the property’s insurance. Claims are funded directly from the pool, with reinsurance cover and ultimately a government guarantee in place to ensure that there are sufficient funds.
In reality, NHC does much more than this, acting to manage and settle claims, and to understand the range of hazards to which New Zealand is prone.
In the last few days, a range of media outlets in New Zealand have been reporting new data from NHC about losses from natural hazards in New Zealand. This is the headline from 1News:
“Landslides are New Zealand’s most expensive natural hazard – and new data reveals a sharp rise in damage claims and growing risks to homes, infrastructure and communities.”
In total, since 2021 NHC has received 13,000 landslide claims and has paid out NZ$322 million (US$191 million). New Zealand is seeing an abrupt increase in landslide losses, driven primarily by increasingly frequent high magnitude rainfall events. NHC is urging property owners to undertake preventative maintenance and to be aware of the limitations of EQC cover.
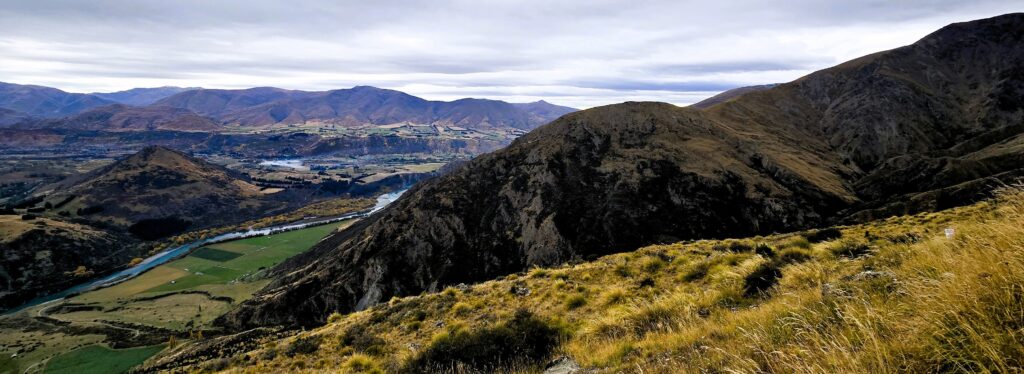
Here be landslides – typical landslide-prone terrain in New Zealand.
In common with many other places, these landslide hazards represent a major challenge to New Zealand. The landscape has many dormant landslides that are being reactivated by these increased rainfall events, and many new failures are also occurring. But, generating reliable risk maps for landslides remains a major challenge. This needs to be a major research focus in the coming years. It will require better understanding of triggering events (rainfall and earthquakes primarily); of the initiation processes within the slope; of runout / debris mobility; and of vulnerability and consequent losses. It is probably true to say that in all of these areas, landslide research lags behind that of earthquakes and floods, primarily because of a lack of long term investment.
In many countries, landslides are not an insured risk for this reason. On its own, this will be a major challenge that must be addressed. For those countries in which landslides are insured, we need quickly to get up to speed.
In April 2026 I recorded 36 fatal landslides causing 90 fatalities, the lowest monthly total for 2026 to date.
This is my regular update for the number of fatal global landslides, focusing on March 2026. As usual, this data has been collected in line with the methodology described in Froude and Petley (2018) and in Petley (2012). References are listed below – please cite these articles if you use this analysis. Data presented in these updates should be treated as being provisional at thi
In April 2026 I recorded 36 fatal landslides causing 90 fatalities, the lowest monthly total for 2026 to date.
This is my regular update for the number of fatal global landslides, focusing on March 2026. As usual, this data has been collected in line with the methodology described in Froude and Petley (2018) and in Petley (2012). References are listed below – please cite these articles if you use this analysis. Data presented in these updates should be treated as being provisional at this stage as I will reanalyse them prior to formal publication, and other events will emerge.
The headline figures are as follows:
March 2026: 36 fatal landslides causing 90 fatalities;
This is an interesting result, unusually showing that fatal landslides in April were substantially lower than for any of the preceding months in 2026. This is the updated annual chart by month:-
The number of global fatal landslides in 2026 by month to the end of April.
Loyal readers will know that I like to present the running total using pentads (five day blocks). This is the cumulative total pentad graph to the end of Pentad 24 (which captures all of the events to the end of April):-
The cumulative total number of global fatal landslides in 2026 by pentad to the end of April.
Thus, whilst April 2026 was unexceptional compared with the previous months of this year, the number of fatal landslides was still above the long term mean. Overall, 2026 continues to run extremely hot, exceeding even the record-breaking year of 2024.
We now start to enter the crucial period of much higher global fatal landslide occurrence. Whilst in the long term dataset this acceleration typically occurs in June (or even July), in recent years it has happened in May, as the 2024 line shows. I will watch with great interest to see what happens this month.
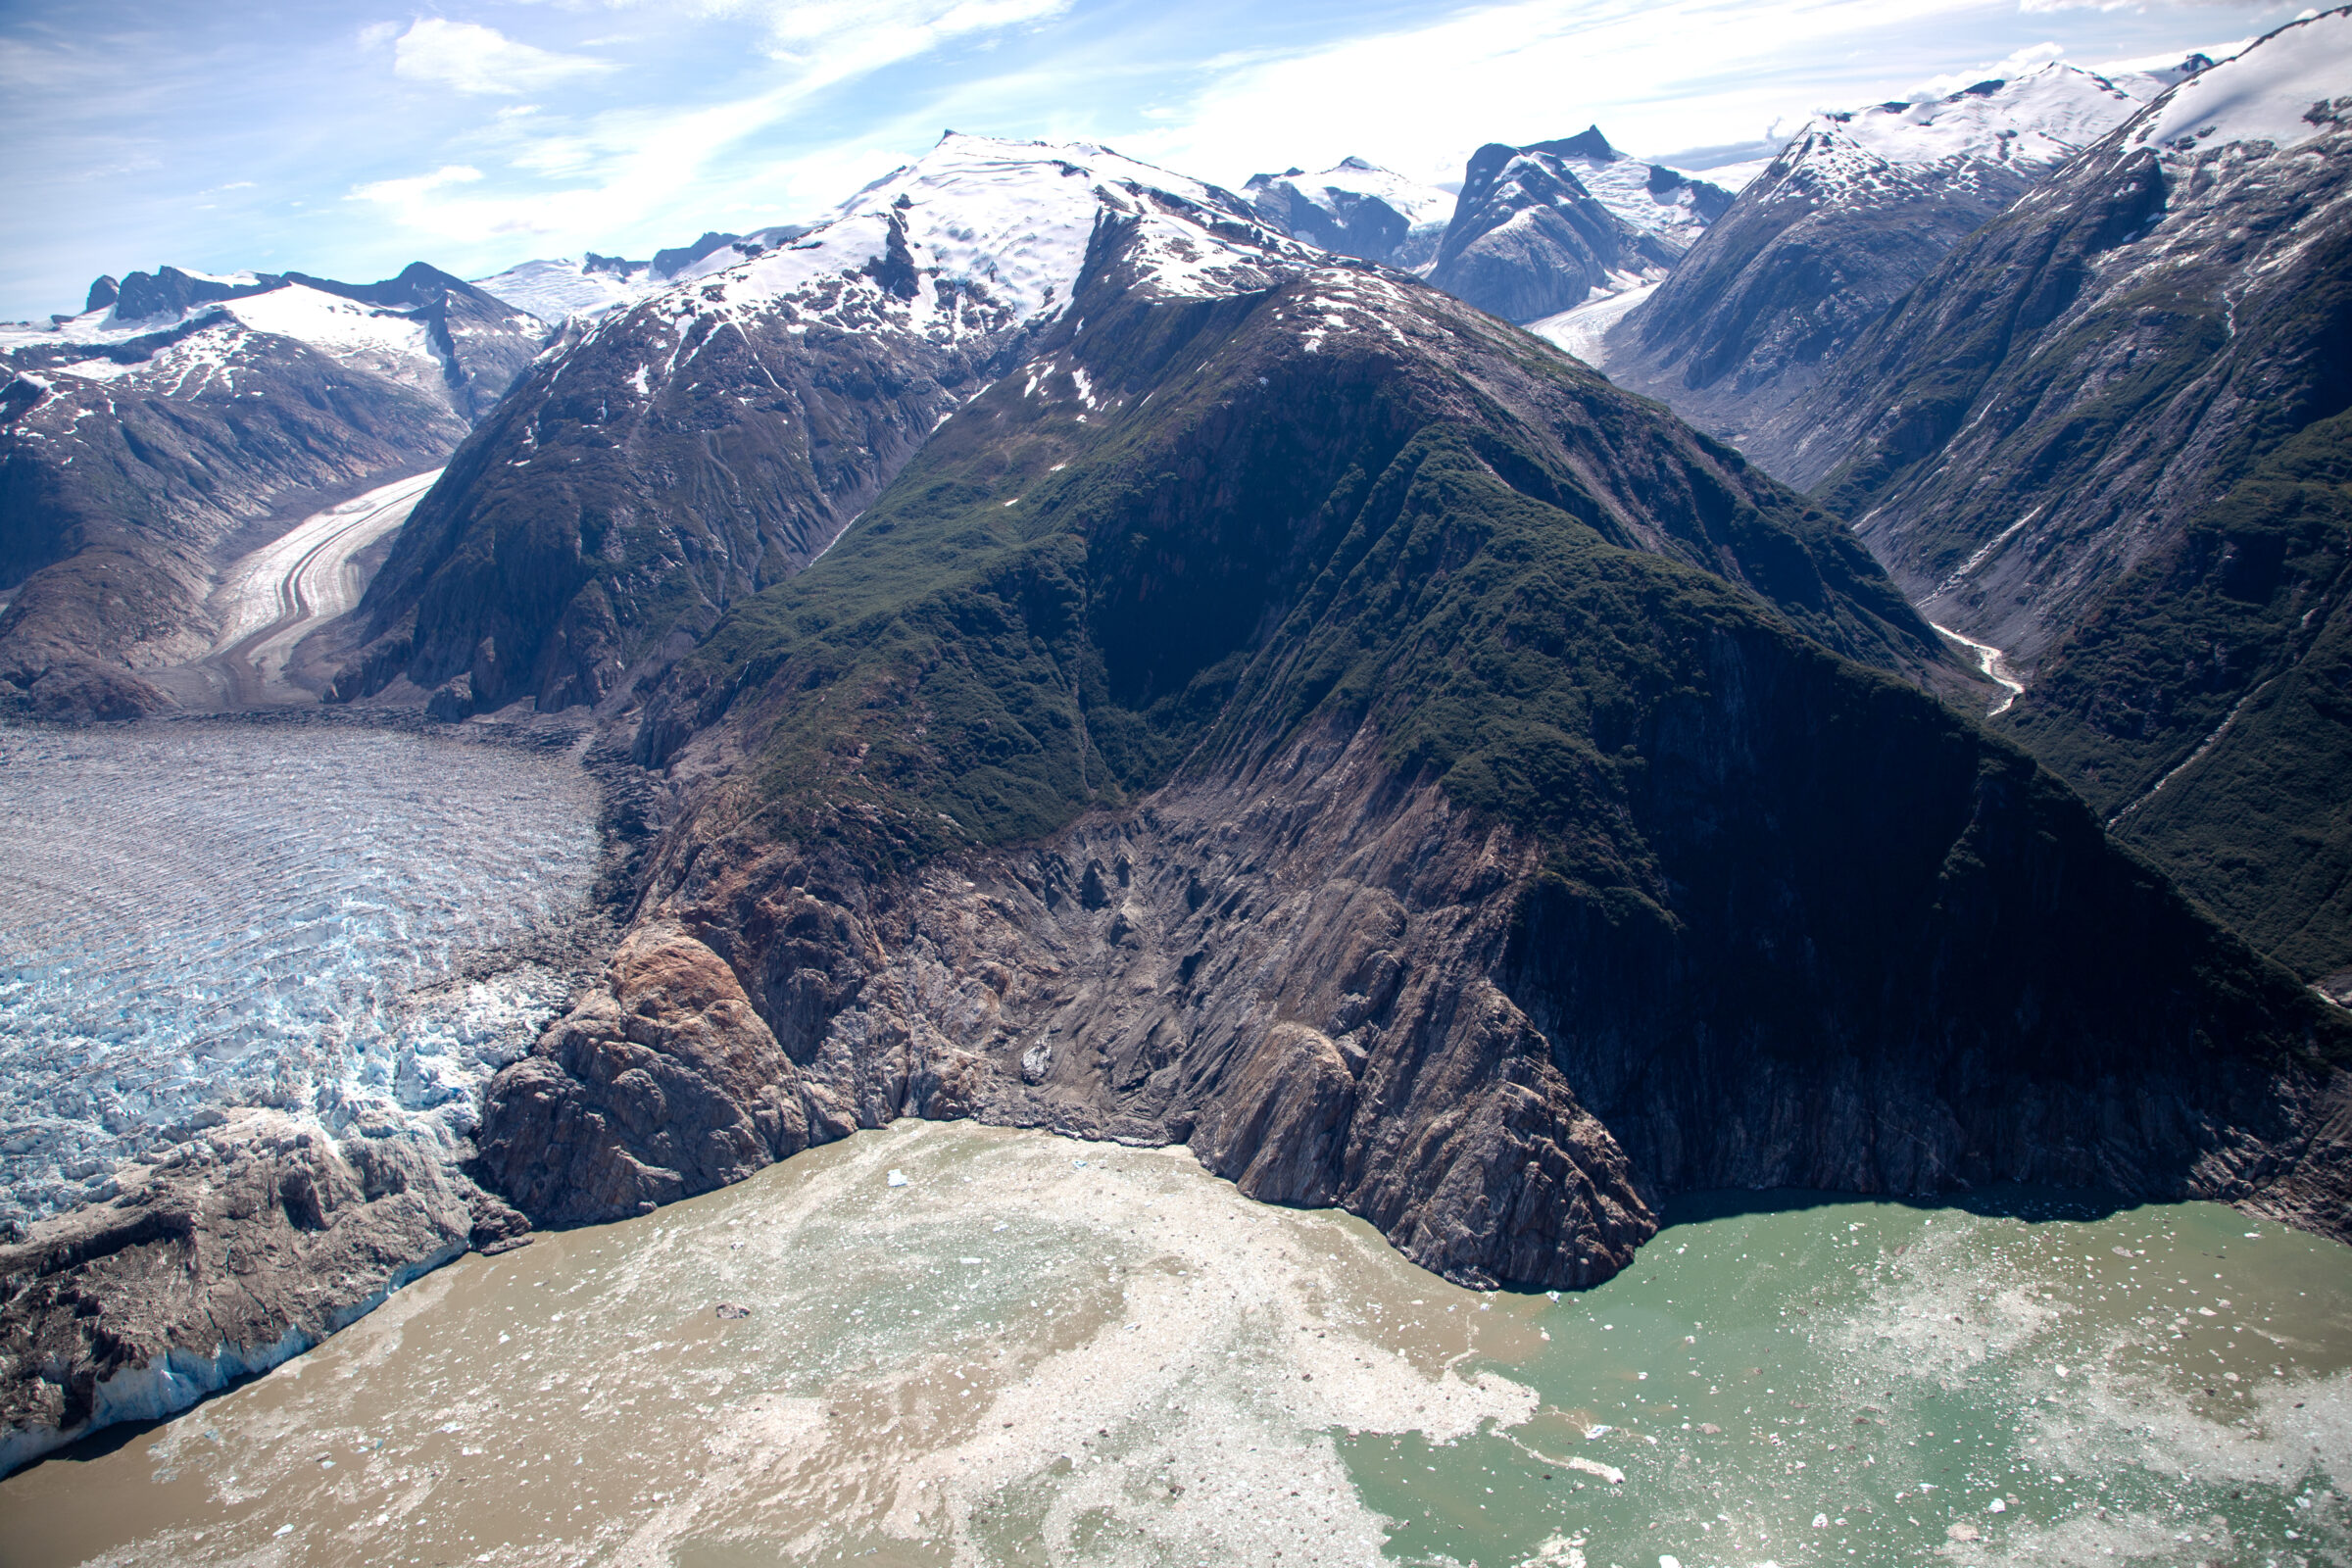
As glaciers retreat in warming regions, the risk of related hazards can increase, and improved monitoring may help reduce some of those dangers, according to a new study.
As glaciers retreat in warming regions, the risk of related hazards can increase, and improved monitoring may help reduce some of those dangers, according to a new study.