Source: Community Science
Heat, air pollution, and flooding can affect a city and the health of city residents. Yet few cities have a comprehensive network of weather stations providing accurate measurements of rainfall, humidity, and air temperature across different neighborhoods. Some of this information can be filled in by community members’ personal weather stations, like those connected through Weather Underground. But because of a lack of sensors and inconsistencies in data collection,
Heat, air pollution, and flooding can affect a city and the health of city residents. Yet few cities have a comprehensive network of weather stations providing accurate measurements of rainfall, humidity, and air temperature across different neighborhoods. Some of this information can be filled in by community members’ personal weather stations, like those connected through Weather Underground. But because of a lack of sensors and inconsistencies in data collection, these types of community networks are often not reliable on their own. Furthermore, most personal weather stations are located in higher-income neighborhoods, with very few in lower-income, underserved neighborhoods.
The same is true in Baltimore, where personal weather stations are more prevalent in higher-income, majority-white neighborhoods around and stretching north from the Inner Harbor but are lacking in lower-income and majority-Black neighborhoods to the west and east. Furthermore, only one National Weather Service sensor is present in the city itself, in the Inner Harbor, and another sensor is located about 12 kilometers (8 miles) away at Baltimore/Washington International Airport.
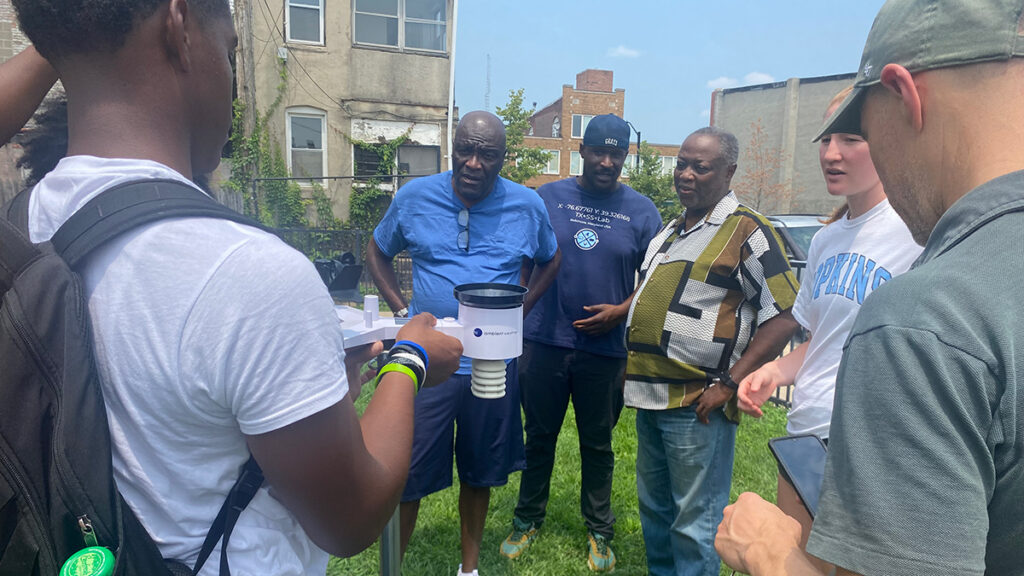
Waugh et al. describe a partnership between universities, state agencies, and Baltimore residents to build the Baltimore Community Weather Network (BCWN) that addresses the missing data coverage around the city. Unlike the patchwork of personal weather stations, community members participating in the BCWN are from underserved areas in the city and are actively involved in data collection and interpretation.
Weather stations are placed in open spaces to avoid obstacles like buildings or trees affecting measurements of temperature, rainfall, or wind. This careful placement is designed to ensure that the data collected are as close as possible to the conditions experienced by actual residents.
BCWN sites are carefully monitored and managed by community members. Baltimore residents are actively involved in data collection, weather station management, and decisionmaking with scientists and local organizations to help promote engagement, education, and community empowerment.
Because Baltimore is not the only U.S. city that has historically lacked accurate weather data coverage, the BCWN system could be applied to other locations—or even used to monitor other environmental exposures, such as air pollution, the authors say. (Community Science, https://doi.org/10.1029/2025CSJ000154, 2026)
Citation: Owen, R. (2026), Fixing Baltimore’s unequal weather data coverage, Eos, 107, https://doi.org/10.1029/2026EO260108. Published on 13 April 2026.
Buying fireworks can feel stressful when the season is near. Prices go up fast, popular items sell out, and you are often left choosing from what is still available instead of what you actually want. Many buyers also worry about safety rules, storage, and whether they are getting real value for their money. These problems make it harder to plan a good show, especially if you wait until the last minute.
Some buyers avoid this pressure by shopping early. Retailers like Chicago Fireworks offer a
Buying fireworks can feel stressful when the season is near. Prices go up fast, popular items sell out, and you are often left choosing from what is still available instead of what you actually want. Many buyers also worry about safety rules, storage, and whether they are getting real value for their money. These problems make it harder to plan a good show, especially if you wait until the last minute.
Some buyers avoid this pressure by shopping early. Retailers like Chicago Fireworks offer a wide selection throughout the year, which gives customers more time to plan and compare options. This raises a simple question. Is buying fireworks during the off-season really worth it, or does it create new problems?
What Off-Season Fireworks Buying Really Means
Off-season buying refers to purchasing fireworks months before major holidays like the Fourth of July or New Year’s Eve. This often happens in late summer, fall, or early spring when demand is lower.
During this period, stores are less crowded, inventory is more stable, and pricing is usually not affected by holiday demand. Buyers are not rushed, which leads to better decisions. Instead of reacting to limited stock, you can build a planned selection that fits your space, budget, and show goals.
Price Advantages And Hidden Savings
One of the biggest reasons people buy early is price. Fireworks prices are heavily influenced by demand. As holidays get closer, costs increase due to higher traffic and limited stock.
Off-season buying often allows you to:
Lock in lower prices before seasonal markups
Take advantage of promotions or clearance items
Avoid premium pricing on high-demand products
There is also a hidden saving factor. When you are not rushed, you are less likely to overspend on items you do not need. Many last-minute buyers purchase extra products just to complete their show. Early buyers tend to stick to a plan, which helps control the total cost.
Better Product Availability And Selection Control
Another key benefit is product availability. During peak season, popular items like 500g cakes, assortments, and specialty effects sell out quickly.
Buying off-season gives you:
Access to the full inventory before it becomes limited
More time to compare similar products
A better chance of getting specific effects you want
This is especially important if you are planning a themed show or trying to match colors and timing. Waiting too long often forces you to compromise, which affects the overall experience.
Storage Responsibility And Safety Considerations
Buying early comes with one important responsibility. You need to store fireworks safely for a longer period of time.
Safe storage includes:
Keeping fireworks in a cool, dry place
Avoiding direct sunlight or heat exposure
Storing them away from flammable materials
Keeping them out of reach of children
Fireworks are designed to be stable, but poor storage conditions can affect performance. Moisture can damage fuses, while heat can weaken the structure of certain items. If you are not prepared to store fireworks properly, off-season buying may not be the best option.
Planning A More Structured Fireworks Show
One advantage that is often overlooked is better show planning. When you buy early, you have time to organize your fireworks instead of using them randomly.
This allows you to:
Arrange fireworks by duration and effect
Plan the sequence of your show
Balance loud and quiet moments
Match products to your available space
A well-planned show feels smoother and more engaging. Even with a smaller budget, proper timing and variety can create a stronger impact than a larger but unplanned setup.
Avoiding Last-Minute Supply Chain Issues
Fireworks are imported products, and supply chains can change. Delays, shipping costs, and regulations can affect what is available during peak season.
Off-season buying reduces the risk of:
Missing out due to delayed shipments
Paying higher prices due to limited stock
Settling for lower-quality alternatives
By purchasing early, you are working with what is already in stock instead of relying on incoming inventory that may or may not arrive on time.
When Off-Season Buying May Not Be Ideal
Despite the benefits, off-season buying is not always the right choice for everyone.
It may not work well if:
You do not have a safe storage space
You are unsure about your event plans
Local laws or usage dates might change
You prefer to see new product releases closer to the season
Some buyers like to wait for new arrivals or updated product lines. While early buying offers stability, it may limit access to newer items released closer to major holidays.
How To Maximize Value When Buying Early
If you decide to buy fireworks during the off-season, a few simple steps can help you get the most value.
Start with a clear plan. Know your budget, your space, and the type of show you want to create. This helps you avoid unnecessary purchases.
Focus on core items first. Cakes, assortments, and fountains often form the base of most shows. Once these are secured, you can add specialty items later if needed.
Check product details carefully. Look at duration, effect type, and performance level. This helps you build a balanced lineup instead of repeating similar effects.
Store everything properly. Use sealed containers if needed and keep products in a stable environment. Good storage protects your investment and ensures reliable performance.
Buy Early, Plan Better, And Stay In Control
Off-season fireworks buying can be a smart choice if you plan ahead and handle storage properly. It gives you lower prices, better selection, and more control over your show without the pressure of peak-season crowds.
For buyers who want reliable options year-round, Chicago Fireworks offers a wide range of products beyond the busy season. Shopping early helps you avoid last-minute stress and gives you time to plan your display with more care.
Buying ahead also lets you organize your setup, prepare safe storage, and make better decisions about what works for your space. With more time and fewer limits, you can build a smoother and more enjoyable fireworks experience.
Thirty years ago, the blockbuster movie Twister featured a group of academics putting themselves at risk by chasing tornadoes in the name of science. Although the Hollywood story entailed a surfeit of sensationalism, special effects, and unrealistic stereotypes, the movie got a few things right. Specifically, the scientists were trying to study tornadoes using a large number of spatially distributed, home-built, low-cost (and potentially sacrificial) sensors.
Today, we commonly refer to the
Thirty years ago, the blockbuster movie Twister featured a group of academics putting themselves at risk by chasing tornadoes in the name of science. Although the Hollywood story entailed a surfeit of sensationalism, special effects, and unrealistic stereotypes, the movie got a few things right. Specifically, the scientists were trying to study tornadoes using a large number of spatially distributed, home-built, low-cost (and potentially sacrificial) sensors.
Today, we commonly refer to the coordinated use of tens to hundreds of similar sensors that are spread out as “large-N” sensing. Such sensor distributions have led to important advances in seismology and infrasound science, where they have improved our understanding of seismic ground motion and helped shed light on volcanic eruption dynamics [e.g., Rosenblatt et al., 2022; Anderson et al., 2023].
The benefits of large-N networks and arrays include robust spatial sampling and signal extraction from noise. They are also advantageous for detecting small signals, sensing natural hazards in remote environments, and offering critical redundancies for sensors at risk from lava or debris flows, wildfire, weather, or even malicious mammals.
Since 2013, our research group in the Department of Geosciences at Boise State University (BSU) has worked to study infrasound from geophysical phenomena by capitalizing on the benefits of low-cost, large-N sensing technology [e.g., Slad and Merchant, 2021]. More than a decade on, this effort has yielded scientific successes from a variety of environments, and it is continuing to evolve.
Large-N Sensing for Infrasound
Many violent natural processes, including landslides, volcanic eruptions, earthquakes, avalanches, and meteors, produce infrasound.
Many violent natural processes, including landslides, volcanic eruptions, earthquakes, avalanches, and meteors, produce infrasound, defined as low-frequency sound below the threshold of human hearing (less than 20 Hertz). Such events may create audible sound as well, but the subaudible band is often much more energetic in terms of sound intensity, and it has long wavelengths that can propagate long distances with little attenuation. These characteristics make infrasound especially valuable for remote sensing of natural phenomena.
Our group at BSU grew more interested in developing our own inexpensive infrasound sensing solutions after costing out technology for commercial data logging systems, the compact electronic devices that record and store sensor data. These systems can be far more expensive than infrasound transducers—the sensors that actually detect sound—themselves.
The cost element became particularly relevant after we lost instrumentation deployed at the summit of Chile’s Villarrica volcano when it erupted a 2-kilometer-tall lava fountain on 3 March 2015 [Johnson et al., 2018]. In an instant, our hardware, including seismic and infrasonic sensors and their commercial multichannel data loggers, was entombed beneath falling lava. This financial loss incentivized our work to develop low-cost loggers that would match the technical specifications and fidelity of commercial systems.
The result was the customized Gem infrasound logger, which we created using the widely available and very economical Arduino open-source electronic prototyping platform and its low–power consumption microcontroller. The Gem is an all-in-one infrasound sensor and data logger with a high dynamic range (millipascals to 100 pascals), a 100-hertz sample rate appropriate for infrasound, and a built-in GPS for precise timing and synchronization [Anderson et al., 2018].
Although we initially conceived of the Gem as an alternative to commercial loggers to be deployed as single stations or in small arrays, we quickly realized its potential for use in high-density distributed sensing arrays that enabled new detection capabilities. In particular, its small package size (it has about the dimensions and weight of a paperback novel) and its ease of deployment—simply insert alkaline batteries, place it on the ground, and turn it on—have opened opportunities for rapid, large-N deployments in difficult-to-access environments.
Early Successes for the Gem
Volcán Villarrica, near Pucon, Chile, is seen in 2025 (left). The volcano regularly releases gas from a small lava lake recessed deep within the summit crater (right). Credit: Jeffrey B. Johnson
The Gem’s inaugural field mission came in January 2020 during a return to Villarrica, where activity had returned to normal following its 2015 paroxysmal eruption [Rosenblatt et al., 2022]. Typical activity in the volcano’s normal state includes open-vent degassing from a small lava lake recessed deep within the summit crater, which produces its famously powerful volcano infrasound [e.g., Johnson et al., 2012].
To capture Villarrica’s infrasound in detail, a four-person team from BSU climbed the 3,000-meter-tall glaciated volcano and quickly installed 16 sensors around the crater rim, as well as another 16 sensors along an 8-kilometer linear transect from the summit down the northern slope (Figure 1). This unique sensor distribution permitted us to capture the infrasound wavefield and how it interacts with topography in unprecedented detail.
Fig. 1. (a) Oblique and (b) plan views of Villarica’s summit region were created from structure-from-motion surveys in 2020. Red triangles and circles indicate locations of Gem sensing packages. (c) Also in 2020, Jake Anderson adjusts a cable suspended across the volcano’s crater that held a Gem sensor (circled). (d) In 2025, Jerry Mock unloads Gem systems at Villarica’s summit during another data collection campaign there. Click image for larger version. Credit: Jeffrey B. Johnson
Deploying such an array configuration using much heavier, larger, and power-intensive conventional instruments would have taken far more time and resources, as well as a bigger group. With the Gems, however, the installation was feasible for our small team, each member of which could easily carry eight instruments and the batteries needed to power them.
To monitor volcanoes with infrasound, it is necessary to understand the influence of atmospheric effects.
Once in place, these sensors collected continuous data during the 2-week study that were used to quantify the diffraction of sound coming out of the volcanic crater [Rosenblatt et al., 2022] and to measure the sound’s attenuation as it propagated away. Such studies are important for investigating time-varying atmospheric parameters such as changing temperatures and winds, which can affect infrasound transmission, diminishing its amplitude or even—in extreme cases—completely silencing it in an acoustic shadow zone [Johnson et al., 2012]. To monitor volcanoes with infrasound, it is necessary to understand the influence of atmospheric effects.
Months later, another opportunity arose to demonstrate the Gems’ capability for large-N infrasound sensing. During the early days of the COVID-19 pandemic, on 31 March 2020, a magnitude 6.5 earthquake occurred near Stanley, Idaho. The earthquake, the largest in the state since 1983, kicked off an energetic aftershock sequence, with more than 700 magnitude 3 or greater earthquakes occurring in 6 months. Most of these events produced significant local infrasound radiation, or “airquakes,” caused by ground-atmosphere coupling [e.g., Johnson et al., 2020].
Pandemic-related precautions inhibited a large team from venturing as a group into the field. However, a lone BSU researcher (coauthor Jacob Anderson), trudging through forest terrain and deep snow on skis, was able to deploy and activate 22 Gems in less than 4 hours in early April, thanks in part to the sensors’ compact size and ease of deployment.
This array captured hundreds of local infrasonic aftershocks within about 25 kilometers of their epicenters. It also recorded a far larger event 700 kilometers away, the 15 May magnitude 6.5 Monte Cristo earthquake in Nevada. The array detected the epicentral infrasound from the distant earthquake source, as well as infrasound from numerous secondary sources, including mountain ranges throughout the western United States that reradiated the ground motion as infrasound (Figure 2) [Anderson et al., 2023].
Fig. 2. This map shows source region(s) of infrasound associated with the May 2020 Monte Cristo earthquake in Nevada that was detected by an array of Gem infrasound sensors deployed at the PARK site near Stanley, Idaho. Click image for larger version. Credit: Adapted from Anderson et al. [2023], CC BY 4.0
Detecting all these distinct signals was possible because of the enhanced array processing capabilities provided by the large number of sensors. Anderson et al. [2023] showed that when the data were processed from 3-sensor subsets of the 20+-sensor array—instead of from the whole array—it was possible to detect only the most intense earthquake infrasound arrivals. In other words, the larger array had much greater fidelity and sensing capabilities than smaller distributions of sensors.
During its 2-month deployment, the Stanley array also detected sounds from other distant nonearthquake sources, including waterfalls 195 kilometers away and thunder more than 900 kilometers away [Scamfer and Anderson, 2023]. Such enhanced detections, facilitated by large-N sensing, demonstrate an improved capacity to monitor a range of Earth phenomena continuously over a wide range of distances.
Putting Sensors in Harm’s Way
Since those proof-of-concept deployments, Gems have been used to monitor snow avalanches, lahars, river flow discharge, stratospheric sounds (while mounted aboard a solar balloon), and numerous volcanoes during field experiments [e.g., Tatum et al., 2023; Bosa et al., 2024; Rosenblatt et al., 2022; Brissaud et al., 2021]. Given their ease of use, small size, and low replacement cost, they’ve also been tested in hazardous environments where the risk to more expensive hardware could be considered unreasonable.
The motivation to put sensors in harm’s way is to gain insight into geophysical phenomena by recording subtle signals close to the source that may not be detectable from farther away.
The motivation to put sensors in harm’s way is to gain insight into geophysical phenomena by recording subtle signals close to the source that may not be detectable from farther away. For example, at Villarrica, Rosenblatt et al. [2022] suspended a Gem on a cable 100 meters above a lava lake to collect infrasound data from a unique, bird’s-eye perspective over the crater (Figure 1c). (Stringing the cable across the crater proved far more challenging than deploying the sensor itself, which slid down the cable until finding its resting place at the bottom of the cable’s arc.)
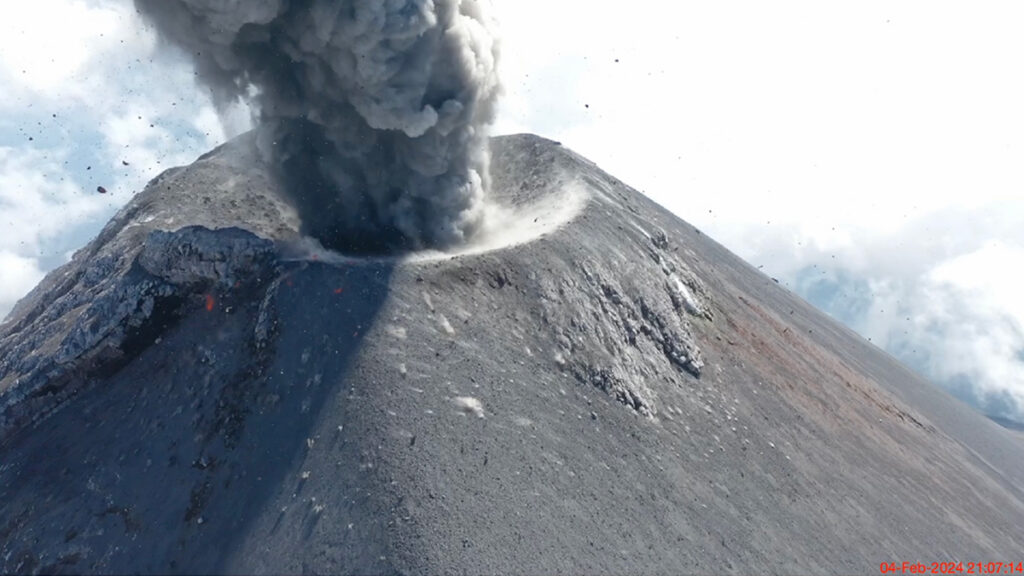
In another case, we landed a pair of Gems on the ground near a frequently exploding crater at Fuego volcano in Guatemala using a drone (see video below). We later retrieved one of the sensors from high on the volcano’s flanks. Another was lost because high winds initially posed too great a risk to fly the drone back for it. Then the following day after the wind subsided, we could not locate the stranded Gem, which was probably a casualty of a nighttime explosion.
Drone footage and infrasound recordings were collected during an explosion of Fuego volcano on 4 February 2024. Pa = pascals. Credit: video: Jerry C. Mock; animation and infrasound: Jeffrey B. Johnson
Our group at BSU also has nascent interest in using Gems to study fire in natural environments. Wildfires produce infrasound from a spatially extensive source region corresponding to actively burning areas. Because of the source complexity and the fact that fire infrasound is low amplitude and tremor-like [Johnson et al., 2025], enhancing signal-to-noise ratios in recorded infrasound is critical. This enhancement is enabled by using large-N monitoring networks, making infrasound wildfire surveillance a promising area of investigation.
Low-cost, rapid infrasound deployments could one day be used as an effective operational tool.
Toward this objective, our group installed 76 sensors ahead of a prescribed burn in Reynolds Creek, Idaho, in October 2023 to begin developing infrasound as a tool for monitoring and mapping wildfire. We have also deployed Gems for infrasound studies of naturally occurring wildfires, such as the Emigrant wildfire in Oregon in August and September 2025 (Figure 3). During that active wildfire response, a team safely and quickly installed tens of sensors within a matter of hours in an area facing dynamic hazards from the rapidly expanding fire, which eventually covered 33,000 acres (about 13,354 hectares). Luckily, no instruments were lost, and the data have shown the potential to track a wildfire as it advances.
Preliminary results suggest that low-cost, rapid infrasound deployments could one day be used as an effective operational tool. For example, in firefighting responses, infrasound might complement intermittent aerial observations, from aircraft or drones, because it provides a continuous record of fire activity. Infrasound surveillance might also be able to “hear” combustion sources within a burn area that is obscured to optical sensing because of clouds or nightfall.
Fig. 3. (a) The spread and severity of the 2025 Emigrant Fire in Oregon, as calculated from prefire (21 August) and postfire (18 October) Sentinel-2 satellite images, are shown. Inset maps show the distribution of 37 Gem sensors rapidly deployed in three arrays. (b) Smoke from the fire rises from the landscape on 31 August during deployment of the sensors. (c) Following the fire, one sensor that had been melted by the fire was recovered with its data card still intact (red circle). dNBR = differenced normalized burn ratio. Click image for larger version. Credit: (a) and (b): Madeline A. Hunt; (c): Jacob F. Anderson
The Evolution of Low-Cost Sensors
Five years ago, the single-sensor Gem was a cutting-edge infrasound logging solution. While it remains a powerful and economical tool for large-N arrays and for sensing in hostile environments, it is evolving.
Boise State University researchers (left to right) Madeline Hunt, Owen Walsh, Jerry Mock, and Jacob Anderson prepare to deploy Gem sensors in Idaho’s Sawtooth Mountains in January 2024. Credit: Jeffrey B. Johnson
We have now developed the Gem into an even more versatile version called the Aspen, which can log four independent sensors at a sample rate of 200 hertz, double that of the Gem. The Aspen retains the small size, low weight, low power consumption, and low cost of the Gem, but with the capability to record higher-resolution 24-bit, time-synchronized data from a triaxial seismic sensor and an infrasound transducer.
Recording synchronous seismoinfrasonic data on the same logging platform offers the advantage of sensing both ground shaking and infrasonic oscillations. The ability to measure waves propagating in the ground and in the air simultaneously could facilitate work in the growing field of environmental seismology, which focuses on geophysical sources at Earth’s surface like debris flows and volcanoes.
Although we have focused on seismoacoustic geophysical measurements in our work, the concept of gathering data with low-cost instrumentation in harm’s way or from coordinated arrays of numerous sensors holds promise across Earth and environmental sciences. Such approaches could be used, for example, with tiltmeters (which measure slope changes), gravity meters, or near-infrared thermometers (e.g., optical pyrometers), all of which would offer additional data streams complementing seismoacoustic observations in geophysical studies of volcanoes.
With the diversity of emerging uses, it’s clear that large-N sensing—infeasible or cost prohibitive in many cases until recently—could transform how we measure many facets of Earth, helping to reveal the inner workings of volatile volcanoes, twisting tornadoes, and more.
Acknowledgments
More information about low-cost infrasound sensing solutions can be found at https://sites.google.com/boisestate.edu/infravolc/home. Development of the Gem infrasound logging platform was supported by a grant from the National Science Foundation (EAR-2122188).
References
Anderson, J. F., et al. (2018), The Gem infrasound logger and custom‐built instrumentation, Seismol. Res. Lett., 89(1), 153–164, https://doi.org/10.1785/0220170067.
Anderson, J. F., et al. (2023), Remotely imaging seismic ground shaking via large-N infrasound beamforming, Commun. Earth Environ., 4(1), 399, https://doi.org/10.1038/s43247-023-01058-z.
Bosa, A. R., et al. (2024), Dynamics of rain-triggered lahars and destructive power inferred from seismo-acoustic arrays and time-lapse camera correlation at Volcán de Fuego, Guatemala, Nat. Hazards, 121, 3,431–3,472, https://doi.org/10.1007/s11069-024-06926-1.
Brissaud, Q., et al. (2021), The first detection of an earthquake from a balloon using its acoustic signature, Geophys. Res. Lett., 48, e2021GL093013, https://doi.org/10.1029/2021GL093013.
Johnson, J. B., et al. (2012), Probing local wind and temperature structure using infrasound from Volcan Villarrica (Chile), J. Geophys. Res., 117, D17107, https://doi.org/10.1029/2012JD017694.
Johnson, J. B., et al. (2018), Forecasting the eruption of an open-vent volcano using resonant infrasound tones, Geophys. Res. Lett., 45, 2,213–2,220, https://doi.org/10.1002/2017GL076506.
Johnson, J. B., et al. (2020), Mapping the sources of proximal earthquake infrasound, Geophys. Res. Lett., 47, e2020GL091421 , https://doi.org/10.1029/2020GL091421.
Rosenblatt, B. B., et al. (2022), Controls on the frequency content of near-source infrasound at open-vent volcanoes: A case study from Volcán Villarrica, Chile, Bull. Volcanol., 84(12), 103, https://doi.org/10.1007/s00445-022-01607-y.
Scamfer, L. T., and J. F. Anderson (2023), Exploring background noise with a large‐N infrasound array: Waterfalls, thunderstorms, and earthquakes, Geophys. Res. Lett., 50, e2023GL104635, https://doi.org/10.1029/2023GL104635.
Slad, G., and B. Merchant (2021), Evaluation of Low Cost Infrasound Sensor Packages, Sandia Rep. SAND2021-13632, Sandia Natl. Lab., Albuquerque, N.M., https://doi.org/10.2172/1829264.
Tatum, T., J. F. Anderson, and T. J. Ronan (2023), Whitewater sound dependence on discharge and wave configuration at an adjustable wave feature, Water Resour. Res., 59, e2023WR034554, https://doi.org/10.1029/2023WR034554.
Author Information
Jeffrey B. Johnson (jeffreybjohnson@boisestate.edu), Jacob F. Anderson, Madeline A. Hunt, Owen A. Walsh, and Jerry C. Mock, Department of Geosciences, Boise State University, Idaho
Citation: Johnson, J. B., J. F. Anderson, M. A. Hunt, O. A. Walsh, and J. C. Mock (2026), Sensing the sounds from Earth’s hazardous environments, Eos, 107, https://doi.org/10.1029/2026EO260142. Published on 8 May 2026.
Since 1989, Utah’s Great Salt Lake has lost some 70% of its surface area, reducing its ecosystem services and creating stretches of drying lake bed (playa) that send toxic dust into the air.
That drying ground has also provided opportunities for scientists to survey what lies below the lake’s floor. In a study published in Geosciences, researchers revealed glimpses of fresh water and salt water, with some fresh water lurking only a few meters below the surface. The work could provide clues f
Since 1989, Utah’s Great Salt Lake has lost some 70% of its surface area, reducing its ecosystem services and creating stretches of drying lake bed (playa) that send toxic dust into the air.
That drying ground has also provided opportunities for scientists to survey what lies below the lake’s floor. In a study published in Geosciences, researchers revealed glimpses of fresh water and salt water, with some fresh water lurking only a few meters below the surface. The work could provide clues for conserving the lake, a crucial resource for both the ecology and the economy of the region.
Salt Lake, Fresh Water
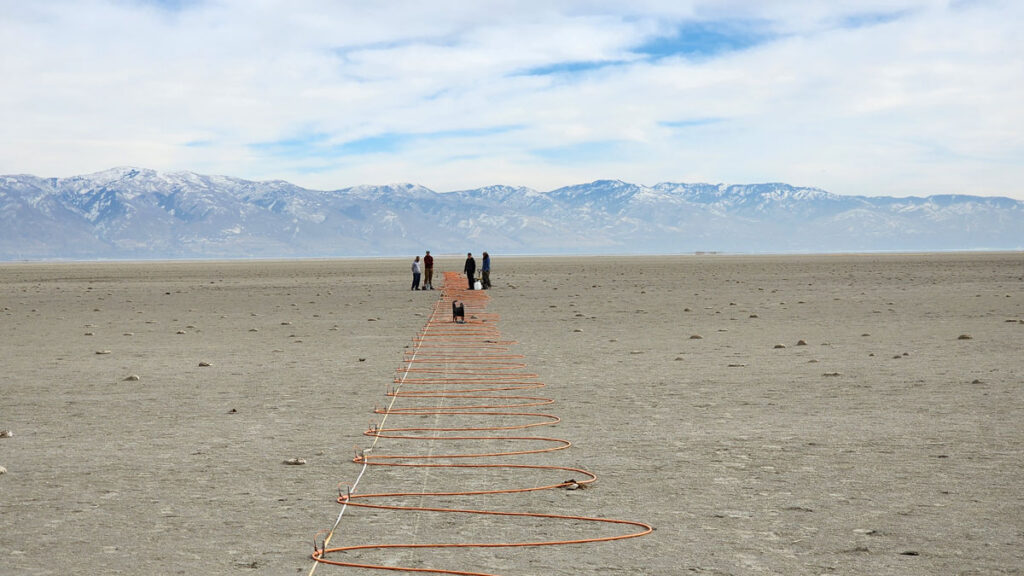
In 2023, Michael Thorne and colleagues began using a technique known as electrical resistivity tomography (ERT), which can reveal the presence of fresh or salty water, at dozens of spots near the southern and eastern edges of the Great Salt Lake. Thorne is a geophysicist at the University of Utah in Salt Lake City and a coauthor of the new study.
The lake’s desiccation allowed the researchers to access areas where “at previous times, you would never be able to do measurements because [they] would be underwater,” said Thorne.
Establishing a network of ERT sensors requires robust fieldwork. Over the course of long days in the field, Mason Jacketta, lead author of the new study, and others placed electrodes into the ground a few meters apart, making lines that stretched hundreds of meters. Between pairs of electrodes, they measured the resistance to electrical current. Salty water, filled with electricity-conducting ions, has lower resistance than fresh water.
Paired with information on the rock and sediment beneath the surface, as well as with measurements from nearby wells, the ERT data allowed the team to work out a profile of how electrical resistance varied with depth and to figure out what kind of water seeped through pores in the ground below. The team shared the results of their work on the southern part of the lake in Geosciences, while more in-depth findings about the eastern shore will appear in an upcoming publication.
“What this is really showing is that [fresh water is] prevalent all over the place.”
At many of the sites, Jacketta and others found fresh water near the surface.
“What this is really showing is that [fresh water is] prevalent all over the place,” said Elliot Jagniecki, a geologist at the Utah Geological Survey who wasn’t part of the work.
That fresh water was often in close proximity to patches of salty groundwater. At one spot in the southeastern part of the lake, the team found a shallow layer of brine. But right below that, at only 5 meters of depth, they encountered fresh water. At the team’s most northern study site, they found fresh water around 2 meters deep. On the southern shore, they found fresh water in some places as shallow as 2.8 meters.
Mysterious Formations
The team’s results also helped explain curious features around the Great Salt Lake, including mounds made of salt and islands made of reeds.
The lacy-looking layers of the lake’s so-called mirabilite mounds form in the winter, when the cold freezes upwelling salty water, concentrating its salts. With measurements taken next to where some mirabilite mounds form, the researchers could visualize the underground conduits that send salty water to the surface.
While mirabilite mounds form close to shore, mounds made of Phragmites reeds appear in the lake’s interior as well as along its periphery. Thorne and his colleague William Johnson first noticed these mysterious circles popping up in Google Maps more than a decade ago. When they went to investigate, they found Phragmites.
“The population of Phragmites around the Great Salt Lake is really not allowing fresh groundwater to go back into the Great Salt Lake.”
In the new work, the team placed a line for electrical resistivity tomography straight through a Phragmites mound. These reeds wouldn’t be able to survive in the lake’s briny water, Thorne said, but the team’s results showed fresh water rising right to where the invasive reeds grew thick.
“The population of Phragmites around the Great Salt Lake is really not allowing fresh groundwater to go back into the Great Salt Lake,” said study coauthor Tonie van Dam, a geophysicist at the University of Utah. The reeds suck up some 70,000 acre-feet of fresh water that could go back into the lake, she said. In “sucking up [fresh water] for their own existence,” van Dam explained, the reeds crowd out native plant species that provide habitat for native birds.
More Than a Beautiful Landscape
Overall, the study provides a new picture of the fresh and salty groundwater beneath the lake and how these resources feed what people observe at the surface.
It’s also helped to prompt other work, Thorne said, including one recent study in which researchers used a helicopter carrying a wire loop to create and sense electrical currents underground. That study, published in Scientific Reports, suggested there could be a large amount of fresh water under one part of the lake.
But that work is a proof of concept, Jagniecki said, and accessing such potential aquifers might not be sufficient to help address the lake’s current desiccation. Even if they could, refilling them could take thousands of years. “I just don’t think that’s a solution,” he said.
Saline lakes are fragile ecosystems sensitive to climate change, Jagniecki said. The Great Salt Lake harbors plenty of life, such as brine shrimp that become food for a host of migratory birds that use the lake as a stopover. Mineral extraction and the use of brine shrimp for feed in aquaculture are important drivers of Utah’s economy.
Getting a better understanding of how saline lake systems function could be helpful in conserving them and maintaining the resources they provide humans, Jagniecki explained.
“It’s actually more than that. It’s a beautiful landscape,” he said.
—Carolyn Wilke, Science Writer
Citation: Wilke, C. (2026), What’s below the Great Salt Lake? More water, Eos, 107, https://doi.org/10.1029/2026EO260127. Published on 21 April 2026.
The NYC Mid-Winter Climate Institute brought together K-12 educators to identify meaningful entry points for climate education lessons in their classrooms and beyond.
The NYC Mid-Winter Climate Institute brought together K-12 educators to identify meaningful entry points for climate education lessons in their classrooms and beyond.