On 19 July 2025, intense, long duration rainfall triggered over 550 landslides in Sancheong, South Korea, killing at least 10 people.
On 19 July 2025, extremely heavy rainfall triggered multiple landslides in Sancheong, South Korea. This event has been described by a new paper (Nguyen et al. 2026) just published in the journal Landslides. The paper is behind a paywall, but this link should give you access at the time of writing.
The core of the affected area is at [35.4333, 127.9111]
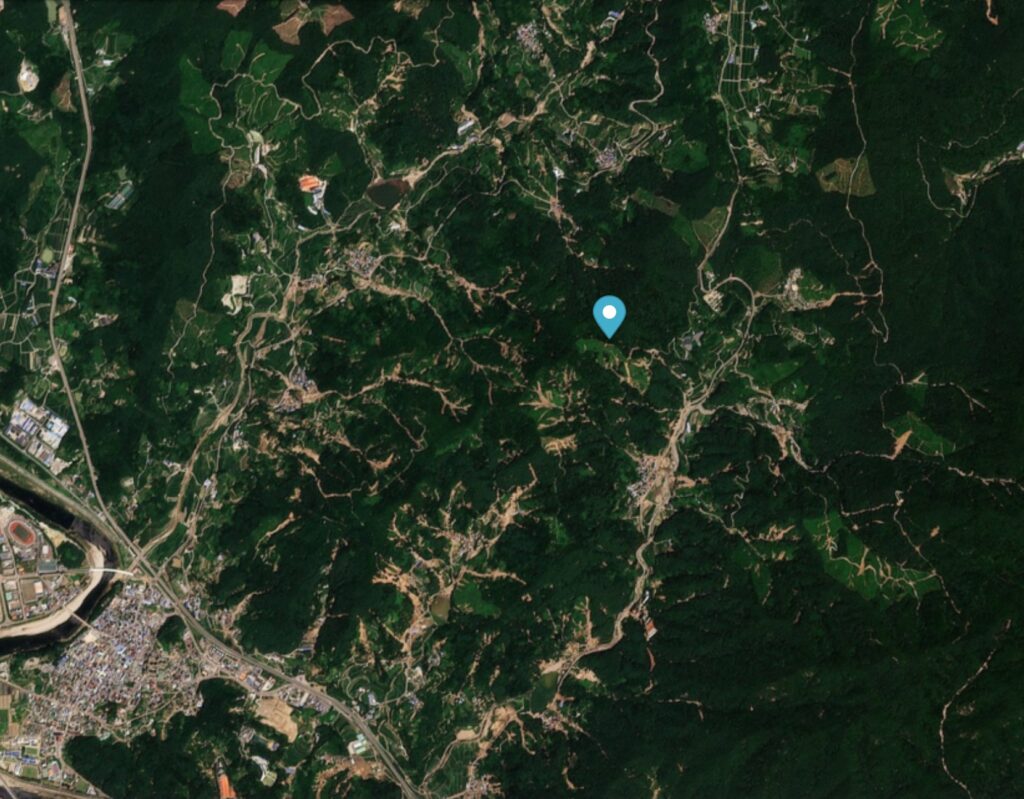
The core of the affected area is at [35.4333, 127.9111] (as usual, Landslides provides the location in degrees minutes and seconds when digital degrees is so much more useful – a pet frustration of mine!). This is a Planet Labs image of a part of the area, captured before the event. The marker is at the coordinate noted above:-
Planet Labs image of a part of the area affected by landslides during heavy rainfall in Sancheong County, South Korea on 19 July 2025. Image copyright Planet Labs, used with permission. Image dated 10 July 2025.
And this is the same area after 19 July 2025:-
Planet Labs image of a part of the area affected by landslides during heavy rainfall in Sancheong County, South Korea on 19 July 2025. Image copyright Planet Labs, used with permission. Image dated 23 July 2025.
Nguyen et al. (2026) have mapped 568 individual landslides triggered by this rainfall event, triggered by rainfall in the range of 498 – 619 mm over a c. 55 hour period. These landslides killed at least 10 people and caused damage to homes and infrastructure. It is estimated that the restoration costs are in the order of US$800 million.
In common with many other events of this type, the landslides are mainly shallow, translational failures in soil or regolith on steeper slopes. As I have frequently noted, such terrain is very susceptible to unusually intense rainfall events, which often trigger a cluster of landslides in close proximity. These often merge to form channelised debris flows. Nguyen et al. (2026) note however that their modelling indicates that it was a combination of the intensity of the rainfall and its duration that led to these failures.
As rainfall intensities increase due to climate change, we are seeing increasing numbers of these landslide clusters. I greatly welcome studies such as Nguyen et al. (2026) , which allow us to build understanding in each case.
New evidence from the Natural Hazards Commission – Toka Tū Ake (NHC) shows that landslides are now New Zealand’s most costly natural hazard.
New Zealand is a country that is prone to a range of natural hazards. Located on a series of major fault systems, earthquakes cause high levels of loss. The country is also volcanically active, with occasional tragedies. Heavy rainfall brings floods.
To share the cost of these perils, following the 1942 Wairarapa earthquakes, the New Zealand go
New Zealand is a country that is prone to a range of natural hazards. Located on a series of major fault systems, earthquakes cause high levels of loss. The country is also volcanically active, with occasional tragedies. Heavy rainfall brings floods.
In the subsequent years, the EQC has evolved into the Natural Hazards Commission – Toka Tū Ake (NHC), with a purpose “to reduce the impact of natural hazards on people, property, and the community”. Essentially it operates as a financial pool, with home owners paying a levy on top of their insurance to generate the fund. In the event of a loss, the fund pays for the rebuild costs up to a cap (currently NZ$300,000); the remainder is then covered by the property’s insurance. Claims are funded directly from the pool, with reinsurance cover and ultimately a government guarantee in place to ensure that there are sufficient funds.
In reality, NHC does much more than this, acting to manage and settle claims, and to understand the range of hazards to which New Zealand is prone.
In the last few days, a range of media outlets in New Zealand have been reporting new data from NHC about losses from natural hazards in New Zealand. This is the headline from 1News:
“Landslides are New Zealand’s most expensive natural hazard – and new data reveals a sharp rise in damage claims and growing risks to homes, infrastructure and communities.”
In total, since 2021 NHC has received 13,000 landslide claims and has paid out NZ$322 million (US$191 million). New Zealand is seeing an abrupt increase in landslide losses, driven primarily by increasingly frequent high magnitude rainfall events. NHC is urging property owners to undertake preventative maintenance and to be aware of the limitations of EQC cover.
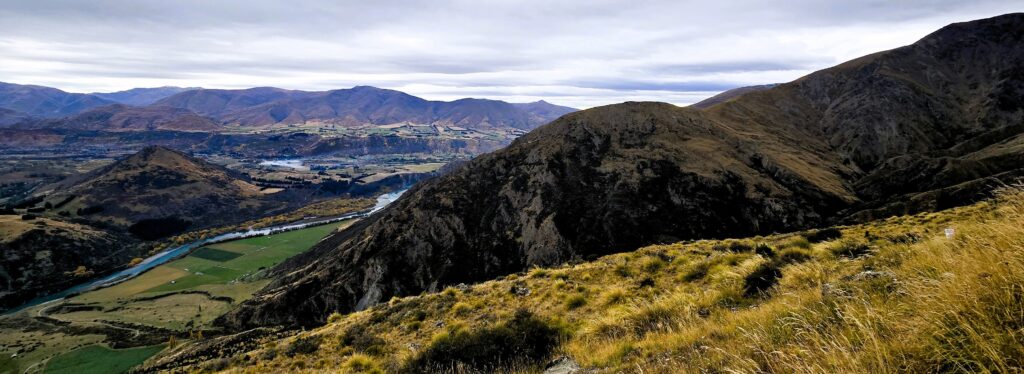
Here be landslides – typical landslide-prone terrain in New Zealand.
In common with many other places, these landslide hazards represent a major challenge to New Zealand. The landscape has many dormant landslides that are being reactivated by these increased rainfall events, and many new failures are also occurring. But, generating reliable risk maps for landslides remains a major challenge. This needs to be a major research focus in the coming years. It will require better understanding of triggering events (rainfall and earthquakes primarily); of the initiation processes within the slope; of runout / debris mobility; and of vulnerability and consequent losses. It is probably true to say that in all of these areas, landslide research lags behind that of earthquakes and floods, primarily because of a lack of long term investment.
In many countries, landslides are not an insured risk for this reason. On its own, this will be a major challenge that must be addressed. For those countries in which landslides are insured, we need quickly to get up to speed.
In April 2026 I recorded 36 fatal landslides causing 90 fatalities, the lowest monthly total for 2026 to date.
This is my regular update for the number of fatal global landslides, focusing on March 2026. As usual, this data has been collected in line with the methodology described in Froude and Petley (2018) and in Petley (2012). References are listed below – please cite these articles if you use this analysis. Data presented in these updates should be treated as being provisional at thi
In April 2026 I recorded 36 fatal landslides causing 90 fatalities, the lowest monthly total for 2026 to date.
This is my regular update for the number of fatal global landslides, focusing on March 2026. As usual, this data has been collected in line with the methodology described in Froude and Petley (2018) and in Petley (2012). References are listed below – please cite these articles if you use this analysis. Data presented in these updates should be treated as being provisional at this stage as I will reanalyse them prior to formal publication, and other events will emerge.
The headline figures are as follows:
March 2026: 36 fatal landslides causing 90 fatalities;
This is an interesting result, unusually showing that fatal landslides in April were substantially lower than for any of the preceding months in 2026. This is the updated annual chart by month:-
The number of global fatal landslides in 2026 by month to the end of April.
Loyal readers will know that I like to present the running total using pentads (five day blocks). This is the cumulative total pentad graph to the end of Pentad 24 (which captures all of the events to the end of April):-
The cumulative total number of global fatal landslides in 2026 by pentad to the end of April.
Thus, whilst April 2026 was unexceptional compared with the previous months of this year, the number of fatal landslides was still above the long term mean. Overall, 2026 continues to run extremely hot, exceeding even the record-breaking year of 2024.
We now start to enter the crucial period of much higher global fatal landslide occurrence. Whilst in the long term dataset this acceleration typically occurs in June (or even July), in recent years it has happened in May, as the 2024 line shows. I will watch with great interest to see what happens this month.
As glaciers retreat in warming regions, the risk of related hazards can increase, and improved monitoring may help reduce some of those dangers, according to a new study.
As glaciers retreat in warming regions, the risk of related hazards can increase, and improved monitoring may help reduce some of those dangers, according to a new study.
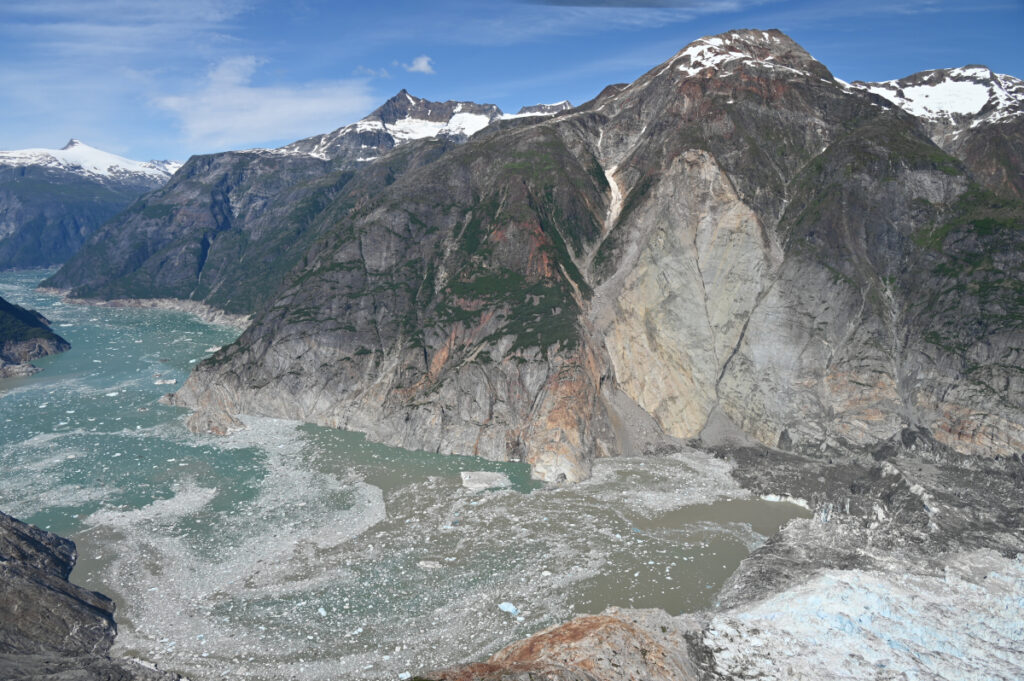
In the early morning of 10 August 2025, a mountainside collapsed into the waters of Tracy Arm Fjord in southeastern Alaska.
This massive landslide produced a tsunami that reached 481 meters on the opposite side of the fjord—higher than all but the world’s 14 tallest buildings—and registered on seismic detectors around the globe. For days after the slope collapsed, the waters of the fjord churned with a standing wave known as a seiche.
This drone video shows a man paddling throu
This massive landslide produced a tsunami that reached 481 meters on the opposite side of the fjord—higher than all but the world’s 14 tallest buildings—and registered on seismic detectors around the globe. For days after the slope collapsed, the waters of the fjord churned with a standing wave known as a seiche.
This drone video shows a man paddling through the iceberg-filled Tracy arm fjord in the aftermath of a landslide. Credit: Bill Billmeier
This event was the second-largest tsunami ever recorded and the largest not linked to an earthquake. A new paper published in Science presented strong evidence that the Tracy Arm landslide was instead the result of the rapid retreat of South Sawyer Glacier, itself a consequence of global climate change.
“It’s like if you have a kid and they said they cleaned their room but really all they did was throw everything in the closet. As soon as you open that door, everything falls out.”
Nobody was harmed by the rockslide or tsunami, but cruise ships were scheduled to visit the fjord later that morning. If the collapse had happened just a few hours later, it could have been disastrous.
“While the [South Sawyer] Glacier is in the fjord, it’s supporting those valley walls, like the buttresses on a cathedral,” said Daniel Shugar, a geomorphologist at the University of Calgary who led the study. “As that glacier retreated over the last few decades, it retreated just past the spot that did fail. It’s like if you have a kid and they said they cleaned their room but really all they did was throw everything in the closet. As soon as you open that door, everything falls out.”
This animation shows an overhead view of the 10 August 2025 Tracy Arm landslide. Credit: Patrick Lynett, University of Southern California
In other words, the glacier that carved the fjord in the first place was also holding its slopes in place, and the ice’s retreat under warming temperatures exposed rock that became vulnerable to crumbling. The proximate cause of the landslide might have been something else—as Shugar noted, rainfall is plentiful in that part of Alaska, which could have weakened the fjord’s walls further—but it might also have been a combination of small, individually insignificant factors. In any case, the removal of that glacial “closet door” was what made the collapse and tsunami possible.
“We know that steep slopes are very sensitive to the things that climate [change] is exacerbating, whether it’s losing permafrost, glacier retreating, or more water in the soil,” said glaciologist Leigh Stearns of the University of Pennsylvania, who was not involved with the Tracy Arm study. “Often, we think of glacier retreat as a long and continuous thing, but [it] can trigger sudden catastrophic events.”
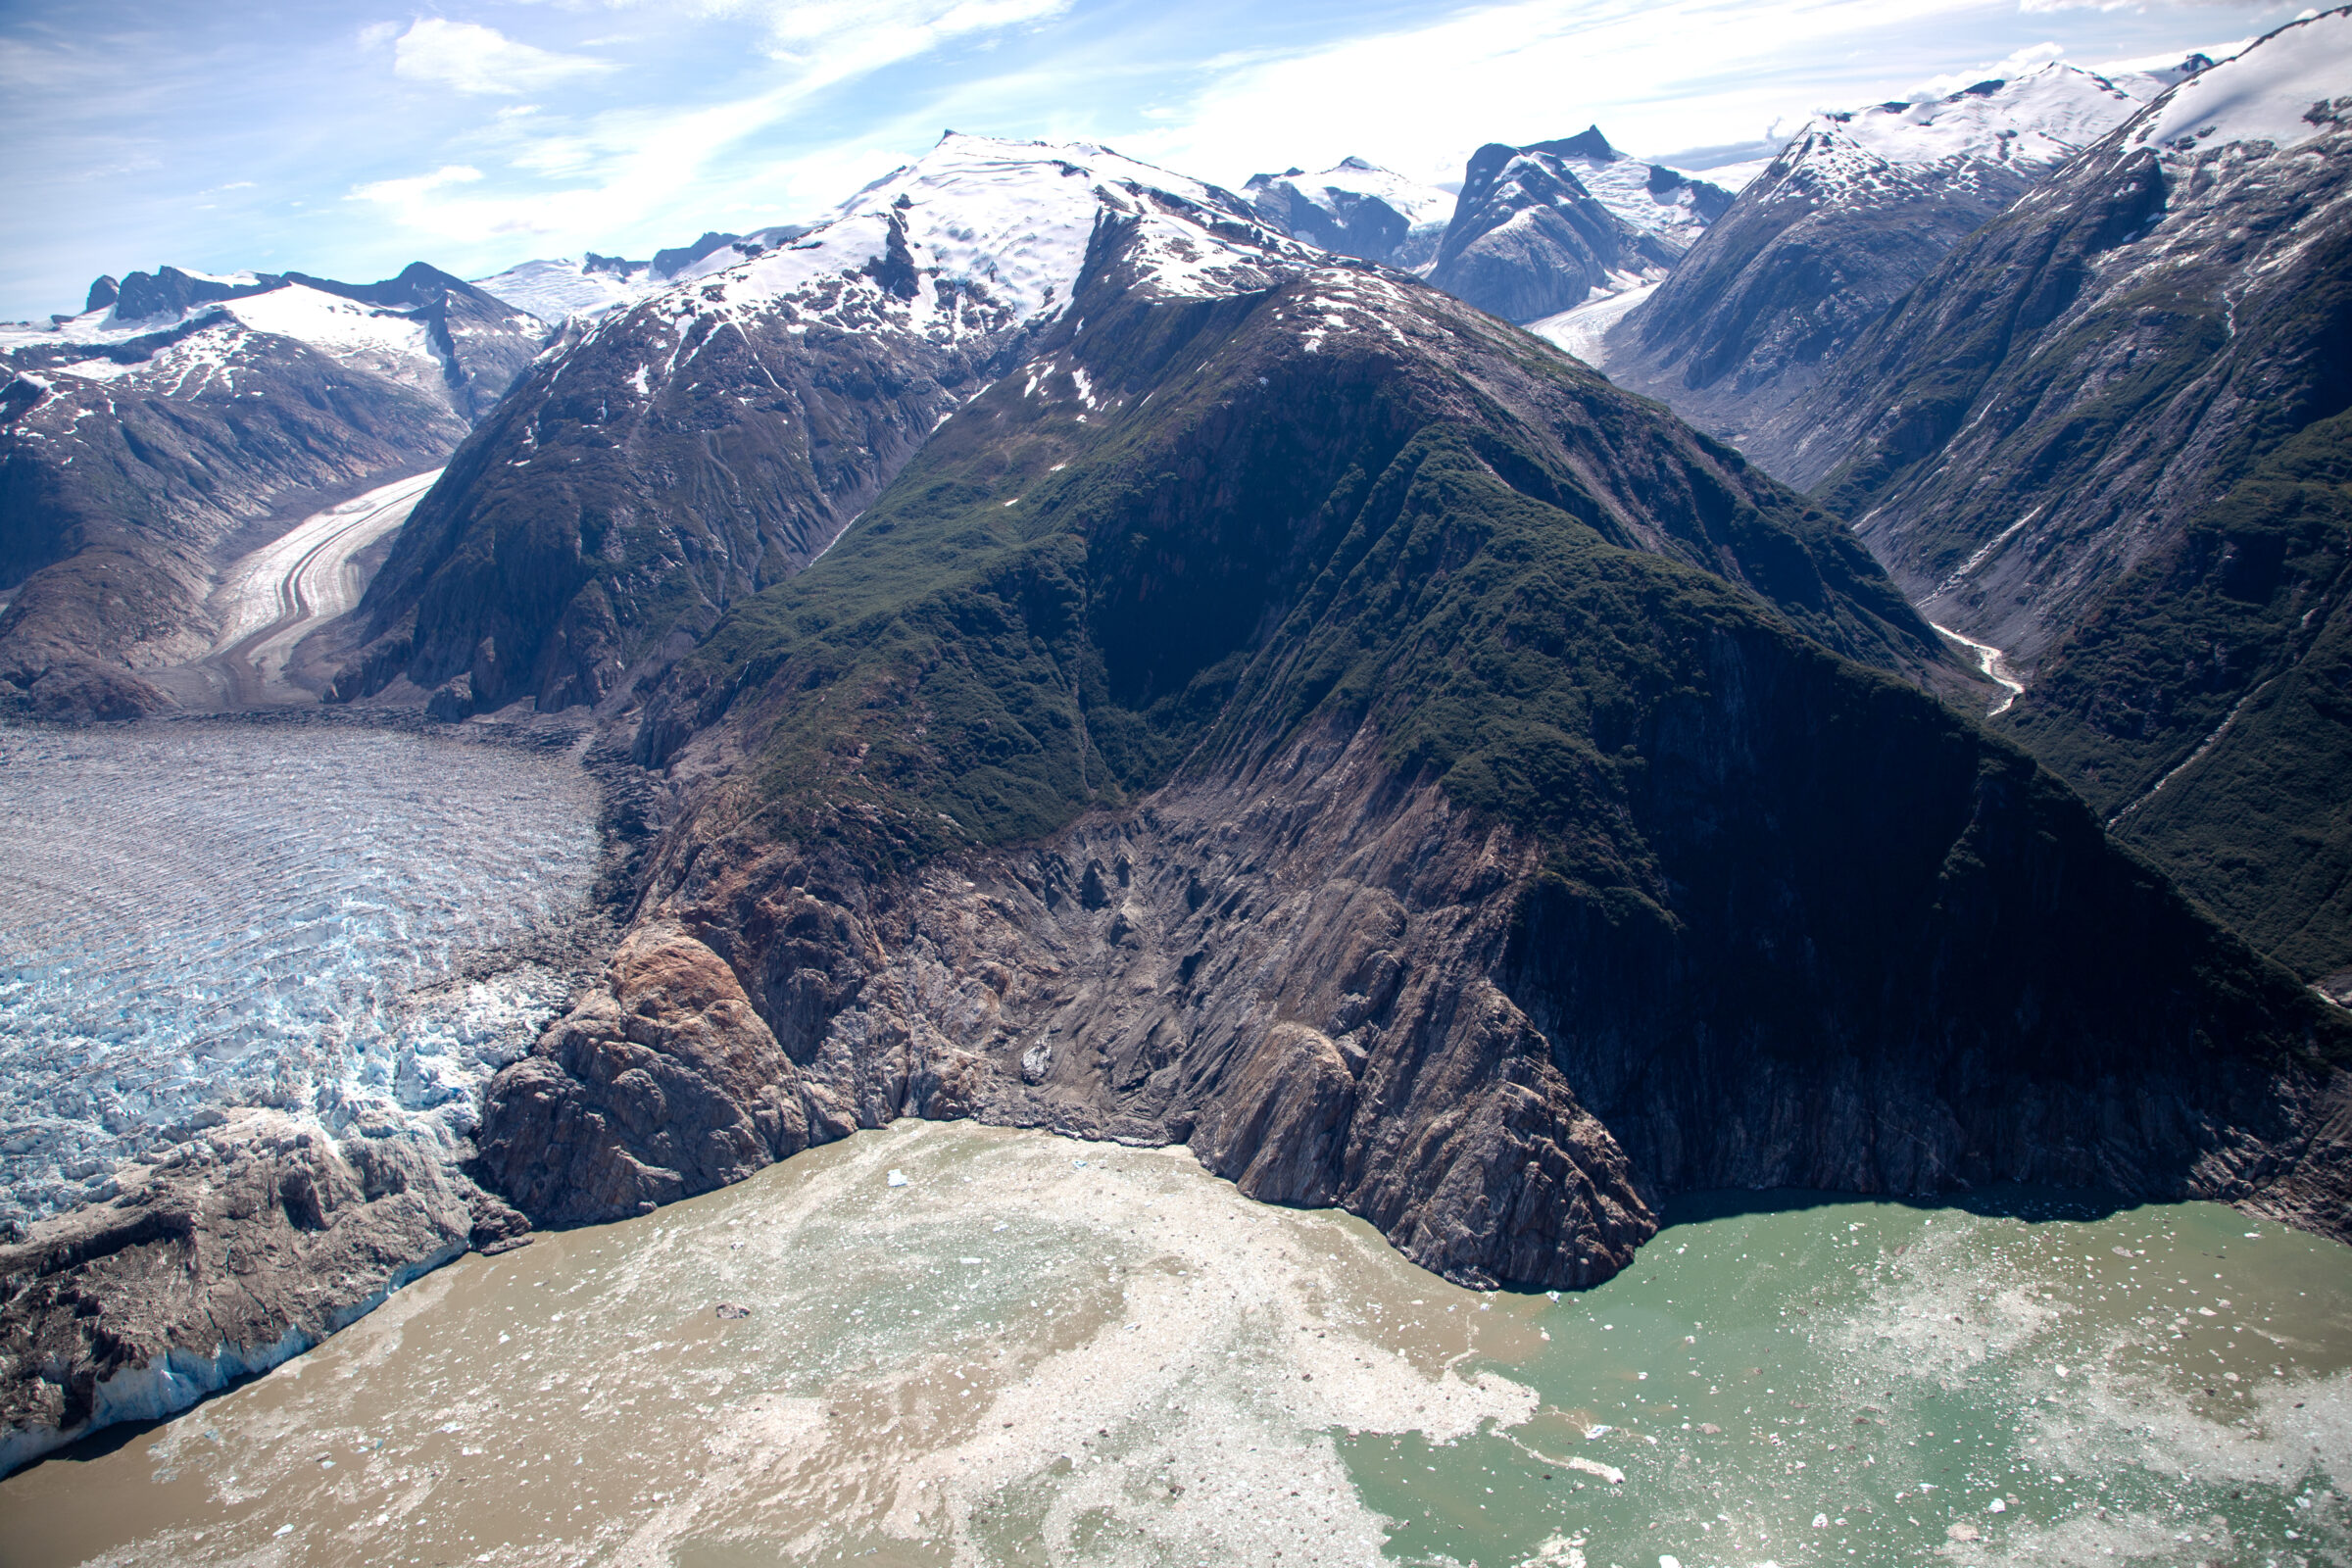
This aerial photo shows the highest run-up resulting from the 10 August 2025 landslide-triggered tsunami in Tracy Arm. It was captured during a U.S. Geological Survey field reconnaissance overflight on 13 August 2025. Credit: John Lyons/U.S. Geological Survey.
The Tracy Arm tsunami, like the record-setting Lituya Bay 524-meter megatsunami in 1958, was so dramatic in part because it happened in a fjord. The steep sides of the relatively narrow channel concentrated the energy generated by the rockfall into water.
A drone video shows the tsunami-affected part of the fjord, including the highest run-up area and the landslide itself. Credit: Bill Billmeier
Unlike Lituya Bay, which resulted from an earthquake, Tracy Arm provided very little seismic warning before the slope collapsed, requiring forensic work to determine what caused it.
Shugar noted that South Sawyer Glacier had retreated by roughly 500 meters in the spring of 2025 alone, on top of the general trend of shrinking and thinning over the decades. And it’s not alone: Interferometric synthetic aperture radar (InSAR) images taken by satellites indicate that many slopes in Alaska and beyond are in motion, pointing to potential future danger.
“Not every single one, but it seems like a huge majority of [shifting slopes] are above the lower parts of thinning glaciers,” Shugar said. He described this phenomenon as “debuttressing,” as in losing the glacial buttress holding a slope up. He added, “I think in the next 5 years or so, we’ll probably have a much better understanding of just how and how quickly slopes respond to that debuttressing.”
Threats, Hazards, and Climate Change
“We were unbelievably lucky that the [tsunami] occurred with the timing that it did, and not 5 hours later.”
Most tsunamis are set in motion by earthquakes and travel across the open ocean, wreaking their destruction when they reach shallower water near coasts; the word “tsunami” means “harbor wave” in Japanese. The Tracy Arm tsunami joined the ranks of other landslide-driven tsunamis, like the ones in Taan Fiord (Alaska) and Dixon Fjord (Greenland), in being linked to human-driven climate change. Beyond the immediate impact of the waves, this category of hazard requires rethinking potential risks from abrupt catastrophes like debuttressing as well as slower effects such as sea level rise.
“The risk to any particular cruise ship [from a tsunami] on any particular day is very low,” Shugar said. “We were unbelievably lucky that the [tsunami] occurred with the timing that it did, and not 5 hours later. The risk certainly still could be increasing as we build new settlements, new mining camps, or new oil and gas infrastructure.”
Both Shugar and Stearns highlighted the importance of learning lessons from Tracy Arm and related events.
“Climate is a threat multiplier, and the research is really forcing us to look at these cascading hazards,” Stearns said. Tracy Arm “is one example of this: Small slow changes can trigger big events. Hopefully, we don’t need so many disasters to spur some change.”
A drone video shows Sawyer Island in the Tracy Arm Fjord and evidence of the tsunami on the fjord walls. Credit: Bill Billmeier
This aerial photo shows the north side of Alaska’s Tracy Arm Fjord in the aftermath of the 2025 landslide and tsunami. The lighter-colored rock is the exposed surface, where the mountainside collapsed and fell into the water. The foot of South Sawyer Glacier is visible at lower right; in decades past, the ice extended much farther and was thick enough to hold the rock slopes in place. Credit: Cyrus Read/U.S. Geological Survey
Source: Water Resources Research
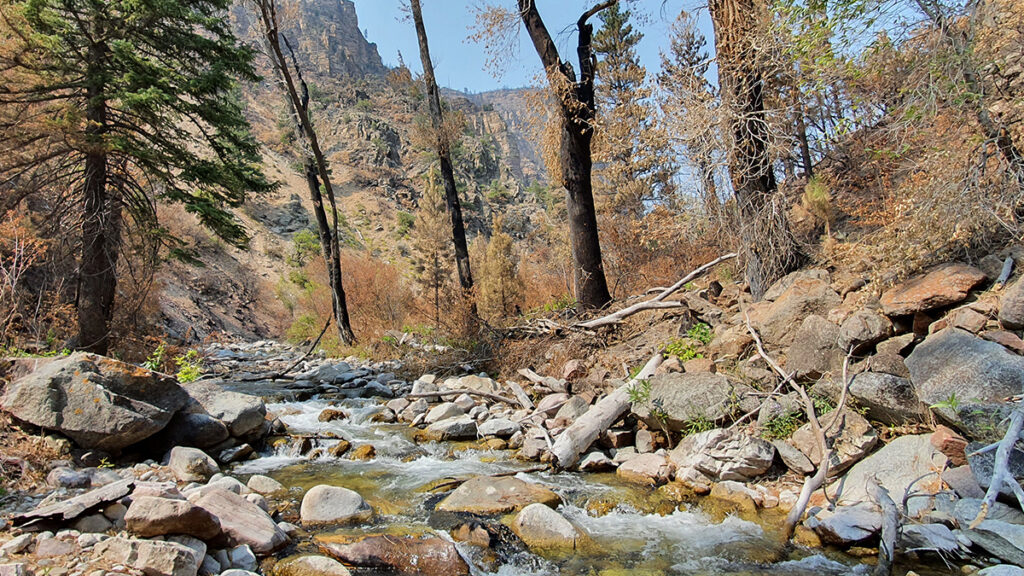
Wildfires can increase flooding risks in and downstream of burned areas by removing vegetation and disturbing hydrologic processes. As the climate changes, the severity of both wildfires and heavy rainfall events is increasing, meaning flooding is likely to become more severe in the near future. Better understanding how, and by how much, wildfires change flood risk is important for disaster and infrastructure planning for communities around the country.
Ca
Wildfires can increase flooding risks in and downstream of burned areas by removing vegetation and disturbing hydrologic processes. As the climate changes, the severity of both wildfires and heavy rainfall events is increasing, meaning flooding is likely to become more severe in the near future. Better understanding how, and by how much, wildfires change flood risk is important for disaster and infrastructure planning for communities around the country.
To make the most of the limited data on flooding in the years following wildfires, the researchers created a paired-storms framework: They identified postfire peak flows (PFPFs), defined as the five highest peak flows within 3 years of a wildfire across seven watersheds. Then, for each precipitation event causing a PFPF, they looked for storms with similar characteristics (or paired storms) that occurred before the wildfire. Storm characteristics used for pairing included the season in which the storm occurred, recent precipitation, and precipitation depth, duration, and peak intensity.
The researchers found significantly elevated peak flows after wildfires in many cases, underlining the risks to communities following wildfires and validating their approach for use elsewhere.
Altogether, the authors found 26 PFPF events, including 20 with paired storms occurring before wildfires. For 75% of the postfire storms, their peak flows were 2 or more times greater than prefire peak flows. PFPFs were most likely to happen in the first year after a wildfire and typically occurred following storms that were centered upstream of the watershed centroid, were uniform in shape, and fully covered the watershed and burned area, the authors reported. They also found some evidence that the first storm in the year immediately following a fire has a higher-than-expected chance of producing a PFPF.
Future work could look more deeply at the characteristics of storms occurring over burned areas, such as storm direction and watershed recovery, and could apply the automated methods to more burned watersheds and storm events to enhance the robustness of the work, the authors say. (Water Resources Research, https://doi.org/10.1029/2025WR040693, 2026)
Ten people were killed in a large landslide in Papua New Guinea triggered by heavy rainfall associated with Tropical Cyclone Maila.
On 9 April 2026, a large landslide occurred at Lamarain in the Inland Baining LLG of Gazelle District in Papua New Guinea. The landslide was triggered by heavy rainfall associated with the passage of Tropical Cyclone Maila.
Media reports indicate that ten people were killed by the landslide and that a further 18 people were injured. Baining is located at
Media reports indicate that ten people were killed by the landslide and that a further 18 people were injured. Baining is located at [-4.2548, 151.7811], so I assume that this is the general area.
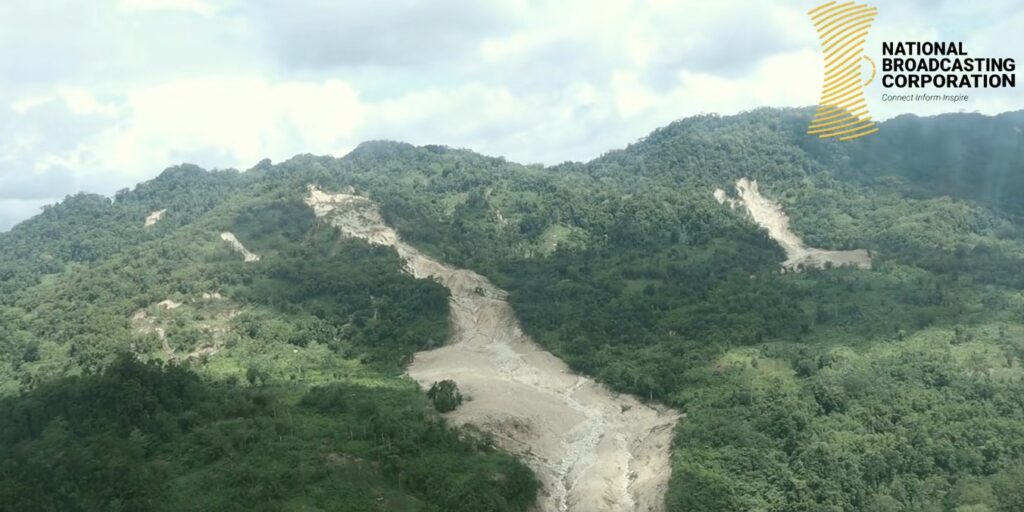
Gaining information about landslides in the remote areas of Papua New Guinea is very challenging – the terrain is rugged and there is a high level of civil turmoil. But the best source of information is on the Facebook page of NBC East Britain, which has posted a helicopter video of the aftermath. This is a still from that video:-
There are several interesting aspects of this landslide. First, the failure appears to have initiated high on the hillslope in an area that has a mix of forestry and cleared areas. The source appear to be quite large and deep-seated. This has transitioned into a disrupted debris slide / avalanche with a substantial amount of entrainment.
Note also the multiple other landslides in that area, all fresh, suggesting that the intense rainfall was sufficient to drive widespread failures. It is interesting to note though that is event did not involve multiple shallow landslides that combined to create a channelised debris flow.
A new paper Fidan et al. (2026) demonstrates that wealth and the rate of land-cover change play a key role in determining the occurrence of fatal landslides in mountain areas. These factors are statistically more significant that precipitation and topography.
A fascinating new paper (Fidan et al. 2026 – this paper is both open access and published under a Creative Commons licence – hurrah!) has just been published in the journal Science Advances that explores rates of land-cover (in the
A new paper Fidan et al. (2026) demonstrates that wealth and the rate of land-cover change play a key role in determining the occurrence of fatal landslides in mountain areas. These factors are statistically more significant that precipitation and topography.
A fascinating new paper (Fidan et al. 2026 – this paper is both open access and published under a Creative Commons licence – hurrah!) has just been published in the journal Science Advances that explores rates of land-cover (in the paper, the authors use the term land-use – land-cover) change as a factor in determining fatal landslides in mountains globally. I must admit to some degree of personal interest in this paper, although I am neither an autor nor a reviewer, as it brilliantly uses the dataset that Melanie Froude and I collated on global landslide fatalities (see Froude and Petley 2018). I’m delighted to see our data being used in this way (and please do contact me if you want a copy of the spreadsheet).
Fidan et al. (2026) explores a range of factors that might influence the occurrence of fatal landslides from the perspective of either increased vulnerability (poorer people may live in more vulnerable locations for example) or increased landslide likelihood (land-cover change might increase the likelihood of a landslide being triggered, for example).
The fascinating result lies in land-cover change. The authors have looked at approximately 60 years of land-cover changes in mountainous areas across 46 countries. Unsurprisingly, there is substantial change, especially in low- and lower-middle–income countries, often involving the loss of forest (which as a first order estimation, may buffer against slope failures), although the pattern is far more complex of course. Fidan et al. (2026) find that a key metric is the rate of change of land-cover, and that this is linked to the rate of population growth (perhaps unsurprisingly). Countries with high rates of population growth also show high rates of change of land-cover.
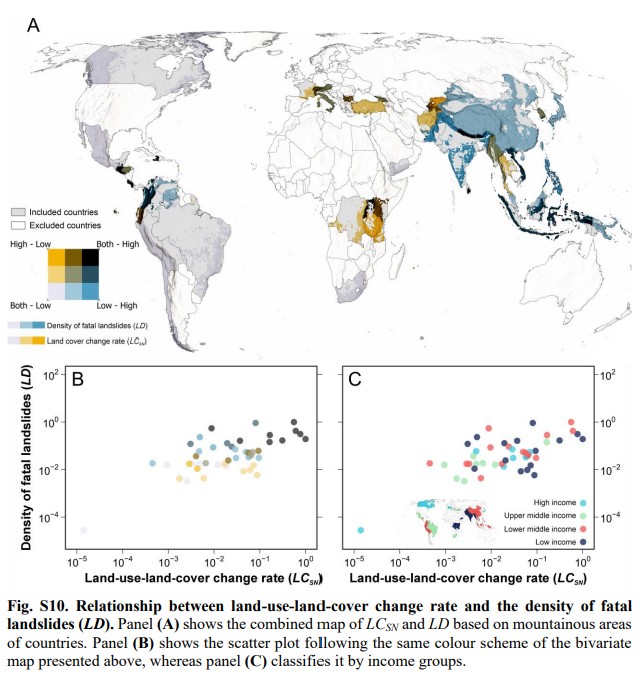
In many ways, the most interesting figure in this study is in the Supplementary Information. It is a complex diagram, but it’s worth more detailed analysis:-
The relationship between the land-cover change rate and the density of fatal landslides for mountain areas around the world. Figure from Fidan et al. (2026), published under a Creative Commons Licence.
The main map (A) shows mountain areas with high rates of land-cover change (orange), high density of fatal landslides (blue) or both (black). The left hand graph (B) shows the relationship between the landslide density and the rate of change of land-cover – here, higher rates of land-cover change are associated with a higher density of fatal landslides. The right hand graph is the same data as in (B), but with each point coloured according to the income level of the country. High income countries have a lower fatal landslide density. Thus, as the authors conclude, wealth and land-cover change appear to control fatal landslide density.
There is a really surprising element to this study, which I think requires more consideration. I think I should allow the authors themselves to express this finding, from the abstract:-
“Our statistical analyses show that land-use – land-cover changes have a substantially greater influence on the density of fatal landslides and landslide fatalities than physical factors such as topography and precipitation, especially in lower-income countries.”
As landslide researchers, we almost always default to topography and precipitation as being key in landslide occurrence. There are sound reasons for doing so. But statistically, the rate of land-cover change plays a more important role in mountain areas, especially in poorer countries.
This has (or should have) major implications for the way that we consider and manage landslide risk in such areas.