Proposal comes after seven states drawing water from drought-stricken river failed to come to an agreementThe US government has proposed a plan for the drought stricken Colorado River that could cut up to 40% of current supplies to Arizona, California and Nevada, as the waterway’s reservoirs continue to plunge to critically low levels.A top Arizona water official shared details of the Trump administration’s plan at a state meeting on Wednesday. Continue reading...
Proposal comes after seven states drawing water from drought-stricken river failed to come to an agreement
The US government has proposed a plan for the drought stricken Colorado River that could cut up to 40% of current supplies to Arizona, California and Nevada, as the waterway’s reservoirs continue to plunge to critically low levels.
A top Arizona water official shared details of the Trump administration’s plan at a state meeting on Wednesday.
Want your wildfire updates to come from a trusted source? Preference Eos in your searches!
Go to Google
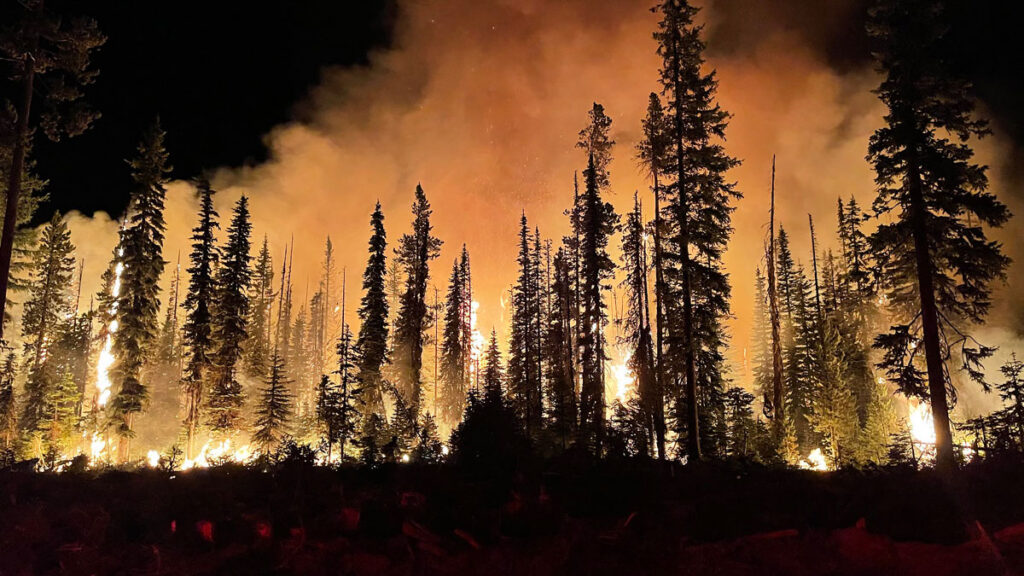
A warm, dry spring has set the stage for above-average significant wildland fire risk across much of the southern and western United States this summer, and no part of the United States will have below-average fire potential through the end of August.
“It’s not necessarily a foregone conclusion that we’re going to have a really busy season, but everything is pointing that way.”
These predictions are part of a 4-month outlook produced monthly by the National Interagency Fire Center (NIFC), a group of wildland fire experts from eight federal agencies that coordinates wildland fire resources across the country.
The most recent outlook, published 1 May, projects the likelihood of significant fires (defined as those that require an NIFC response) from May to August using long-term forecasts from NOAA’s Climate Prediction Center, current precipitation and drought conditions, and an assessment of the fuels available in different regions (like grasses, brush, and timber).
This year, 1,848,210 acres across the country have already burned—nearly twice the annual average over the past 10 years.
“It’s not necessarily a foregone conclusion that we’re going to have a really busy season, but everything is pointing that way,” said Jim Wallmann, a meteorologist for the U.S. Forest Service at the NIFC and one of the outlook’s authors.
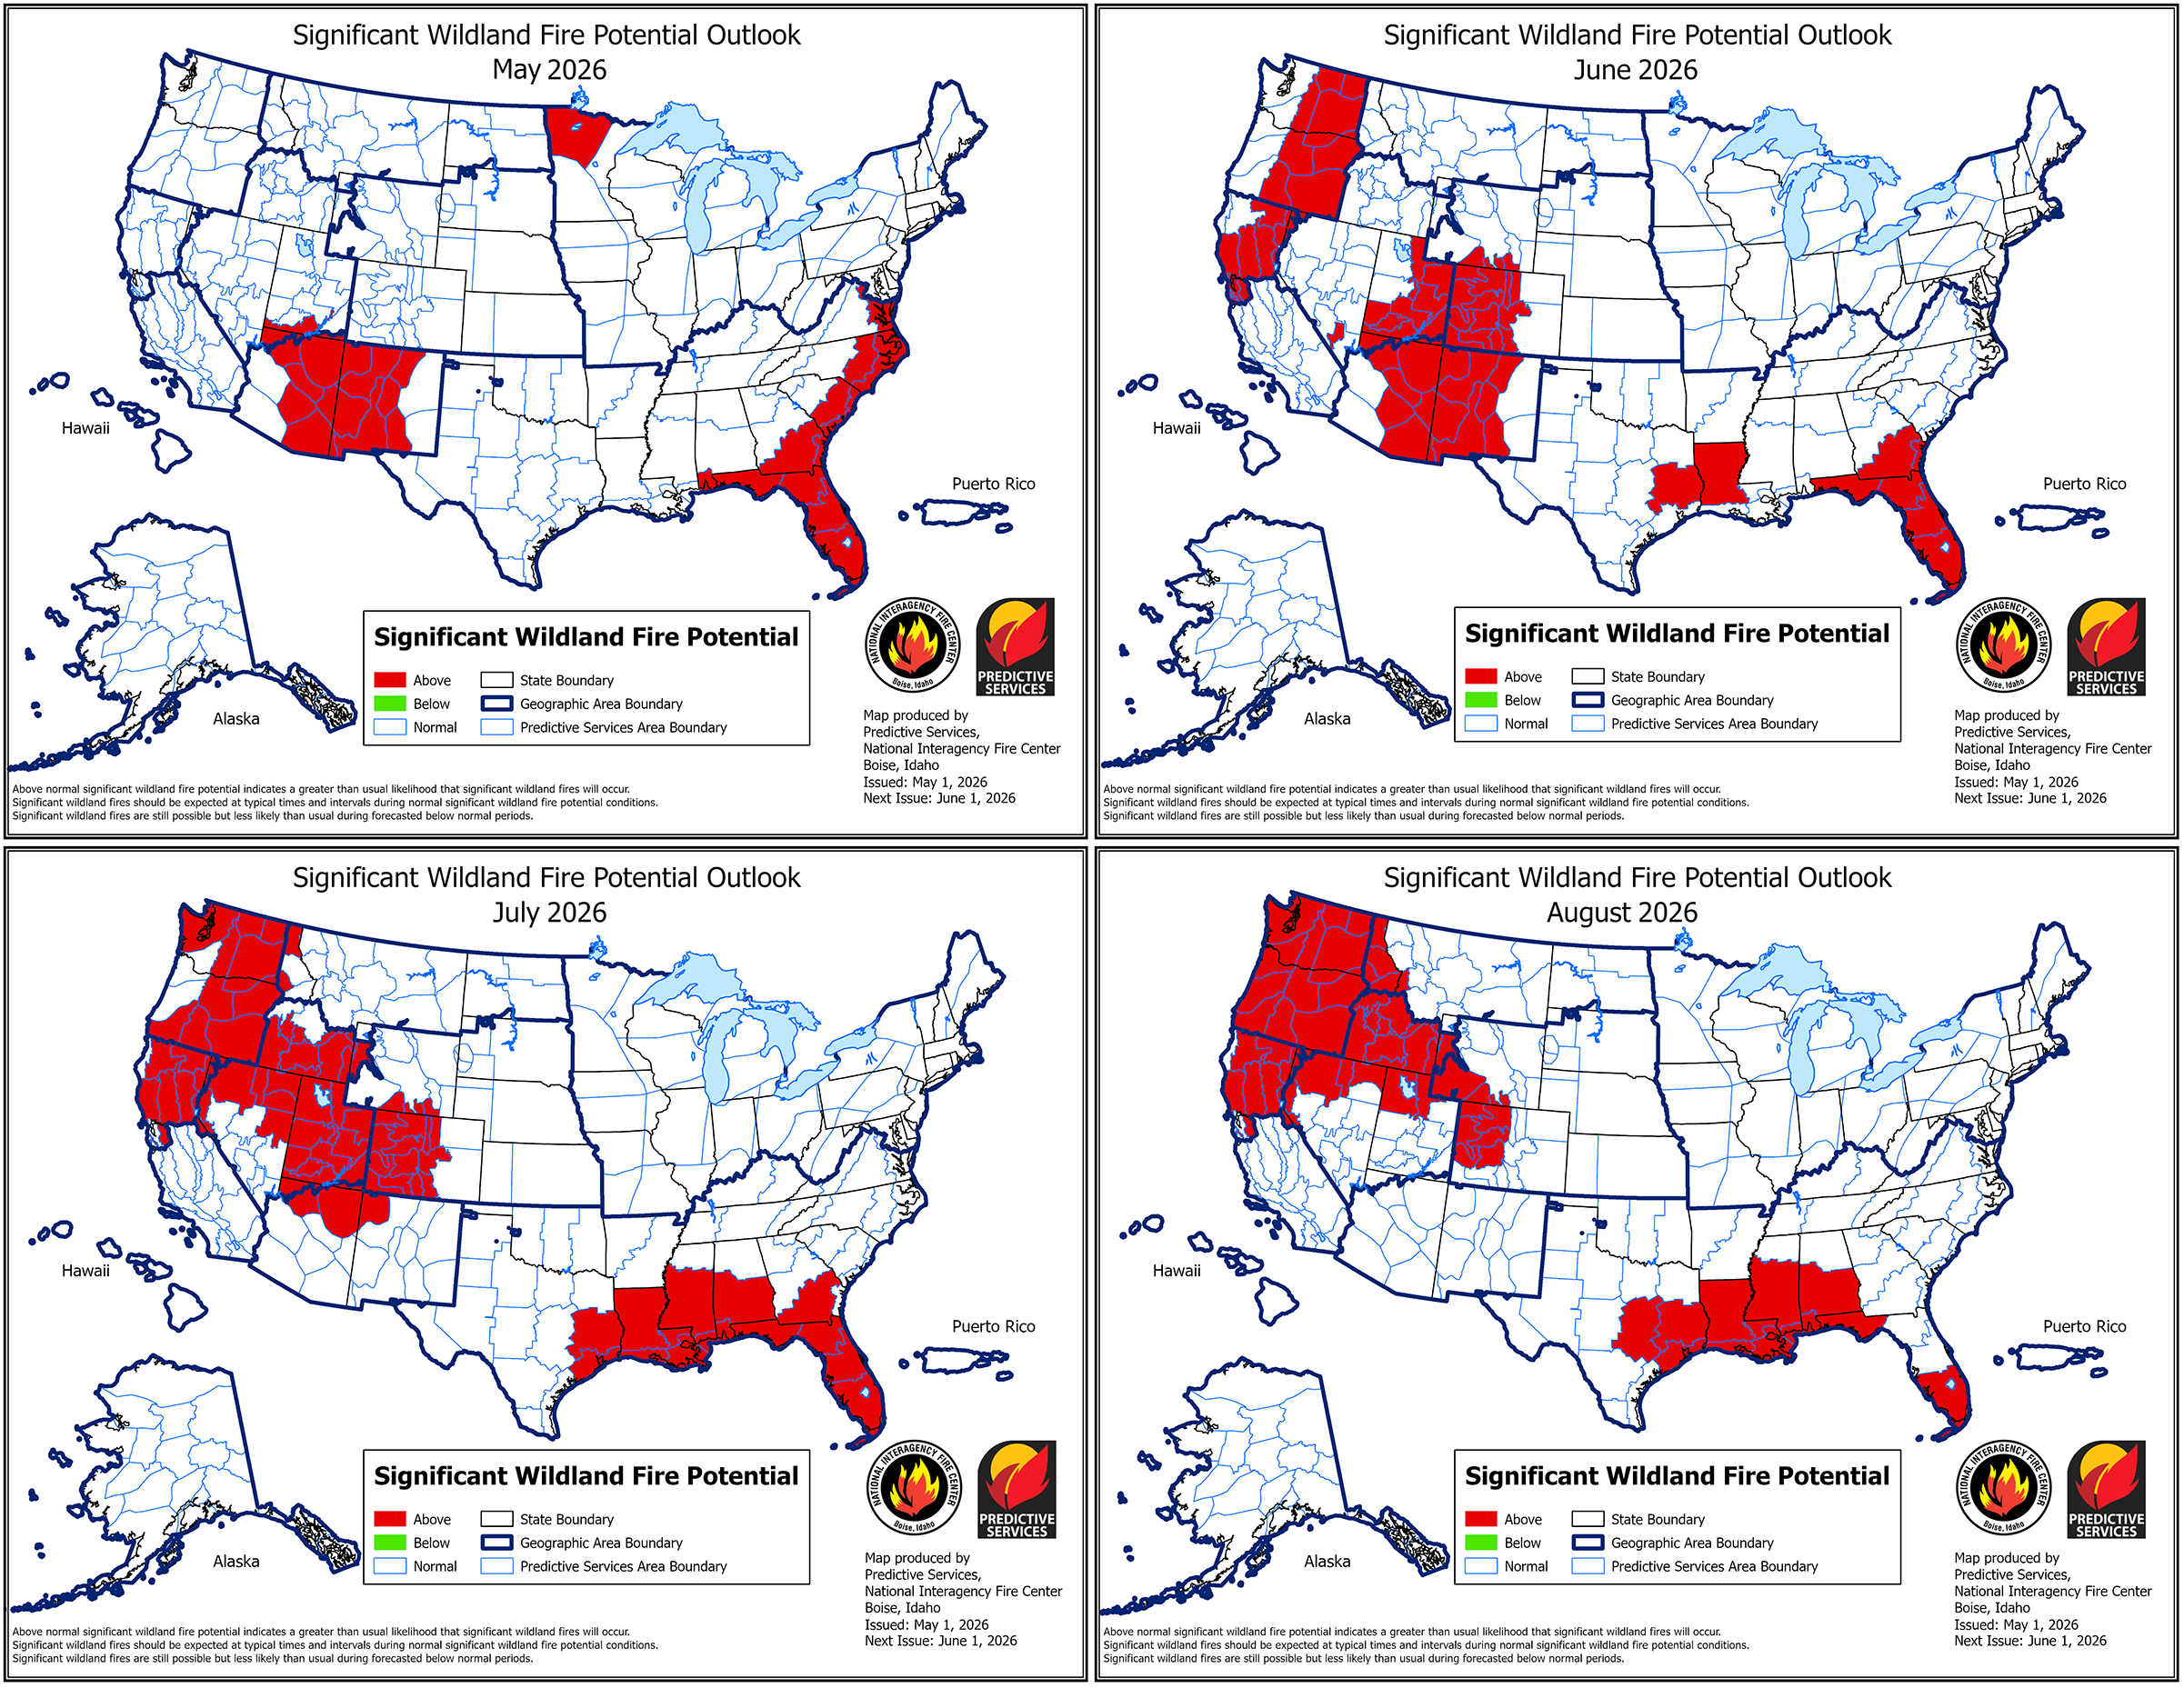
Significant wildland fire potential will be elevated across much of the West and Southeast this summer. Click image for larger version. Credit: National Interagency Coordination Center, Public Domain
Drought in the West
In the West, wildfire season typically peaks in late summer. This most recent outlook predicts an above-average significant fire potential for much of the West as the season peaks.
In May, the above-average risk is concentrated in eastern Arizona and western New Mexico, though that risk fades to normal by August as the Southwest’s monsoon season begins. In June, the above-average risk extends to western Colorado and parts of the Pacific Northwest. In July and August, that risk covers much of the Northwest, including Utah, Idaho, Oregon, Washington, and Northern California.
Above-average spring temperatures and a far-below-normal snowpack across the West are contributing to the elevated risk in Washington, Oregon, Idaho, and Northern California, in particular. Many river basins across the West contain less than 20% of their normal amount of snow, and some are already snow-free at all observed locations due to melting caused by warm temperatures in March.
As of May, many river basins in the West have a snow water equivalent—the amount of water held in their current snowpack—that is less than 50% (in red) of the 1991–2020 average level. Credit: USDA Natural Resources Conservation Service, Public Domain
“The snowpack being lower this time of year, and melting out, affects the soil moisture throughout the rest of the summer, which then affects the fuel moistures,” said Craig Clements, a meteorologist at San Jose State University’s Fire Weather Research Laboratory who was not involved in the outlook. Early snowmelt also uncovers fuels, like pine needles and leaf litter, that would typically be under snow, exposing them to the air to dry and catch fire.
Southern California and the Sierra Nevada mountain range, though, remain at an average significant fire risk throughout the summer, as a result of higher-than-average precipitation earlier in the year.
The Southeast and Beyond
Fire risk will also be elevated in the Southeast this summer. Florida, for example, remains at an above-average significant fire potential through the end of August. Southern Georgia, Mississippi, Louisiana, Arkansas, and the eastern halves of Virginia, North Carolina, and South Carolina will also have above-average significant fire potential.
The above-average risk is fueled, in part, by a worsening drought affecting the Southeast alongside the drought in the West. As of 1 May, nearly 63% of the country was experiencing drought, and 19% of the country was experiencing extreme or exceptional drought, according to the U.S. Drought Monitor.
The Midwest and the Northeast will remain at an average significant fire potential from May to August, though northwestern Minnesota faces an above-average potential in May.
No place in the United States is projected to have a below-average significant fire potential through the end of August.
Preparing Amid Uncertainty
A developing El Niño—a climate phenomenon that affects heat storage in the ocean—could alter the fire risk projections. Scientists expect that a strong El Niño could lead to a below-normal hurricane season, worsening drought in the Southeast. In the Pacific, a strong El Niño could intensify the hurricane season, which may lower wildfire risk.
However, a stronger El Niño could drive more lightning strikes in the Sierra Nevada, which could increase fire risk there, Clements said. In 2020, for example—a strong El Niño year—Hurricane Elida in the Pacific contributed to a lightning outbreak that supercharged wildfires in the West.
“We’re still not sure exactly how [El Niño] is going to impact the season.”
“We’re still not sure exactly how [El Niño] is going to impact the season,” Wallmann said. As late summer approaches, meteorologists will better understand how El Niño will develop and affect wildfire risk.
Weather patterns can change, and day-to-day conditions still play a role in fire occurrence. “If the weather shifts, or we get a really big heat wave, it can modify [the forecast]. Or if it remains relatively moderate, that might lessen the fire danger,” Clements said. “We’ll just have to see how the weather plays out.”
Wallmann and Clements emphasized that those living in areas with elevated fire risk should be aware of their surroundings and think ahead about where they might go for safety should a wildfire occur. “Having that situational awareness ahead of time can help you make better decisions,” Wallmann said.
Citation: van Deelen, G. (2026), Most of the U.S. West will face above-normal wildfire risk this summer, Eos, 107, https://doi.org/10.1029/2026EO260145. Published on 11 May 2026.
Data from missions showing critically low snowpack on mountains across the west raises alarm among expertsHigh above the jagged peaks of California’s Sierra Nevada, the view from the cockpit is breathtaking. At first glance, the mountains appear draped in a pristine white blanket. But as the flight crew gears up for a high-stakes mission, the sensors onboard this specialized aircraft prove that looks can be deceiving.“This is a distinct dry year,” says Tom Painter, CEO of Airborne Snow Observato
Data from missions showing critically low snowpack on mountains across the west raises alarm among experts
High above the jagged peaks of California’s Sierra Nevada, the view from the cockpit is breathtaking. At first glance, the mountains appear draped in a pristine white blanket. But as the flight crew gears up for a high-stakes mission, the sensors onboard this specialized aircraft prove that looks can be deceiving.
“This is a distinct dry year,” says Tom Painter, CEO of Airborne Snow Observatories.
Just over half the country is officially in drought, and about 155.7 million Americans—almost seven million more than last week—are now affected. The U.S. Drought Monitor’s April 23 report shows that 52.46% of the United States and Puerto Rico, and 62.78% of the Lower 48, are experiencing moderate drought or worse. According to NOAA, this is the worst spring drought on record for the continental United States.
This drought is not limited to one region. The Southeast just had its driest September
Just over half the country is officially in drought, and about 155.7 million Americans—almost seven million more than last week—are now affected. The U.S. Drought Monitor’s April 23 report shows that 52.46% of the United States and Puerto Rico, and 62.78% of the Lower 48, are experiencing moderate drought or worse. According to NOAA, this is the worst spring drought on record for the continental United States.
This drought is not limited to one region. The Southeast just had its driest September-through-March since records began in 1895. The Colorado River system is only 36% full. Texas is 77% in drought, and Corpus Christi’s reservoirs have dropped to nearly 9%. Nebraska experienced its largest wildfire ever, fueled by dry grasslands. Oregon’s snowpack reached zero on April 1. In California, Tahoe City Cross melted completely by March 8, 40 days earlier than usual, after a record-breaking March heat wave caused rapid melting of an already low snowpack across most of the West.
The common factor is that from January through March, precipitation was below 70% of average across the lower 48 states, setting a new record. As a result, water restrictions are now broader and, in many places, more severe than usual.
The National Picture
The headline numbers come from the U.S. Drought Monitor, which is jointly produced by the National Drought Mitigation Center, USDA, and NOAA. As of April 21, drought conditions had worsened across the South, Southeast, Mid-Atlantic, High Plains, and West, with a 2.9% increase in coverage over the past week and an 11.7% increase over the past month. The Northeast and parts of Texas and the eastern Plains saw modest improvement; everywhere else trended drier.
Two main climate factors have caused this record drought. First, La Niña led to less rainfall from January to March, with totals below 70% of average—the lowest since records began in 1895, just surpassing the previous low in 1910. Second, spring temperatures in the Central Plains, Midwest, Northeast, and Mid-Atlantic were 5 to 10 degrees above normal, which sped up soil moisture loss and increased evaporation. This drought is not just about low rainfall; high temperatures are also drying out what little moisture remains.
The effects of the drought are already clear in the number of wildfires. By mid-April, over 1.7 million acres had burned across the country, nearly double the 10-year average. Nebraska’s Morrill Fire, which burned more than 640,000 acres in March, was the largest in the state’s history. In southeastern Georgia, the Highway 82 Fire destroyed at least 54 structures in Brantley County, which was the first county in the Southeast to reach exceptional drought (“D4”).
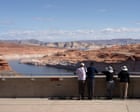
Southwest: The Colorado River Approaches a Threshold
The Colorado River Basin is facing water shortages not seen in modern times. The Bureau of Reclamation says the system is at about 36% of capacity. Lake Powell is only 23% full, and Lake Mead is about one-third full. Spring runoff into Lake Powell is expected to be just 22% of average. If this continues, 2026 could be one of the driest years in over sixty years, possibly even drier than 2002, which was the previous record.
In response, the Bureau of Reclamation announced in April that it plans to cut Lake Powell releases to 6 million acre-feet, the lowest in decades. They will also move water from Flaming Gorge to keep Lake Powell high enough for Glen Canyon Dam to generate hydropower. The dam provides electricity to about five million people, but water levels could drop too low by December if things do not improve. The seven states that share the Colorado River have not agreed on new rules for after 2026, when current guidelines expire. The Interior Department has said it may set new rules on its own if no agreement is reached this summer. Western states could be heading toward a conflict over water.
Local water restrictions are getting stricter. In March 2026, Erie, Colorado, moved to a Level 4 Emergency, the highest stage, which bans all residential sprinkler use. Aurora has completely banned new turf lawns. Denver Water started Stage 1 restrictions, asking residents to cut both indoor and outdoor water use by 20% until October 1. Along the Rio Grande, Elephant Butte is at 12.6% capacity, Falcon at 19.2%, and Amistad at 31.4%.
Source: UNLV Drought Monitor, April 28, 2026.
California: Permanent Rules Meet a Fourth Dry Year
California’s situation is more complex than just being in drought or not. In January 2026, the Drought Monitor showed no part of California in drought for the first time in 25 years. By April, Southern California was facing its fourth straight year of below-average rainfall. The statewide snowpack was only 18% of normal, and the State Water Project will limit water releases to 30% of normal.
What’s notable is that California’s restrictions no longer depend on whether a drought is officially declared. After the 2012-2017 drought, the state moved to a permanent year-round conservation framework codified by state law AB 1572 and the State Water Resources Control Board’s “Making Conservation a California Way of Life” rules.
Statewide baseline rules apply every year, regardless of conditions: no hosing down driveways or hardscape; no irrigation within 48 hours of rainfall; no irrigation runoff into streets or storm drains; mandatory shutoff nozzles on hoses; and recirculation requirements for fountains and decorative water features.
On top of these restrictions, the Metropolitan Water District of Southern California, which serves 19 million people, issued a Level 1 conservation notice in March 2026 to all 26 city and county agency members. State enforcement of the new water-budget rules is paused until 2027 to give utilities time to adjust.
California is in for a dry summer this year.
Southeast: A Recharge Season That Failed
The Southeast, usually a humid region, is now facing a record drought. Georgia, North Carolina, and South Carolina all had their driest September-through-March since 1895. Normally, the region relies on December through March to restore soil moisture, streamflows, and groundwater, but this year, that recharge mostly did not occur.
The result, as of April: 100% of North Carolina, 99.95% of Virginia, 99.34% of South Carolina, 98.99% of Florida, 98.13% of Georgia, 93.65% of Tennessee, and 88.66% of Alabama are in drought. In Georgia, extreme drought now covers 71% of the state, the highest reading since 2012. Some monitoring stations with 75 or more years of data are recording their driest six-month periods on record. Drought watches are active across Virginia, Tennessee, and Alabama, with mandatory rules likely if late-spring rainfall doesn’t materialize.
Texas and the Southern Plains: Cities at the Edge
Texas is 77% in drought as of mid-April. The Coastal Bend story is the one to watch closely. Combined storage at Choke Canyon Reservoir and Lake Corpus Christi has fallen to 8.7% as of April 2026 — among the lowest levels ever recorded. Corpus Christi has been under Stage 3 mandatory restrictions since December 2024, the most severe stage in the city’s standard drought contingency plan, which is triggered when combined reservoir storage drops below 20% capacity. Stage 3 bans all outdoor irrigation, home vehicle washing, and most non-essential outdoor water use; second and subsequent violations carry fines up to $2,000 each.
The bigger concern is what happens next. City models now predict a Level 1 Water Emergency by September 2026, when the water supply could be just 180 days from running out. On April 28, 2026, the City Council postponed a vote on a proposal that would require everyone—residents, businesses, and industry—to cut water use by 25% if Level 1 is declared. Many residents at the meeting said this cut would be impossible unless industrial users reduce even more.
If Corpus Christi runs out of water—a scenario city officials now consider possible—it would be the first modern American city to face this. There is no guidebook for what to do. In the worst case, the city could see rolling water shutoffs by district, water delivered by tanker trucks, and even managed evacuations. The largest industrial users, such as petrochemical refineries, would likely lose access to water first, potentially leading to lawsuits.
In other parts of Texas, Dallas has had a permanent rule since 2001 that only allows watering lawns two days a week, and no irrigation is allowed between 10 a.m. and 6 p.m. from April to October. In Oklahoma and Kansas, the Ranger Road Fire—the largest U.S. wildfire of 2026 so far—burned 283,283 acres in February, killed hundreds of livestock, and led to burn bans across central and eastern Oklahoma.
High Plains: Dust, Fire, and Lake Beds
Nebraska is experiencing conditions that one state climatologist said are unlike anything seen before. Fifty-six percent of the state is in extreme drought, similar to 2012 but with warmer temperatures. The Morrill Fire started in March and quickly spread through dry grasslands, burning over 640,000 acres—the largest wildfire in Nebraska’s history. In Sheridan County, some landowners say their private lakes have dried up completely for the first time since 2012.
The Black Hills in South Dakota are now in extreme drought. In southern Nebraska, southwest Kansas, and southeast Colorado, low rainfall combined with high temperatures and evaporation have made spring planting difficult in many areas. The U.S. Geological Survey reports that streamflows are below or much below normal across southwestern South Dakota, southern Nebraska, and central and western Kansas.
Mandatory urban restrictions in this region are still relatively rare, but burn bans are widespread, and ranchers are culling cattle herds rather than feeding them on pastures with no grass.
Pacific Northwest: A Snow Drought, Not a Rain Drought
The Pacific Northwest had more precipitation this winter than the Southwest, but most of it fell as rain instead of snow because of record-warm temperatures. This has caused a snow drought rather than a rain drought. Since the region relies on snowpack for summer water, this is a serious problem.
Across the broader Columbia River Basin, snowpack ranks in the second percentile. On April 8, Washington’s Department of Ecology declared a statewide Drought Emergency, citing snowpack at just 53% of the median and projected summer water supply below 75% of normal in many basins, including the Yakima. Junior water-rights holders in the Yakima Basin are projected to receive only 44% of their allotment. Idaho is facing what could be its fourth consecutive drought year in its northern basins.
For the Northwest, the effects go beyond just this summer. New research from Oregon State University predicts that by the end of the century, water will move from precipitation to streamflow about 18% faster on average. This happens because there is less snow and more rain, so water moves through the system more quickly instead of slowly melting from snowpack. As a result, there could be about 50% less water in rivers, lakes, and reservoirs during the summer growing season.
The shift toward earlier runoff seen in 2026 is not a one-time event. It is a preview of the more severe impacts that climate change could bring.
Where Restrictions Are Active
This is a partial snapshot as of April 27, 2026. Local utilities update stages weekly. Verify before relying on these figures.
Region
Location
Stage / Action
Notes
Southwest
Erie, CO
Level 4 Emergency
All residential sprinklers banned; most severe Front Range stage
Southwest
Aurora, CO
Stage 1 + turf ban
New turf lawn installations prohibited
Southwest
Denver, CO
Stage 1 (through Oct. 1)
Watering schedule by address
California
MWD Southern Calif. region
Level 1 conservation notice
Issued March 2026; covers 19M residents
California
San Francisco (SFPUC)
Level 2
Tied to Hetch Hetchy levels
California
Sacramento
Stage 2
Folsom Lake at 48%
Southeast
SW Florida (SWFWMD)
Phase III (Apr 3 – Jul 1)
Possible extension if summer rains fail
Southeast
Raleigh, NC
Mandatory Stage 1 (from Apr 20)
Odd/even address watering schedule
Southeast
Valdosta, GA
Mandatory 1-day/week (from Apr 15)
First Georgia city to move to mandatory rules
Texas
Corpus Christi
Stage 3 — Reservoir Crisis
Reservoirs at 8.7%; 25% cut planned for September
Texas
Dallas
Permanent 2-day/week
Ordinance since 2001; no irrigation 10am–6pm Apr–Oct
Pacific NW
Washington (statewide)
Drought Emergency (Apr 8)
Snowpack at 53% of median; Yakima Basin junior rights cut to 44%
Pacific NW
Oregon (snow drought)
No statewide order yet
Snow water equivalent at zero percentile on April 1
What You Can Do
Households use about 10% of all water in the U.S. Agriculture is still the biggest user, but in cities with restrictions, saving water at home can help prevent stricter rules, fines, or limits on businesses. The EPA’s WaterSense program says the average American family uses about 300 gallons a day, and simple upgrades can cut indoor use by 35%.
Indoor (immediate, no cost):
Check your home for leaks. On average, American homes waste over 11,000 gallons a year from running toilets and dripping faucets. A single toilet leak can waste 200 gallons a day. To test for leaks, put food coloring in the tank—if it shows up in the bowl without flushing, you have a leak.
Turn off the tap while brushing your teeth or shaving. This can save 8 to 10 gallons per person each day.
Only run your dishwasher and washing machine when they are full. You can also skip pre-rinsing dishes.
Take shorter showers. Reducing your shower by two minutes with a standard showerhead can save about 5 gallons of water.
Indoor (small investment):
Install WaterSense-labeled fixtures. Faucet aerators and showerheads use at least 20% less water and are inexpensive. The average family can save about 3,500 gallons of water and 410 kWh of energy each year just by using these.
Replace any toilet made before 1992. Older toilets use 4 gallons per flush, while WaterSense models use 1.28 gallons or less.
Outdoor (where most savings can happen):
Outdoor irrigation uses nearly 9 billion gallons of water a day nationwide. It makes up about 30% of household water use, and up to 70% in dry areas. Water your yard before sunrise or after sunset to reduce evaporation.
Consider replacing your lawn with drought-tolerant plants that are suited to your region. This type of landscaping uses less than half the water of a traditional lawn. Many cities, such as Aurora, Las Vegas, and Phoenix, offer rebates for replacing turf.
Install a smart irrigation controller with a rain shutoff or soil moisture sensor. These devices adjust watering based on real conditions instead of following a set schedule.
Add 2 to 3 inches of wood chips as mulch to your flower beds and vegetable gardens. This helps reduce evaporation and keeps weeds down.
Community and policy:
Find out your utility’s current drought stage and the rules that apply. Most utilities post this information online and let you report water waste, like irrigation during banned hours or broken sprinklers spraying onto pavement.
If you’re in an HOA, know your rights. California’s AB 1572 and Texas Property Code §202.007 prohibit HOAs from fining residents for brown lawns during active water restrictions. Other states are following this example.
Pay attention to how agriculture and industry use water in your area. While homes use only about 10% of water, decisions about the other 90%—used by farms and businesses—will shape whether household conservation efforts make a lasting difference.
The Big Climate Picture
Some may see the 2026 drought as just a mix of La Niña, a warm winter, and early snowmelt, with rain expected to return as conditions change and an El Niño watch begins for late summer. While this is partly true, the bigger pattern—record warmth, snow falling as rain, earlier and faster runoff, and reservoirs unable to keep up as demand rises during hotter, longer summers—is what climate science has predicted for nearly twenty years.
Lake Powell is at 23%. Oregon’s snowpack is gone. North Carolina is completely in drought. Corpus Christi is preparing for the chance of running out of water. These are not separate stories. They are all part of the same story, showing what aridification looks like when it becomes a daily reality instead of just a forecast.
Editor’s note: Drought conditions are evolving weekly. Statistics in this piece are current as of the U.S. Drought Monitor release dated April 21–23, 2026. Local water restrictions change frequently — verify with your utility before relying on the figures cited here.
Researchers examined the combined effects of tree loss and global warming in an effort to better understand how and when an ecosystem collapse could unfold.
Researchers examined the combined effects of tree loss and global warming in an effort to better understand how and when an ecosystem collapse could unfold.
Editors’ Highlights are summaries of recent papers by AGU’s journal editors.
Source: Water Resources Research
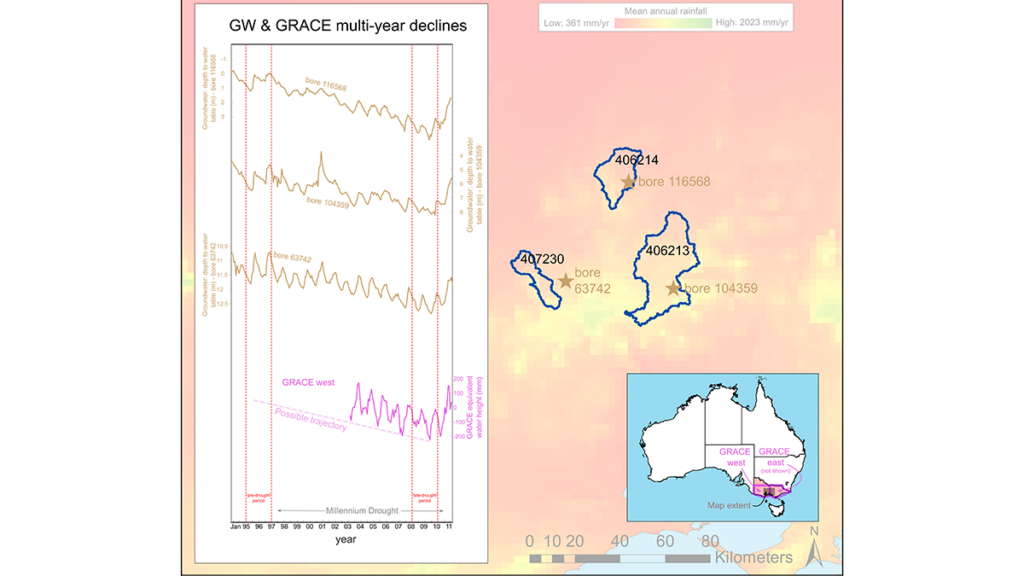
In the March 2026 issue of Water Resources Research, Zhang et al. [2026] interrogate conceptual hydrologic models’ ability to capture prolonged drought dynamics. The Australian Millennium drought serves as an example in the study. The results are quite sobering because the vast majority of more than 40 models fail. Unfortunately, calibration doesn’t generally help either and might
In the March 2026 issue of Water Resources Research, Zhang et al. [2026] interrogate conceptual hydrologic models’ ability to capture prolonged drought dynamics. The Australian Millennium drought serves as an example in the study. The results are quite sobering because the vast majority of more than 40 models fail. Unfortunately, calibration doesn’t generally help either and might result in massive overfitting. In essence, conceptual models miss deep aquifer storage components and associated hydrodynamic processes leading to a lack of time scales important in drought modeling. The study is a constructive reminder that model parsimony is not necessarily a good thing and that detailed representation of complex physical processes is part of hydrologic sciences.
Citation: Zhang, Z., Fowler, K., & Peel, M. (2026). Can conceptual rainfall-runoff models capture multi-annual storage dynamics? Water Resources Research, 62, e2025WR042226. https://doi.org/10.1029/2025WR042226
The spread of antibiotic resistance, a growing threat to global health that causes millions of deaths annually, is typically blamed on the overuse of drugs in hospitals and in the food industry. However, a new study published in Nature Microbiology suggests that normal geological processes could be accelerating the development of new resistances.
Soil microorganisms naturally produce antibiotics as a form of chemical warfare to compete with each other. When soils dry out, these natural compo
The spread of antibiotic resistance, a growing threat to global health that causes millions of deaths annually, is typically blamed on the overuse of drugs in hospitals and in the food industry. However, a new study published in Nature Microbiology suggests that normal geological processes could be accelerating the development of new resistances.
Soil microorganisms naturally produce antibiotics as a form of chemical warfare to compete with each other. When soils dry out, these natural compounds become more concentrated because there is less water to dilute them. Like a dosage increase, this concentration can create a harsher environment, killing sensitive microbes and sparing those with the capacity to resist. This phenomenon, in turn, is an evolutive driver that favors the appearance of new and more effective resistance genes.
“If you have more antibiotics in your environment, only the organisms that can withstand it…can resist it.”
To test whether this mechanism is having real genetic effects, Xiaoyu Shan, a microbial ecologist and postdoctoral researcher at the California Institute of Technology (Caltech), and colleagues looked at soil samples under controlled conditions as the samples transitioned from a wet state to a desiccated one. They found that as the soil dried, the presence of genes related to antibiotic production and resistance spiked, suggesting that drought leads to a rapid escalation in the subterranean biological arms race. Importantly, they did not look for pathogenic bacteria specifically, only for resistance genes, which can be present in a variety of microbes, whether those microbes are pathogenic or not.
“Drought leads to this elevation of antibiotic producers and bacteria that are resistant,” said team member Dianne Newman, a professor of biology and geobiology also at Caltech. “It’s a pretty simple idea: If you have more antibiotics in your environment, only the organisms that can withstand it…can resist it.”
Alternative Explanations
However, there could be other potential explanations for the observed increase in antibiotic-producing and antibiotic resistance genes, according to Enrique Monte, a microbiologist at the Universidad de Salamanca in Spain who wasn’t involved with the new study. For instance, arid soils are naturally more diverse than humid soils, making it common to find a more diverse gene pool in the ground, Monte said. In addition, the mere presence of antibiotic genes might not result in an actual release to the environment, or a release could happen in dosages that are too small to cause noticeable effects. “There are antibiotics that are volatile; they escape into the air, so they never reach a therapeutic concentration to kill others,” Monte said.
The authors, however, took some precautions to show that the increase in antibiotic resistance genes was actually a biological response to environmental stress. For instance, they also tracked other genes that should remain unaffected or decline under desiccation. As expected, genes that are needed for basic survival remained stable, while genes responsible for bacterial movement declined in dry soil, where mobility is restricted. Even some species that were not favored by desiccation saw an increase in resistance-related genes, “which is even stronger evidence,” Shan said.
Geographic Limitations
As the researchers combed through publicly available metagenomic data libraries, they had to select collections with strict control of all variables and in which the only changing factor was water content. That limited the analysis to five locations: two grasslands and a sorghum field in California; a forest in Valais, Switzerland; and a wetland in Nanchang, China.
The scarcity of locations might limit how extrapolable these results are, said Fiona Walsh, a microbiologist at Maynooth University in Ireland who was not involved with the work. “There are thousands of high-quality metagenomes available online with excellent metadata. I would really like to see a comparison where they apply their analysis to a broader map of global metagenomic data to see if they reach the same conclusions,” she said.
From the Soil to the Hospital
Drier regions consistently showed a higher number of resistant bacteria cases in hospitals, even after adjusting for confounding factors such as local income.
The study also suggests that dry soils might be a hidden driver of clinical cases of antibiotic resistance worldwide. The authors combined hospital data on the number of cases of resistant infections from 116 countries with the local aridity index, which measures temperature and precipitation, for each location. They found a strong correlation: Drier regions consistently showed a higher number of resistant bacteria cases in hospitals, even after adjusting for confounding factors such as local income.
However, the authors admitted that this is only a correlation effect and doesn’t prove causation. “It motivates follow-up research to see how environmental concentration weighs against human overuse and poor stewardship,” Newman said.
Even this correlation could be a stretch, according to microbiologist Sara Soto, head of the Global Viral and Bacterial Infections Programme at the Instituto de Salud Global de Barcelona. At the end of the day, she said, the authors have soil data from only five locations in three countries, and they are not tracking the specific bacterial varieties that make people sick, only resistance genes.
For the thesis to be solid, Soto said, the ideal approach would have been to contrast hospital strains from a specific area with soil data from that same region during the same drought episode. “Making such a vast inference—that what happens in the soil of one location affects what happens in a hospital elsewhere—is a big leap,” she said.
The authors, however, point out that resistance genes from soils can eventually make their way into human pathogens. Microbes have the capacity to share genetic material across species—a process known as horizontal gene transfer. In their analysis, the team identified specific resistance sequences that appeared to have been transferred between soil bacteria relatively recently, perhaps within the past decade. How they are reaching hospitals remains a matter for a future study, they said.
As droughts increase in numerous regions in the face of climate change, this selective pressure within soil ecosystems is expected to intensify. Though these findings do not show that drought directly puts drug-resistant pathogens in hospitals, they still suggest that a drying climate could set the scene for an increase in antibiotic resistance, the researchers report.
Citation: Barbuzano, J. (2026), Antibiotic resistance might get a boost from droughts, Eos, 107, https://doi.org/10.1029/2026EO260132. Published on 29 April 2026.
Nevada just shattered its March statewide high temperature record by 6 degrees, which is a ‘72 miles per hour in a school zone’ kind of margin. And it happened during the hottest 11-year stretch in 176 years of recorded temperature tracking.
A mid-March heat wave in the American West pushed temperatures in Laughlin, Nevada, to 106°F, far above the previous March record of 100°F. The fact that this happened in March is alarming, especially since it coincided with a near-total collapse of the regi
Nevada just shattered its March statewide high temperature record by 6 degrees, which is a ‘72 miles per hour in a school zone’ kind of margin. And it happened during the hottest 11-year stretch in 176 years of recorded temperature tracking.
A mid-March heat wave in the American West pushed temperatures in Laughlin, Nevada, to 106°F, far above the previous March record of 100°F. The fact that this happened in March is alarming, especially since it coincided with a near-total collapse of the region’s snowpack. This sets the stage for an early and possibly severe wildfire season. The heat also fits a troubling trend confirmed by the World Meteorological Organization last week: 2015 through 2025 have been the 11 warmest years ever recorded on Earth.
Usually, temperature records are broken by small amounts. What happened in Nevada last month was very different. Some places broke monthly high temperature records by as much as 8 degrees. Reno had seven days above 80°F in March, compared to the previous record of just two days. “It’s not just that we broke monthly records,” said Nevada State Climatologist Baker Perry, “but it’s by how much we broke the monthly records, and not just in one place.”
A Snow Drought That Wasn’t in the Forecast
The heat wave didn’t hit a typical winter landscape. Nevada was already experiencing what Perry calls an unprecedented snow drought. Even though winter precipitation was close to normal and there were big storms in mid-February, warm, moist air arrived soon after. This caused what the National Weather Service called the second-highest single-day snowmelt ever recorded in the eastern Sierra, only surpassed by flooding in 1997.
Normally, snow melts slowly through April and May, but this year it happened all at once in late February and early March. SNOTEL monitoring stations across Nevada show the impact clearly: 70% of sites in northern and central Nevada now report zero inches of snowpack. That’s not just low—it’s gone. The incidence of drought is closely correlated with rising atmospheric CO2 levels recorded at the Mauna Loa Observatory in Hawaii, which is threatened with defunding by the Trump Administration.
Atmospheric CO2 levels from 2021 to 2026. Source: N.O.A.A.
What worries scientists most is the combination of these events. “To have these two unprecedented, exceptional events happening at once is a combination that is particularly concerning,” Perry said.
What This Means for Fire Season
Wildfire risk isn’t only about heat. It depends on the sequence of conditions leading up to fire season, and this year’s setup is especially dangerous.
The snowmelt and early rains caused plants to grow weeks ahead of schedule. This early growth creates lots of fine fuels. As these plants dry out over the spring—now with less moisture from snowpack—they become the kindling that can fuel fast-moving fires.
Truckee Meadows Fire Protection District Division Chief August Isernhagen said the early green-up could lead to conditions we haven’t seen before as fire season approaches. He urged people to be even more careful than in recent drought years.
“The majority of our starts, and nearly all of our catastrophic fires are human caused,” Isernhagen said in a statement from the University of Nevada, Reno.
Mountain forests face another challenge. Dawn Johnson, Warning Coordination Meteorologist at the NWS in Reno, explained that losing snowpack this early means heavy timber can become drought-stressed much sooner than usual, turning it into a fire hazard months earlier than normal. A cooler storm pattern expected in early April might bring some relief, but experts warn it may be too little, too late to make a real difference.
Eleven Years. No Exceptions.
The Nevada heat wave wasn’t an isolated event. It happened during the longest stretch of global heat ever recorded.
The WMO’s State of the Global Climate 2025 report, released on March 23, confirmed that every year from 2015 to 2025 is among the hottest ever recorded. Depending on the data, 2025 was either the second- or third-warmest year since records began, with temperatures about 1.43°C above pre-industrial levels. Atmospheric CO₂ reached its highest level in 2 million years, and ocean temperatures set a new record for the ninth year in a row.
UN Secretary-General António Guterres put the streak in stark terms: “When history repeats itself eleven times, it is no longer a coincidence. It is a call to act.”
The report also introduced a new measure called Earth’s energy imbalance (EEI). This tracks the difference between the energy the planet receives from the sun and the energy it sends back into space. In 2025, EEI was at its highest since records began in 1960. Surface temperatures, which get most of the attention, only show about 1% of the planet’s extra heat. Over 91% is absorbed by the oceans, which have taken in the equivalent of about 18 times the world’s total annual energy use each year for the past 20 years. EEI gives a clearer picture, showing that the planet is becoming more out of balance.
“In 2025, heatwaves, wildfires, drought, tropical cyclones, storms and flooding caused thousands of deaths, impacted millions of people and caused billions in economic losses,” said WMO Secretary-General Celeste Saulo. She added that the changes driven by human activities “will have harmful repercussions for hundreds — and potentially thousands — of years.”
What’s happening in the Western U.S. matches the WMO’s global findings perfectly. The report highlighted major glacier loss in 2025 along North America’s Pacific coast. These events aren’t separate—they’re both signs of the same warming trend, just showing up in different ways and times.
“We seem to be entering this new era where temperatures will be significantly higher than what they were ten years ago,” said climate scientist Sarah Perkins-Kirkpatrick of Australian National University. She explained that the changes of the past three years can only be explained by climate change.
What About the Cold in the East?
This is where things get both surprising and important.
If you live in the Northeast, Midwest, or Southeast, 2025 might not seem like a record-warm year. Some parts of the eastern U.S. have had cold snaps and severe winter weather that made national news. So how does that fit with 11 straight years of record global heat?
This actually makes sense in climate science. Climate change doesn’t warm every place at the same time. Instead, it disrupts atmospheric patterns like the polar vortex, which usually keeps cold air over the Arctic. As the Arctic warms much faster than the rest of the planet—about four times the global average, according to NOAA—the polar vortex weakens and shifts, letting cold air move into areas that don’t usually get it.
In other words, the same forces causing record heat in Nevada are also behind the unusual cold in the eastern U.S. These aren’t opposites—they’re both results of a destabilized climate system. Weather feels local, but our climate is shared. When the West is hot in March and the East is cold, both are signs of the same disrupted system.
Lower the risk of starting fires. Most wildfires are caused by people, so be extra careful during high-risk times. Don’t have campfires during bans, avoid dragging chains on your vehicle or trailer, and make sure your equipment doesn’t create sparks.
Support climate policy at both the state and federal levels. Reach out to your Congressional representatives. The WMO data shows the trend is clear. The decisions we make now will shape how severe fire seasons are in the future.
Cut your home’s carbon footprint by using energy efficiently, choosing cleaner transportation, and making changes to your diet. One person’s actions won’t solve the global problem, but when many people make changes, it can have a real impact on emissions.
If you live in the eastern U.S., don’t let cold winters make you ignore climate data. Pay attention to what’s happening across the country—the same atmosphere connects us all.