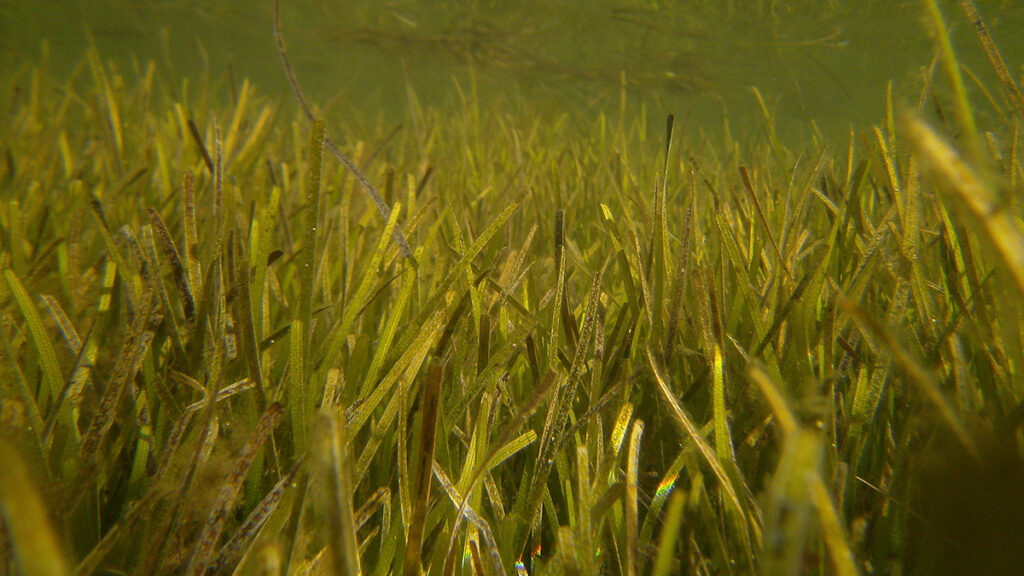
Renske Jongen, an ecologist at the University of Sydney, calls seagrass ecosystems the “tropical rainforests” of the ocean. These underwater flowering plants offer habitats to marine life, protect coastlines from damage, and, like rainforests, store enormous amounts of carbon.
They’re also under threat from pollution, development, and warming ocean waters, which stress plants and slow growth rates. Seagrass populations have been declining globally for nearly a century, and recent estimates suggest 7% of seagrasses are lost worldwide each year.
A new study published in New Phytologist shows that warming waters may affect a microscopic aspect of the seagrass ecosystem, too: the microbes that live in their sediments. The new insight can inform efforts to restore seagrasses, the authors write.
Seagrasses are “getting attacked from both sides,” said Jongen, the lead author of the new study. Warming water stresses the plants themselves, while “something changes in the sediment that makes them grow worse.”
Sediments and Seagrass
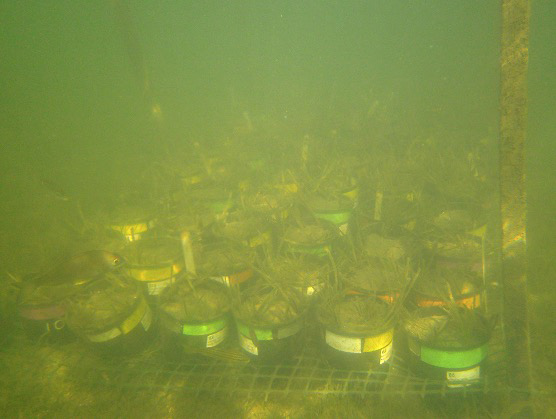
The research team transplanted seagrasses from elsewhere in Lake Macquarie to a preexisting, artificially warmed area to run their experiment. Credit: Renske Jongen
To test how microbial communities affect seagrass growth under warming temperatures, Jongen and the research team transplanted seagrasses and their sediment from both warm and cool areas of Lake Macquarie, a coastal saltwater lake in New South Wales, Australia, into an artificially warmed part of the lake. The artificially warmed part of the lake has received intermittent plumes of heated water from a nearby power plant since 1984, leading to a consistent temperature increase of 1°C–3°C (1.8°F–5.7°F) compared with the rest of the lake.
For half of the seagrasses, the team also used an autoclave, an instrument that uses steam to sterilize materials, to kill most of the microbes in their associated sediment before transplanting them to the experimental garden. “By looking at how plants respond with and without their microbes, you can get an idea for whether [those microbes] help or harm the plant under certain environments,” Jongen said.
The plants were then left to grow for 28 days before the team measured how they’d fared.
The warm-origin seagrasses in their original, warm-origin sediments with microbes intact grew the slowest once they were in the artificially heated waters, producing 35% less aboveground biomass than their counterparts whose sediment microbial communities had been killed. That result suggests that the microbial community in warmed sediment contributes to seagrass stress, the authors wrote.
“These plants, in general, do not like sediments that have been exposed to warmer temperatures.”
“These plants, in general, do not like sediments that have been exposed to warmer temperatures,” Jongen said. She was surprised that the plants that came from the warm areas had the worst outcomes but hypothesizes that perhaps these plants were already too stressed from warm waters to deal with the changes to sediment bacterial communities that occurred after they were transplanted into the even warmer part of the lake.
“It’s just like us, for example: When we don’t sleep or we’ve had a stressful week, then we get sick more easily,” she said.
Jongen said more research is needed to say for sure why warmed sediment seems to change microbial communities in a way that harms seagrasses. But research has shown that some microbes in ocean sediment produce sulfide, which can be toxic to seagrasses if it accumulates, especially if those seagrasses are already stressed. Warmer conditions may allow these sulfide-producing microbes to grow more quickly, harming the plants.
The new research highlights the “context dependency of host-microbe interactions,” said Karolina Zabinski, a marine ecologist at the University of California, Davis, who was not involved in the new study. Previous research by Zabinski and others also showed that seagrass growth depends on their associated sediment microbiome.
Restoration Lessons
The new study “serves as a great springboard” for both academics seeking to understand seagrass-microbe interactions and practitioners working on seagrass restoration in the field, Zabinski said.
For academic researchers, the paper raises exciting questions about how the microbial communities present in the sediment actually function, she said. Though the study identified the types of microbes in the seagrasses’ sediments, it didn’t evaluate the abilities of those microbes, which genes they possess or express, or how those microbes interacted with each other. “What are their actual genes, and what are they doing?” Zabinski asked.
“When plants don’t do well, we can’t just assume it’s inherent to the plants—we have to remember it could be driven by the microbes that they’re interacting with.”
For seagrass restoration practitioners, the study could offer new methods to try to improve restoration success. Some projects, for example, aim to take plants from warmer environments and transplant them to seagrass ecosystems that will face warming stress in the future as the climate changes. “It seems pretty intuitive that maybe those plants will have the traits or the genetics to respond to that warming,” said Randall Hughes, a marine ecologist at Northeastern University in Boston who was not involved in the new study. But the study’s results highlight “that intuition is not always reliable.”
“Certainly, having experimental studies like this helps us think about those restoration efforts in a more informed way,” she said. “When plants don’t do well, we can’t just assume it’s inherent to the plants—we have to remember it could be driven by the microbes that they’re interacting with.”
Jongen hopes to continue studying related questions about how seagrasses respond to warming waters. In particular, she’d like to investigate how long changes to the sediment microbial community last and whether those changes reverse once a marine heat wave subsides.
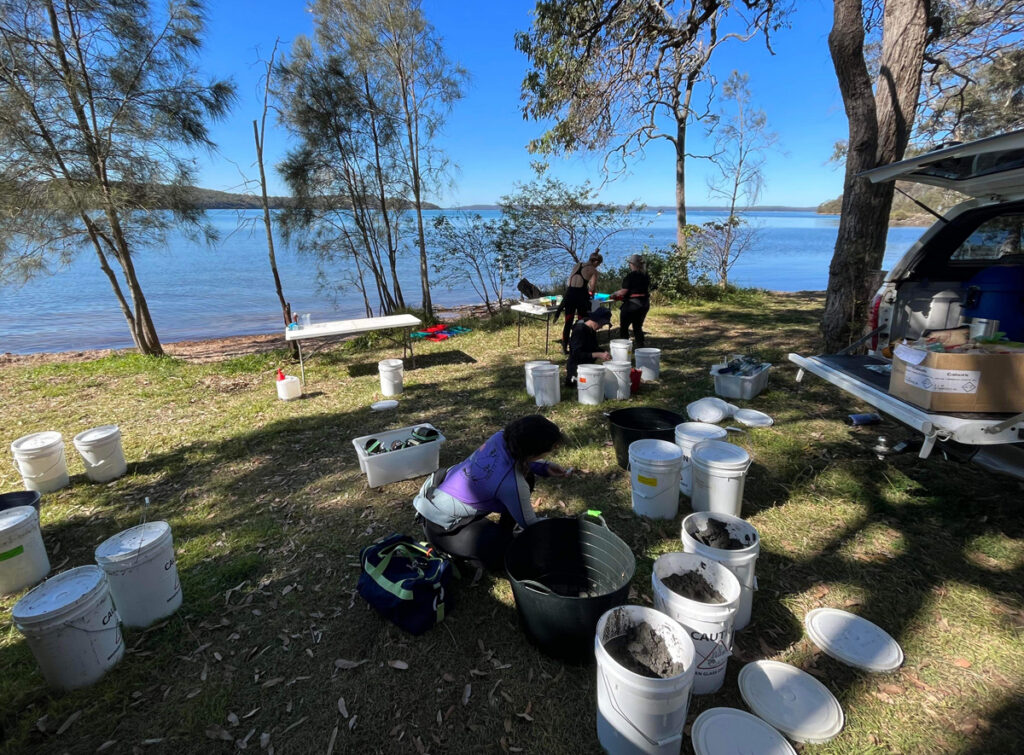
The research team collected sediments and seagrasses from different sites within Lake Macquarie before transplanting the plants into an artificially warmed area of the lake. Credit: Renske Jongen
Ultimately, the answers to these questions will help scientists better predict where seagrasses are in danger and how they might be helped. “If we lose the seagrasses, we don’t only lose the seagrasses, we lose all the other benefits that they provide,” Jongen said. “I think they deserve a little bit more attention.”
Citation: van Deelen, G. (2026), Warm waters disrupt seagrasses’ microbial environment, Eos, 107, https://doi.org/10.1029/2026EO260166. Published on 22 May 2026.
In a digital-first world, technology is no longer just a support function—it is the foundation of how businesses operate, compete, and grow. From cloud platforms and cybersecurity to collaboration tools and data analytics, organizations rely on a complex ecosystem of technologies to drive efficiency and innovation. For growing businesses, managing this environment internally can quickly become overwhelming.
Managed IT services have emerged as a critical solution, enabling organizations to offload the complexity of IT management to experienced providers. By delivering proactive support, strategic guidance, and scalable solutions, managed IT services empower businesses to focus on growth while maintaining secure, high-performing systems.
The Increasing Complexity of IT Environments
As businesses expand, their technology needs evolve rapidly. What may begin as a simple setup—basic networks, a few applications, and limited infrastructure—can quickly grow into a complex system involving cloud platforms, remote work tools, cybersecurity measures, and integrated software solutions.
This complexity introduces challenges such as:
Managing multiple systems and vendors
Ensuring consistent performance across platforms
Maintaining security across expanding networks
Supporting a growing and distributed workforce
Without the right expertise, these challenges can slow growth and introduce risk. Managed IT services provide the structure and oversight needed to manage increasingly complex environments effectively.
Supporting Scalable Growth
Growth requires flexibility. As businesses add employees, expand into new markets, or launch new products, their IT infrastructure must be able to scale accordingly. Managed IT services are designed with scalability in mind, allowing organizations to adjust resources and capabilities as needed.
Managed providers support growth by:
Scaling infrastructure to match demand
Deploying new systems and applications efficiently
Supporting onboarding for new employees and locations
Ensuring systems remain stable during periods of expansion
This scalability ensures that technology supports growth rather than becoming a bottleneck.
Enhancing Cybersecurity in a High-Risk Landscape
Cybersecurity threats are increasing in both frequency and sophistication. For growing businesses, which may lack dedicated security teams, this presents a significant risk. A single breach can result in financial loss, operational disruption, and reputational damage.
Managed IT services strengthen security by implementing:
Continuous monitoring for threats and vulnerabilities
Regular updates and patch management
Endpoint protection and firewall management
Employee training and awareness programs
By taking a proactive approach to security, managed providers help businesses protect their data, systems, and customers.
Improving Operational Efficiency
Managing IT internally often requires significant time and resources. Teams must handle everything from troubleshooting technical issues to maintaining infrastructure and ensuring system updates. This can divert attention away from core business objectives.
Managed IT services improve efficiency by:
Automating routine maintenance tasks
Providing 24/7 monitoring and support
Resolving issues quickly to minimize disruption
Streamlining IT operations through standardized processes
With fewer operational burdens, internal teams can focus on strategic initiatives that drive growth and innovation.
Reducing Costs and Improving Budget Predictability
Hiring, training, and retaining an in-house IT team can be costly, particularly for growing businesses with limited budgets. Additionally, unexpected IT issues can lead to unplanned expenses.
Managed IT services offer a more predictable cost structure, typically through a subscription-based model. This allows businesses to:
Control and forecast IT spending
Avoid large capital expenditures on infrastructure
Reduce costs associated with downtime and system failures
Access enterprise-level expertise without the overhead
This financial predictability makes it easier for businesses to plan and allocate resources effectively.
Enabling Remote and Hybrid Work
The modern workforce is increasingly distributed, with employees working from multiple locations and devices. Supporting remote and hybrid work environments requires secure access, reliable connectivity, and consistent performance.
Managed IT services enable this flexibility by:
Implementing secure remote access solutions
Supporting collaboration tools and platforms
Managing devices and endpoints across locations
Ensuring consistent user experiences regardless of location
This capability not only improves productivity but also helps businesses attract and retain talent.
Providing Access to Expertise and Innovation
Technology evolves rapidly, and staying up to date with the latest tools, trends, and best practices can be challenging. Managed IT service providers bring specialized expertise and industry knowledge that many businesses cannot maintain internally.
This includes:
Guidance on adopting new technologies
Recommendations for improving infrastructure
Support for digital transformation initiatives
Insights into industry trends and best practices
Access to this expertise helps businesses remain competitive and make informed technology decisions.
Ensuring Business Continuity and Resilience
Unexpected disruptions—whether caused by cyberattacks, hardware failures, or natural disasters—can have serious consequences. Managed IT services help businesses prepare for and respond to these events.
Providers support continuity by:
Implementing backup and disaster recovery solutions
Designing resilient infrastructure
Monitoring systems to detect issues early
Responding quickly to incidents
These measures ensure that businesses can continue operating even in the face of challenges.
Aligning IT Strategy with Business Goals
One of the most significant advantages of managed IT services is the ability to align technology with broader business objectives. Rather than taking a reactive approach, managed providers work with organizations to develop long-term IT strategies that support growth.
This includes:
Planning for future infrastructure needs
Identifying opportunities for efficiency and innovation
Ensuring technology investments deliver measurable value
Supporting overall business strategy
By aligning IT with business goals, organizations can use technology as a driver of growth rather than just a support function.
Conclusion
Managed IT services are essential for growing businesses navigating the demands of a digital-first world. By providing scalable solutions, enhanced security, operational efficiency, and strategic guidance, these services enable organizations to manage complexity while focusing on growth.
As technology continues to evolve and play an even greater role in business success, the importance of managed IT services will only increase. Businesses that invest in these services are better equipped to scale, innovate, and compete in an increasingly digital and competitive landscape.
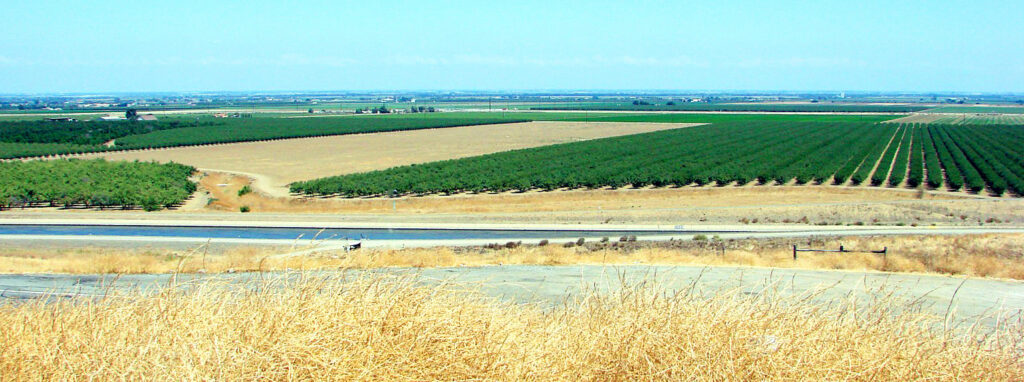
“Future winters promise less snow, more rain. Nobody’s prepared.” So proclaims the title of a recent article in the Proceedings of the National Academy of Sciences of the United States of America that frames adaptation to snow loss as the “million-dollar question” facing the western United States.
As the largest sectoral consumer of fresh water globally, agriculture is particularly vulnerable to snow loss.
Declining snowfall—and snowmelt—affects ecosystems, urban and rural water supplies, hydropower, recreation, tourism, and agriculture. As the largest sectoral consumer of fresh water globally, agriculture is particularly vulnerable to snow loss.
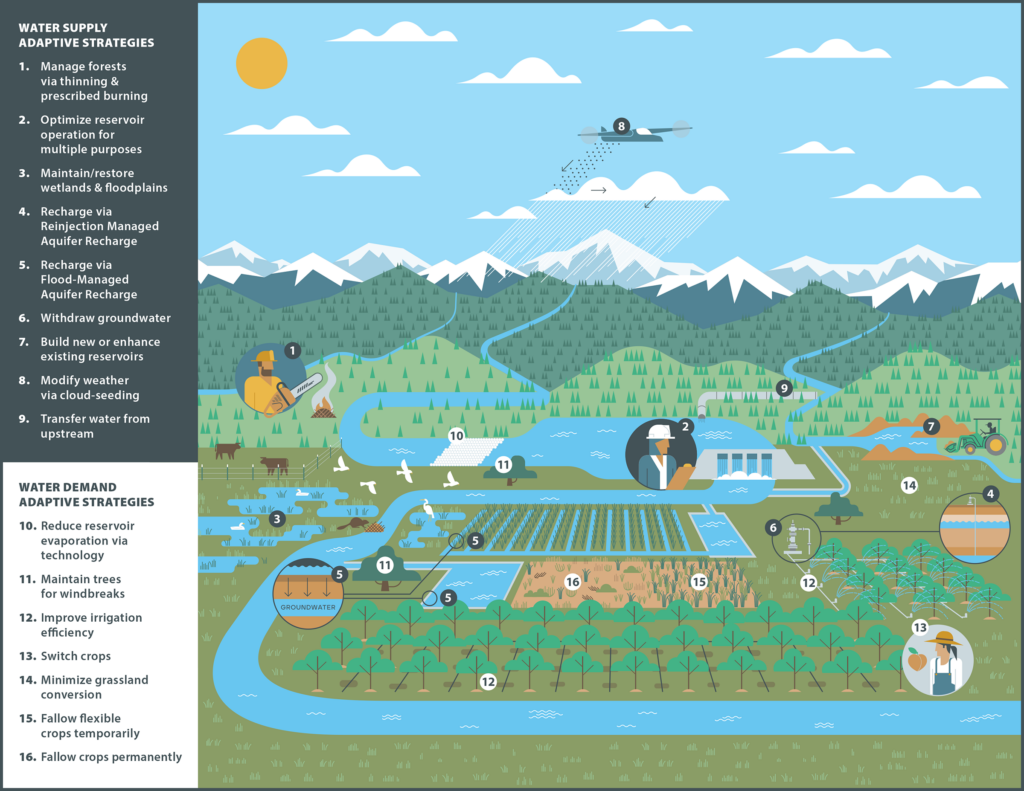
In response, water managers have developed a range of approaches for adapting to snow loss: infrastructure-based approaches like managed aquifer recharge, nature-based solutions such as forest management and beaver dam analogues, demand-side approaches like multibenefit land repurposing, and polarizing supply-side approaches like reservoir expansion and cloud seeding (Figure 1).
Fig. 1. Potential approaches to reduce negative impacts to agriculture from snow loss include a variety of adaptive strategies that address either water supply or demand. Click image for larger version.
However, efforts to identify which of these strategies to implement for different drainage basins, or watersheds, using the variety of available approaches seem to fall into one of two traps: either searching for unrealistic one-size-fits-all panaceas [Ostrom, 2007] or treating every basin as unique, which is costly and inefficient.
The “trillion-dollar question” isn’t how to adapt but, rather, where existing strategies may make the most—and fastest—difference.
Importantly, continuing along this trajectory means that we’re on track to offset only about a third of global climate-induced crop yield losses by 2100. For the western United States, previous work has estimated cumulative economic losses from declining snowfall of hundreds of billions to trillions of dollars while noting that rational adaptation decisions are hampered by the lack of financial analyses of the importance of snow [Sturm et al., 2017].
We thus suggest that the “trillion-dollar question” isn’t how to adapt but, rather, where existing strategies may make the most—and fastest—difference to offset projected losses. Answering this question requires an approach that matches strategies to the contexts where they are more likely to succeed—one that treats basins as neither uniform nor unique.
A Mismatch in Research and Operational Scales
Physical scientists tend to look at snow loss as a basin-scale problem, in part because this view aligns with hydrologic boundaries. However, as our colleague, applied economist Joey Blumberg, explains, “county lines were not drawn to follow watersheds, and rivers do not conform to political borders, creating a patchwork of mismatched boundaries.”
Scientists have long emphasized that mitigating climate change requires us to “think globally, assess regionally, act locally.” And in 1992, the authors of the Dublin Principles reasoned that moving the needle on “wicked water problems” requires targeting decisionmaking at the “lowest appropriate level,” where stakeholders can collaborate most effectively.
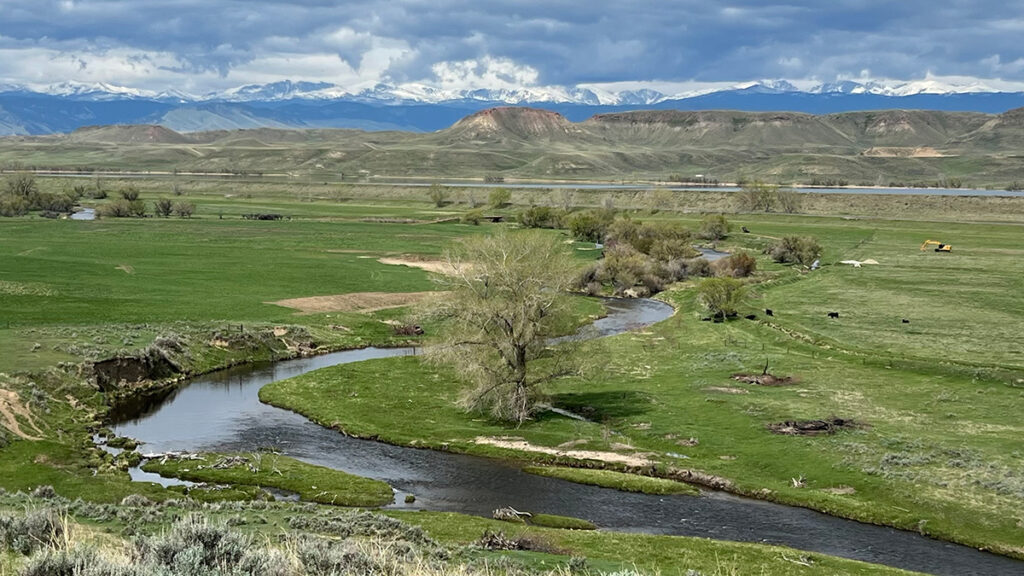
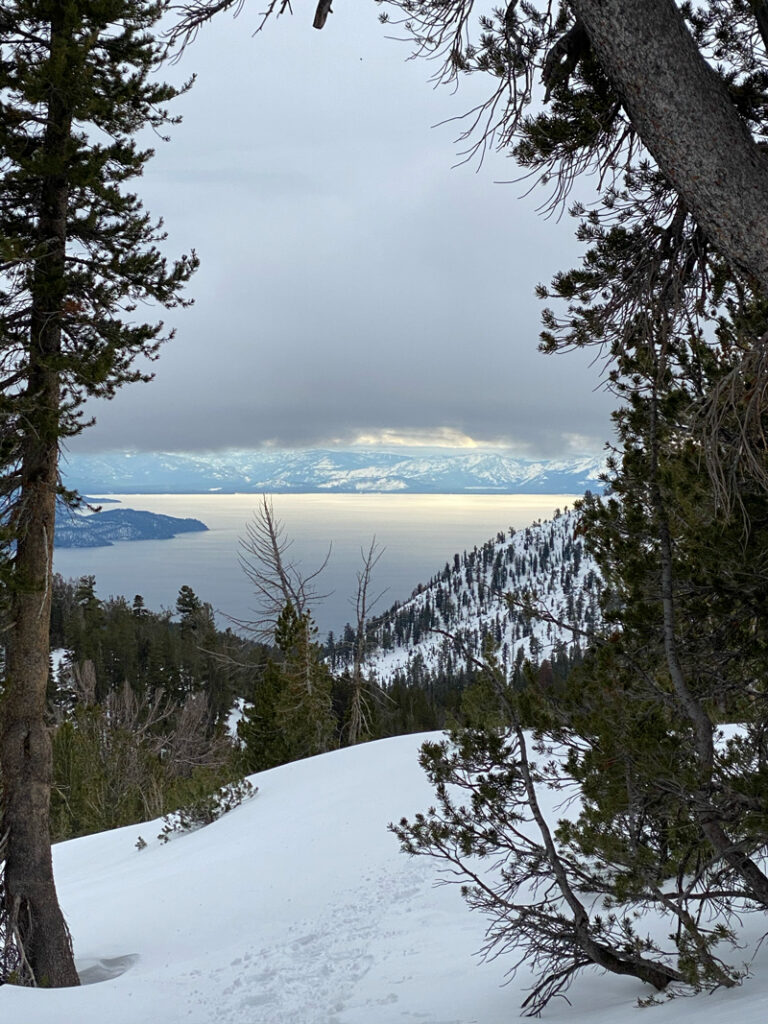
Lake Tahoe, pictured here, contains 37 trillion gallons of water, roughly half of which is supplied by snowmelt in the Sierra Nevada Mountains. Credit: Beatrice L. Gordon
Working at this scale, we found one-size-fits-all strategies often don’t hold up, even within the same hydrologic basin [Gordon et al., 2024; Boisramé et al., 2026]. In the Upper Colorado River Basin, for example, expanding reservoir storage could buffer agriculture in northeastern Utah against declining snowpack, but the same strategy may fail miles away in southwestern Wyoming, where a thirstier atmosphere may make it harder to refill existing reservoirs.
However, collecting detailed local-scale information for just 13 of the roughly 2,600 operational contexts nationwide took almost 3 years of searching websites, reading working papers, and calling water managers.
Scaling this approach across the entire western United States is understandably overwhelming. We need a more systematic approach to help managers identify which strategies could work most effectively, and where.
A Diagnostic for Agriculture and Snow Loss
Ostrom [2007] argued that complex systems, such as Western agriculture, “are partially decomposable in their structure.” This insight is woven into archetype analysis, an approach for identifying recurrent patterns across otherwise diverse systems.
Like workplace assessments—which are genuinely useful, albeit imperfect, tools for understanding successful management styles—archetypes draw on qualitative, quantitative, or hybrid approaches to group diverse operational contexts on the basis of shared characteristics [Sietz et al., 2019]. These groupings enable systematic knowledge transfer about, for example, how management strategies that work in one context can also guide adaptation elsewhere.
Three main characteristics interact to define operational contexts in snow-dependent agriculture in the western United States: physical constraints, governance systems, and human behavior.
“Researchers can empirically derive building blocks or components that comprise archetypes to represent key features of a system,” explains Elizabeth Koebele, who studies urban water sustainability [Garcia et al., 2019] and has begun applying archetypes in that context. However, she notes, these building blocks “vary based on the system context, available data, and study goal.”
We propose three main characteristics that interact to define operational contexts in snow-dependent agriculture in the western United States: physical constraints, governance systems, and human behavior. Physical constraints, including biophysical setting, infrastructure, and climate, determine available water supplies. Governance capacity relative to governance complexity shapes how those supplies are allocated across competing uses. Human behaviors influence both water demand and how users respond to supply conditions and governance rules.
Using these characteristics to establish archetypes of water management contexts could define a path forward for operationalizing an approach to accelerate successful adaptations to declining snowpacks in the West.
Constraining How Snowmelt Becomes Water Supply
Physical constraints stem from biophysical processes that influence how, when, and how much snow becomes streamflow; infrastructure that stores and conveys water; and hydrologic and climatic uncertainties about future supplies. These constraints can vary substantially from basin to basin.
Consider the Walker River Basin and California’s San Joaquin Valley, both of which rely on Sierra Nevada snowpack but have different biophysical settings. In some parts of the central Sierra, forest management can reduce wildfire risk and increase streamflow by up to 14% during low-snow years. Elsewhere, however, water made available by forest management may be consumed by remaining vegetation, limiting downstream gains.
These biophysical differences interact with uses of built infrastructure, including irrigation systems, reservoir outlets, and canals, to determine how and when water is stored and released. As temperatures warm and snowmelt declines, officials in both the Walker River and San Joaquin Valley basins must increasingly manage for a wider range of extremes, including “cold-water droughts.” However, the infrastructure to manage these trade-offs through reservoir storage and operations that balance agricultural deliveries with aquatic habitat needs is more developed in the highly managed San Joaquin than in the Walker.
Thankfully, measuring physical constraints on snowmelt at basin scales is becoming more feasible today with newly developed tools.
Layered on top of biophysical and infrastructural constraints are climatic and hydrological uncertainties, such as whether snow loss will lead to more evapotranspiration and less streamflow. These uncertainties complicate management decisions based on cost-benefit modeling of individual strategies: Should districts expand reservoir storage if precipitation is predicted to increase or decrease depending on the model? Frameworks like Decision Making Under Deep Uncertainty emphasize the need to select strategies that are robust across many possible futures.
Thankfully, measuring physical constraints on snowmelt at basin scales—a means, along with improved modeling, to reduce hydroclimatic uncertainties—is becoming more feasible today with newly developed tools. Water managers can turn, for example, to databases like the U.S. Geological Survey’s ResOpsUS [Steyaert et al., 2022], which catalogs historical reservoir operations across the contiguous United States, and to publicly available hydrologic projections such as those from Oak Ridge National Laboratory’s Coupled Models Intercomparison Project phase 6 (CMIP6) ensemble.
Governance Controls Supply Allocations
We frame governance around capacity and complexity. Capacity in this context is the ability of stakeholders “to mobilize resources in order to make equitable and fair decisions around shared challenges,” according to governance scholar Gina Gilson. Complexity refers to the number and intricacy of jurisdictions, authorities, regulations, and stakeholders involved. As governance complexity increases, the effectiveness of adaptation strategies becomes more sensitive to capacity constraints, particularly regarding timescales and funding.
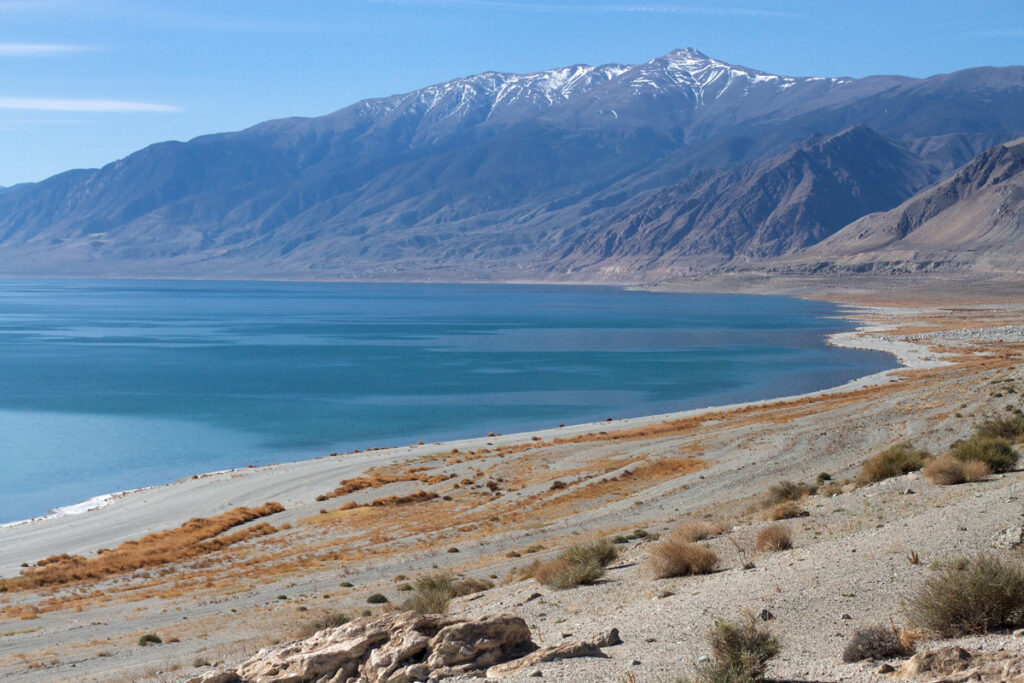
For example, infrastructure in the Walker is controlled locally by a single water district, and jurisdictional coordination involves two states and the Walker River Paiute Tribe. Coordination on water management is never simple, but fewer jurisdictions generally means faster decisionmaking and clearer authority, allowing the single water district to implement strategies like multibenefit land repurposing more readily. Such implementations, in turn, enable reduced agricultural water use, directly supporting restoration of Walker Lake and recovery of endangered species.
The San Joaquin Valley is vastly different in scale and complexity, covering eight California counties, one of which alone has 22 water districts and seven cities. Following the passage of the state’s Sustainable Groundwater Management Act, water users in the basin formed more than 120 groundwater sustainability agencies. Agricultural water management thus involves overlapping federal and state systems that operate under different rules, contracts, and regulatory requirements. Whileland repurposing programs can be implemented, more substantial capacity, time, and resources are typically needed to do so.
Emerging efforts like the Western States Water Data Access and Analysis Tool (WestDAAT) and the Harmonized Database of Western U.S. Water Rights make it easier to assess governance in a basin by standardizing data about rules, regulations, and water rights across states. Combined with mapping of irrigation service areas and water transfers [Siddik et al., 2023], these resources help stakeholders identify the jurisdictions involved, how authority is distributed, and what coordination mechanisms exist for agricultural water management.
Human Behavior Shapes Demand Responses
Once snowmelt reaches water users, behavioral dynamics—how people respond to crises, policies, and changing conditions—determine how effectively management strategies achieve desired results.
Water demand is influenced by consumption choices and by economic, political, and cultural factors.
Water demand is influenced by consumption choices and by economic, political, and cultural factors. It is also influenced by factors that typical hydrologic models rarely account for, including social structure, social memory, and affluence. More affluent users are less likely to modify their behavior to reduce water use under conditions of scarcity.
The dynamics of water demand in the South Platte River Basin, for example, are especially complex, as they are balanced across cities, agriculture, and ecosystems across parts of Colorado, Nebraska, and Wyoming. Water prices in the basin’s Big Thompson project, a federal water diversion system in northern Colorado, jumped from $1,500 per acre-foot in 1990 to more than $30,000 in 2018, driven by economic factors that resulted in cities owning 70% of water originally intended for agriculture.
Even with reliable projections of future climate and water supply, carefully planned strategies can be overwhelmed by economic and behavioral factors, resulting in transfers and reallocations of water. What’s more, behavioral responses to adaptation strategies can paradoxically increase demand when users perceive that scarcity problems are solved.
The “reservoir effect” occurs when water security perceptions encourage expansion of water-intensive activities [Di Baldassarre et al., 2018]. Similarly, the irrigation efficiency paradox shows how efficiency gains can lead to expanded production and reduced return flows (how much irrigation water returns to streams and aquifers) downstream [Grafton et al., 2018].
Conceptual frameworks, models, and global case studies have all been used as approaches to study the effects of human behavior on hydrology. With sufficient training data, we believe tools like machine learning could be used to further explore how behaviors influence adaptation and to anticipate shifts as snow loss continues.
Archetypes in Practice
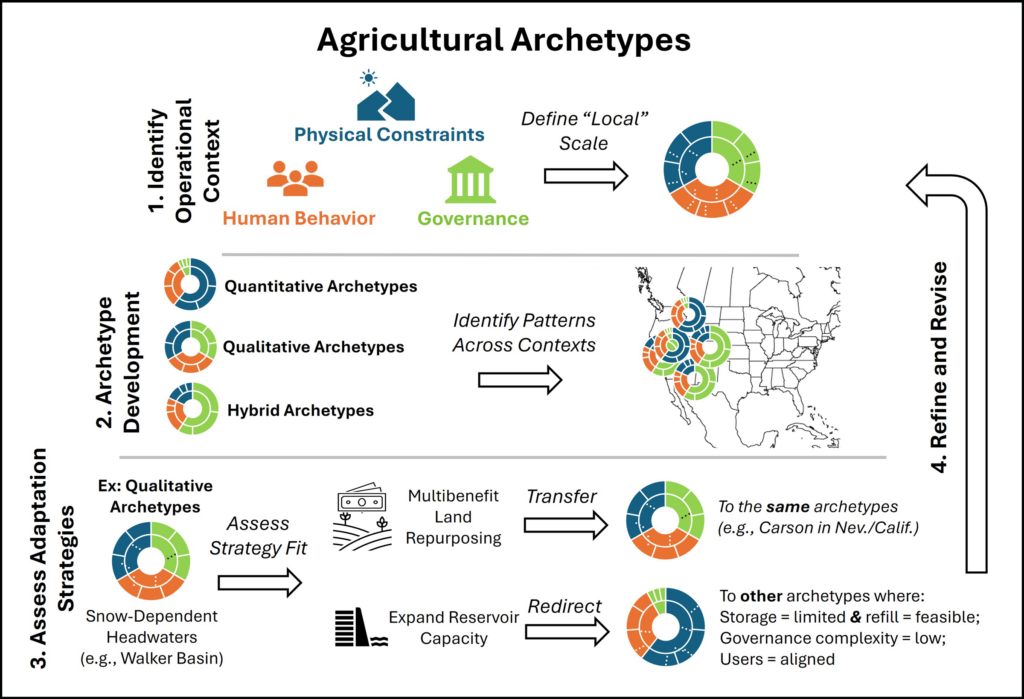
By evaluating how physical factors, governance systems, and human behavior shape outcomes across places like the Walker, South Platte, and San Joaquin basins, researchers and practitioners can establish archetypes to help identify patterns in what strategies are most effective in different places and assess how to transfer lessons from one setting to another (Figure 2).
Fig. 2. An archetype-based diagnostic grounded in evaluating the physical constraints, governance, and human behavioral dynamics affecting hydrologic basins could facilitate more rapid transfer of learning about successful adaptation approaches across snowmelt-dependent agriculture in the western United States.
The Walker River Basin exemplifies an archetype common to agriculturally dominated headwaters in the western United States with low governance complexity (few jurisdictions), adequate capacity (resources), low behavioral complexity (more predictable and unified user groups), and substantial physical constraints (significant future snow loss and limited infrastructure for water storage and supplementation).
With this profile, the Walker is an ideal testing ground for evaluating how effectively different strategies offset changes in snowmelt. Does cloud seeding increase snowpack? Could beaver dam analogues—a nature-based solution reminiscent of Idaho Fish and Game’s mid-20th century effort to parachute beavers into the wilderness—meaningfully increase water retention? Could multibenefit land repurposing buffer people and ecosystems against supply volatility while restoring ecosystem functionality?
The value of organizing operational contexts by archetypes is that each context need not be treated as unique.
The value of organizing operational contexts by archetypes is that each context need not be treated as unique. Lessons learned from the Walker could be systematically transferred to other areas with similar characteristics and could be incrementally tested in others.
The South Platte has physical constraints similar to Walker’s but features greater governance complexity because of multiple interstate compacts, as well as greater behavioral complexity. Modeling analyses indicate that demand-side strategies could adapt to more volatile water supply in the South Platte [Gharib et al., 2023]. But implementing them requires balancing perspectives from both agricultural and urban water users—a behavioral dynamic absent in Walker.
Crop switching to cultivate higher-value crops on less acreage could reduce water use. However, options for what crops can be grown where are constrained by factors like elevation and climate. Even where feasible, new crops would require investments in education, new infrastructure, risk management, and agronomic knowledge.
Through iterative expansion and testing, broad archetypes like “high behavioral complexity” could be specified to reflect dynamics like rural-urban competition or concerns around buy-and-dry economics. Archetypes may also point to contexts where governance complexity signals that decisionmaking is occurring above the lowest appropriate level.
The San Joaquin, with its extremely complex governance involving numerous local, state, and federal agencies managing surface and groundwater, is one potential example. Recognizing this pattern can help identify where substantial resources and long timelines may be required to implement programs (e.g., LandFlex) requiring legislative authorization, multiagency coordination, and stakeholder engagement. It may also signal the need to identify smaller operational contexts within larger settings so implementations proceed more rapidly.
Operationalizing Archetypes from Diagnosis to Action
Developing a systematic approach to match adaptation strategies with areas where they are most likely to succeed in operation is only a first step. Applying diagnostics without mechanisms to implement new strategies is often insufficient to drive timely action.
An instructive precedent of success in water quality management comes from the 1970s. By then, pollution controls on factories had improved compared with the early 20th century, yet water quality in surface waters across the country still declined because of pollution in agricultural runoff. The breakthrough came with the EPA’s total maximum daily load (TMDL) program, which created a structured process that set measurable goals for reducing pollution and assigned responsibility for meeting those goals to the sources of the pollution, allowing for local control over adaptation.
Archetypes could play a similar role in facilitating beneficial snow-loss adaptations, and a structure like the TMDL program could start by assessing supply-demand risks across operational areas, setting performance targets such as reservoir reliability and shortage frequency, and then using the diagnostic to identify which strategies fit each archetype. Results and lessons could be shared region-wide, while implementation would remain locally driven.
This suggestion is, emphatically, not a prescription for specific policy mechanisms. But it serves as a reminder that—just as few of us engage with workplace assessments or change behavior on the basis of their results without organizational support—archetypes will need to be paired with implementation structures to translate diagnosis into action.
Beyond Silver Bullets
There is no single answer to our trillion-dollar question, but one path forward for sustaining complex Western ecosystems lies in developing archetypes of different types of basins.
Nearly 20 years ago, Ostrom [2007] warned against seeking panaceas for complex environmental problems. There is no silver bullet for snow loss or single answer to our trillion-dollar question, but one path forward for sustaining complex Western ecosystems lies in developing archetypes of different types of basins.
A small irrigation district, for example, wouldn’t need to independently test every strategy in Figure 1 or develop complex decision support tools when a similar archetype already evaluated which strategies work under comparable governance, behavioral, and physical conditions.
Critically, these archetypes can be developed and refined by managers and scientists to capture more nuanced realities. Physically constrained systems, for example, could include areas facing high future uncertainty or limited reservoir flexibility. Governance and behavioral dimensions could likewise evolve to represent contexts where subsidies lead to incoherent incentives or where cultural norms link water use to local identities and traditions.
Like workplace assessments, the goal isn’t to diminish unique personalities but to work with them more strategically. Archetypes can show where we don’t need to reinvent the wheel to adapt and where the wheel might need to be tweaked. By leveraging collective knowledge and learning across regions facing similar challenges, rather than crafting new solutions basin by basin, we can reduce the time and resources needed to implement equitable and sustainable adaptation solutions.
Acknowledgments
This work is supported by the National Science Foundation (NSF) under grants 1828902 and OIA-2148788. Where We Live is funded by a grant from NSF’s Established Program to Stimulate Competitive Research (EPSCoR) RII Track-2 program and features partnerships across the University of Idaho (award 2316126); the University of Nevada, Reno (award 2316127); and the University of South Carolina (award 2316128). Work was also supported by internal funds from the Division of Hydrologic Resources at the Desert Research Institute.
References
Boisramé, G. F., et al. (2026), Think globally, model locally: Complex responses of agricultural water supplies to different climate projections, J. Am. Water Resour. Assoc., 62(3), e70117, https://doi.org/10.1111/1752-1688.70117.
Garcia, M., et al. (2019), Towards urban water sustainability: Analyzing management transitions in Miami, Las Vegas, and Los Angeles, Global Environ. Change, 58, 101967, https://doi.org/10.1016/j.gloenvcha.2019.101967.
Gharib, A. A., et al. (2023), Assessment of vulnerability to water shortage in semi-arid river basins: The value of demand reduction and storage capacity, Sci. Total Environ., 871, 161964, https://doi.org/10.1016/j.scitotenv.2023.161964.
Gordon, B. L., et al. (2024), The essential role of local context in shaping risk and risk reduction strategies for snowmelt‐dependent irrigated agriculture, Earth’s Future, 12(6), e2024EF004577, https://doi.org/10.1029/2024EF004577.
Ostrom, E. (2007), A diagnostic approach for going beyond panaceas, Proc. Natl. Acad. Sci. U. S. A., 104(39), 15,181–15,187, https://doi.org/10.1073/pnas.0702288104.
Sietz, D., et al. (2019), Archetype analysis in sustainability research: Methodological portfolio and analytical frontiers, Ecol. Soc., 24(3), 34, www.jstor.org/stable/26796999.
Steyaert, J. C., et al. (2022), ResOpsUS, a dataset of historical reservoir operations in the contiguous United States, Sci. Data, 9, 34, https://doi.org/10.1038/s41597-022-01134-7.
Sturm, M., et al. (2017), Water and life from snow: A trillion dollar science question, Water Resour. Res., 53(5), 3,534–3,544, https://doi.org/10.1002/2017WR020840.
Author Information
Beatrice L. Gordon (beatrice.gordon@dri.edu), Gabrielle F. S. Boisrame, Christine M. Albano, and Rosemary W. H. Carroll, Desert Research Institute, Reno, Nev.; and Adrian A. Harpold, University of Nevada, Reno
Citation: Gordon, B. L., G. F. S. Boisrame, C. M. Albano, R. W. H. Carroll, and A. A. Harpold (2026), Archetypes could accelerate agricultural adaptation to less snowpack, Eos, 107, https://doi.org/10.1029/2026EO260184. Published on 9 June 2026.
This article does not represent the opinion of AGU, Eos, or any of its affiliates. It is solely the opinion of the author(s).
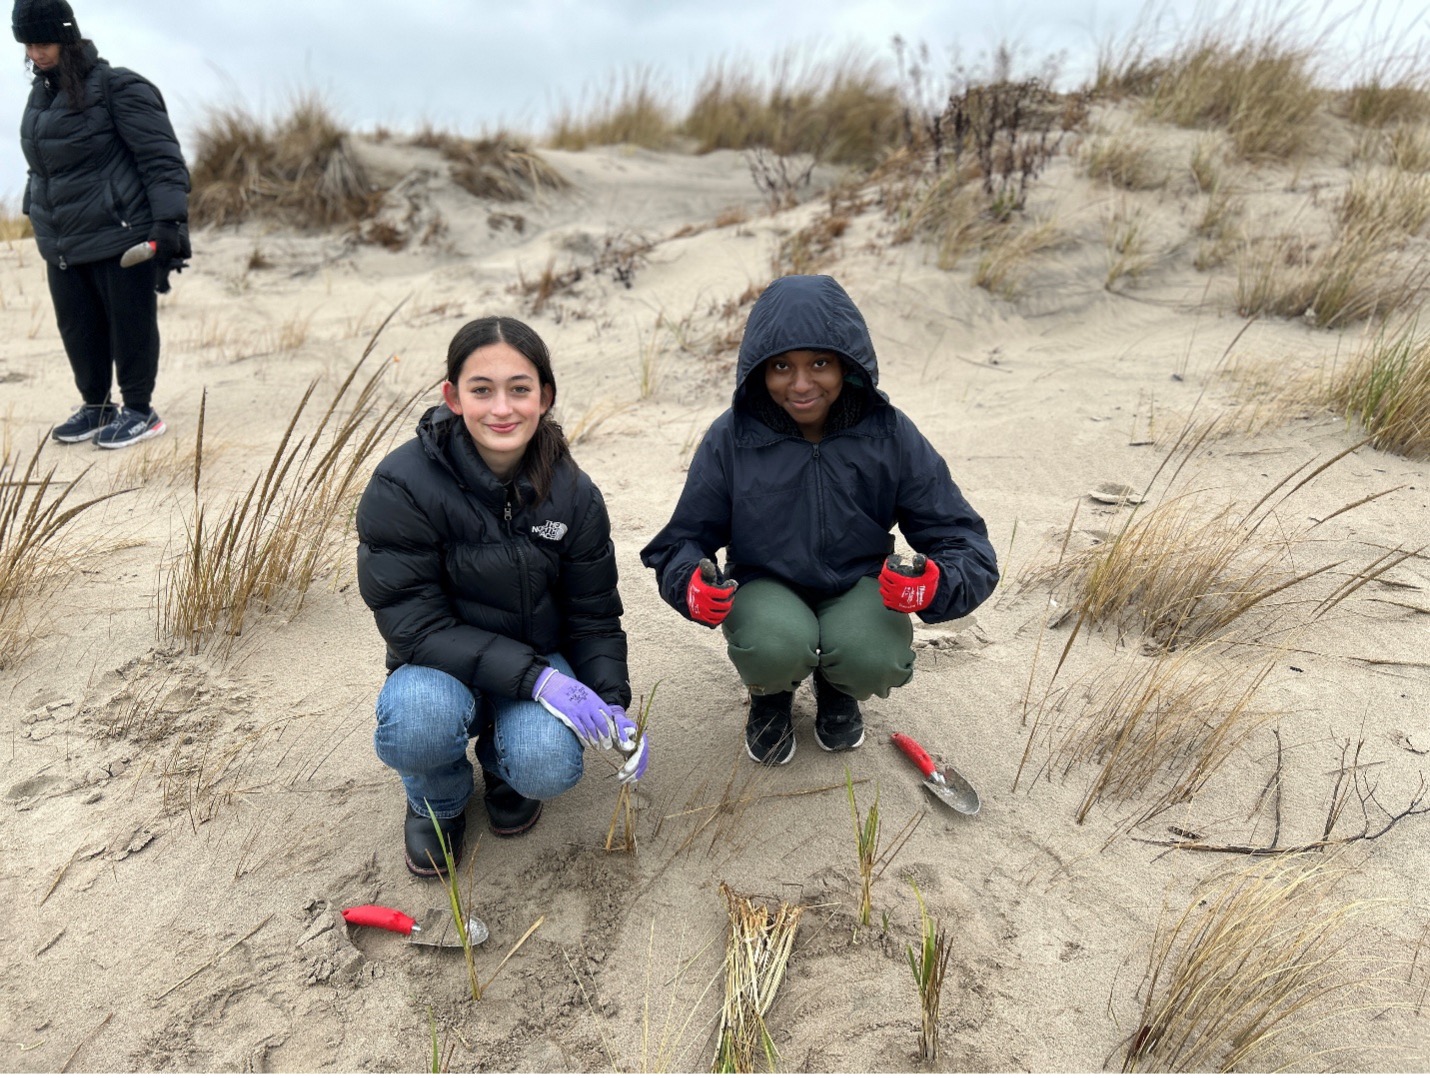
The Coney Island Creek dune planting project started in 2021, with the goal of increasing coastal resilience and giving community members hands-on experience protecting their environment.
Thirty years ago, the blockbuster movie Twister featured a group of academics putting themselves at risk by chasing tornadoes in the name of science. Although the Hollywood story entailed a surfeit of sensationalism, special effects, and unrealistic stereotypes, the movie got a few things right. Specifically, the scientists were trying to study tornadoes using a large number of spatially distributed, home-built, low-cost (and potentially sacrificial) sensors.
Today, we commonly refer to the coordinated use of tens to hundreds of similar sensors that are spread out as “large-N” sensing. Such sensor distributions have led to important advances in seismology and infrasound science, where they have improved our understanding of seismic ground motion and helped shed light on volcanic eruption dynamics [e.g., Rosenblatt et al., 2022; Anderson et al., 2023].
The benefits of large-N networks and arrays include robust spatial sampling and signal extraction from noise. They are also advantageous for detecting small signals, sensing natural hazards in remote environments, and offering critical redundancies for sensors at risk from lava or debris flows, wildfire, weather, or even malicious mammals.
Since 2013, our research group in the Department of Geosciences at Boise State University (BSU) has worked to study infrasound from geophysical phenomena by capitalizing on the benefits of low-cost, large-N sensing technology [e.g., Slad and Merchant, 2021]. More than a decade on, this effort has yielded scientific successes from a variety of environments, and it is continuing to evolve.
Large-N Sensing for Infrasound
Many violent natural processes, including landslides, volcanic eruptions, earthquakes, avalanches, and meteors, produce infrasound.
Many violent natural processes, including landslides, volcanic eruptions, earthquakes, avalanches, and meteors, produce infrasound, defined as low-frequency sound below the threshold of human hearing (less than 20 Hertz). Such events may create audible sound as well, but the subaudible band is often much more energetic in terms of sound intensity, and it has long wavelengths that can propagate long distances with little attenuation. These characteristics make infrasound especially valuable for remote sensing of natural phenomena.
Our group at BSU grew more interested in developing our own inexpensive infrasound sensing solutions after costing out technology for commercial data logging systems, the compact electronic devices that record and store sensor data. These systems can be far more expensive than infrasound transducers—the sensors that actually detect sound—themselves.
The cost element became particularly relevant after we lost instrumentation deployed at the summit of Chile’s Villarrica volcano when it erupted a 2-kilometer-tall lava fountain on 3 March 2015 [Johnson et al., 2018]. In an instant, our hardware, including seismic and infrasonic sensors and their commercial multichannel data loggers, was entombed beneath falling lava. This financial loss incentivized our work to develop low-cost loggers that would match the technical specifications and fidelity of commercial systems.
The result was the customized Gem infrasound logger, which we created using the widely available and very economical Arduino open-source electronic prototyping platform and its low–power consumption microcontroller. The Gem is an all-in-one infrasound sensor and data logger with a high dynamic range (millipascals to 100 pascals), a 100-hertz sample rate appropriate for infrasound, and a built-in GPS for precise timing and synchronization [Anderson et al., 2018].
Although we initially conceived of the Gem as an alternative to commercial loggers to be deployed as single stations or in small arrays, we quickly realized its potential for use in high-density distributed sensing arrays that enabled new detection capabilities. In particular, its small package size (it has about the dimensions and weight of a paperback novel) and its ease of deployment—simply insert alkaline batteries, place it on the ground, and turn it on—have opened opportunities for rapid, large-N deployments in difficult-to-access environments.
Early Successes for the Gem
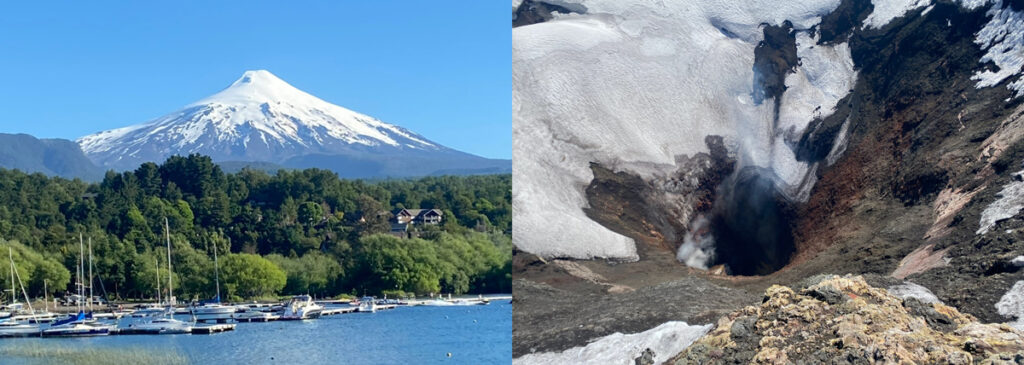
Volcán Villarrica, near Pucon, Chile, is seen in 2025 (left). The volcano regularly releases gas from a small lava lake recessed deep within the summit crater (right). Credit: Jeffrey B. Johnson
The Gem’s inaugural field mission came in January 2020 during a return to Villarrica, where activity had returned to normal following its 2015 paroxysmal eruption [Rosenblatt et al., 2022]. Typical activity in the volcano’s normal state includes open-vent degassing from a small lava lake recessed deep within the summit crater, which produces its famously powerful volcano infrasound [e.g., Johnson et al., 2012].
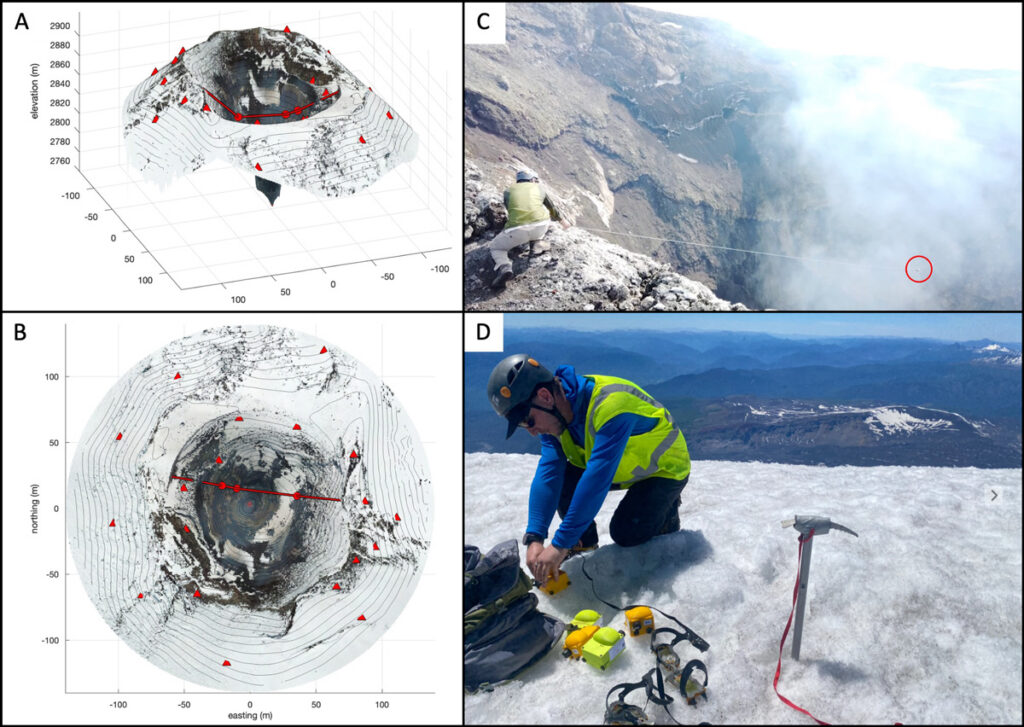
To capture Villarrica’s infrasound in detail, a four-person team from BSU climbed the 3,000-meter-tall glaciated volcano and quickly installed 16 sensors around the crater rim, as well as another 16 sensors along an 8-kilometer linear transect from the summit down the northern slope (Figure 1). This unique sensor distribution permitted us to capture the infrasound wavefield and how it interacts with topography in unprecedented detail.
Fig. 1. (a) Oblique and (b) plan views of Villarica’s summit region were created from structure-from-motion surveys in 2020. Red triangles and circles indicate locations of Gem sensing packages. (c) Also in 2020, Jake Anderson adjusts a cable suspended across the volcano’s crater that held a Gem sensor (circled). (d) In 2025, Jerry Mock unloads Gem systems at Villarica’s summit during another data collection campaign there. Click image for larger version. Credit: Jeffrey B. Johnson
Deploying such an array configuration using much heavier, larger, and power-intensive conventional instruments would have taken far more time and resources, as well as a bigger group. With the Gems, however, the installation was feasible for our small team, each member of which could easily carry eight instruments and the batteries needed to power them.
To monitor volcanoes with infrasound, it is necessary to understand the influence of atmospheric effects.
Once in place, these sensors collected continuous data during the 2-week study that were used to quantify the diffraction of sound coming out of the volcanic crater [Rosenblatt et al., 2022] and to measure the sound’s attenuation as it propagated away. Such studies are important for investigating time-varying atmospheric parameters such as changing temperatures and winds, which can affect infrasound transmission, diminishing its amplitude or even—in extreme cases—completely silencing it in an acoustic shadow zone [Johnson et al., 2012]. To monitor volcanoes with infrasound, it is necessary to understand the influence of atmospheric effects.
Months later, another opportunity arose to demonstrate the Gems’ capability for large-N infrasound sensing. During the early days of the COVID-19 pandemic, on 31 March 2020, a magnitude 6.5 earthquake occurred near Stanley, Idaho. The earthquake, the largest in the state since 1983, kicked off an energetic aftershock sequence, with more than 700 magnitude 3 or greater earthquakes occurring in 6 months. Most of these events produced significant local infrasound radiation, or “airquakes,” caused by ground-atmosphere coupling [e.g., Johnson et al., 2020].
Pandemic-related precautions inhibited a large team from venturing as a group into the field. However, a lone BSU researcher (coauthor Jacob Anderson), trudging through forest terrain and deep snow on skis, was able to deploy and activate 22 Gems in less than 4 hours in early April, thanks in part to the sensors’ compact size and ease of deployment.
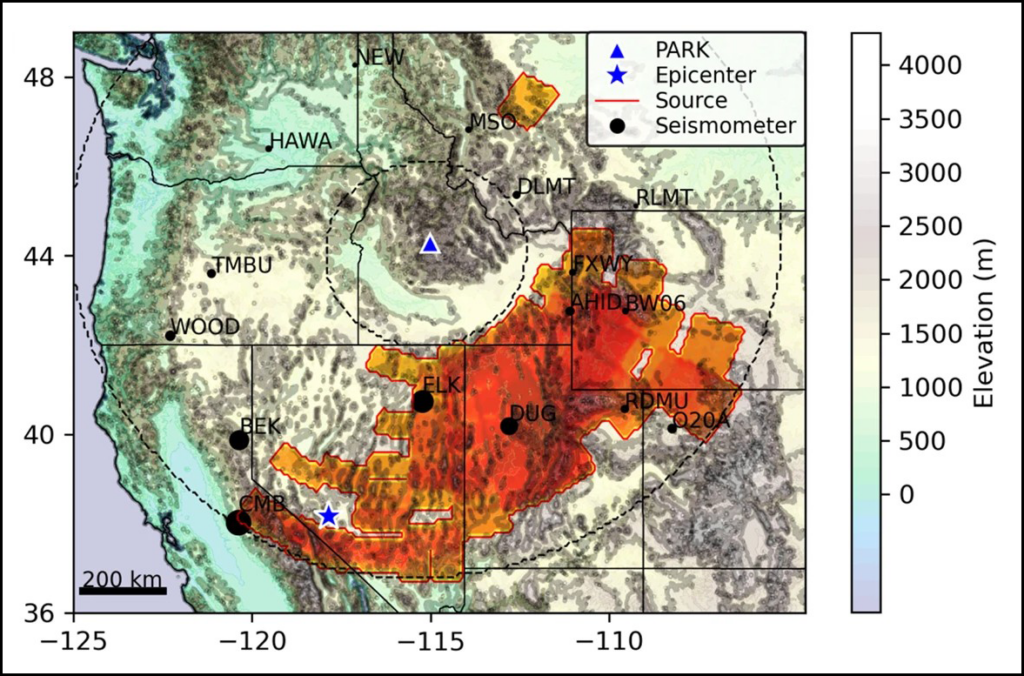
This array captured hundreds of local infrasonic aftershocks within about 25 kilometers of their epicenters. It also recorded a far larger event 700 kilometers away, the 15 May magnitude 6.5 Monte Cristo earthquake in Nevada. The array detected the epicentral infrasound from the distant earthquake source, as well as infrasound from numerous secondary sources, including mountain ranges throughout the western United States that reradiated the ground motion as infrasound (Figure 2) [Anderson et al., 2023].
Fig. 2. This map shows source region(s) of infrasound associated with the May 2020 Monte Cristo earthquake in Nevada that was detected by an array of Gem infrasound sensors deployed at the PARK site near Stanley, Idaho. Click image for larger version. Credit: Adapted from Anderson et al. [2023], CC BY 4.0
Detecting all these distinct signals was possible because of the enhanced array processing capabilities provided by the large number of sensors. Anderson et al. [2023] showed that when the data were processed from 3-sensor subsets of the 20+-sensor array—instead of from the whole array—it was possible to detect only the most intense earthquake infrasound arrivals. In other words, the larger array had much greater fidelity and sensing capabilities than smaller distributions of sensors.
During its 2-month deployment, the Stanley array also detected sounds from other distant nonearthquake sources, including waterfalls 195 kilometers away and thunder more than 900 kilometers away [Scamfer and Anderson, 2023]. Such enhanced detections, facilitated by large-N sensing, demonstrate an improved capacity to monitor a range of Earth phenomena continuously over a wide range of distances.
Putting Sensors in Harm’s Way
Since those proof-of-concept deployments, Gems have been used to monitor snow avalanches, lahars, river flow discharge, stratospheric sounds (while mounted aboard a solar balloon), and numerous volcanoes during field experiments [e.g., Tatum et al., 2023; Bosa et al., 2024; Rosenblatt et al., 2022; Brissaud et al., 2021]. Given their ease of use, small size, and low replacement cost, they’ve also been tested in hazardous environments where the risk to more expensive hardware could be considered unreasonable.
The motivation to put sensors in harm’s way is to gain insight into geophysical phenomena by recording subtle signals close to the source that may not be detectable from farther away.
The motivation to put sensors in harm’s way is to gain insight into geophysical phenomena by recording subtle signals close to the source that may not be detectable from farther away. For example, at Villarrica, Rosenblatt et al. [2022] suspended a Gem on a cable 100 meters above a lava lake to collect infrasound data from a unique, bird’s-eye perspective over the crater (Figure 1c). (Stringing the cable across the crater proved far more challenging than deploying the sensor itself, which slid down the cable until finding its resting place at the bottom of the cable’s arc.)
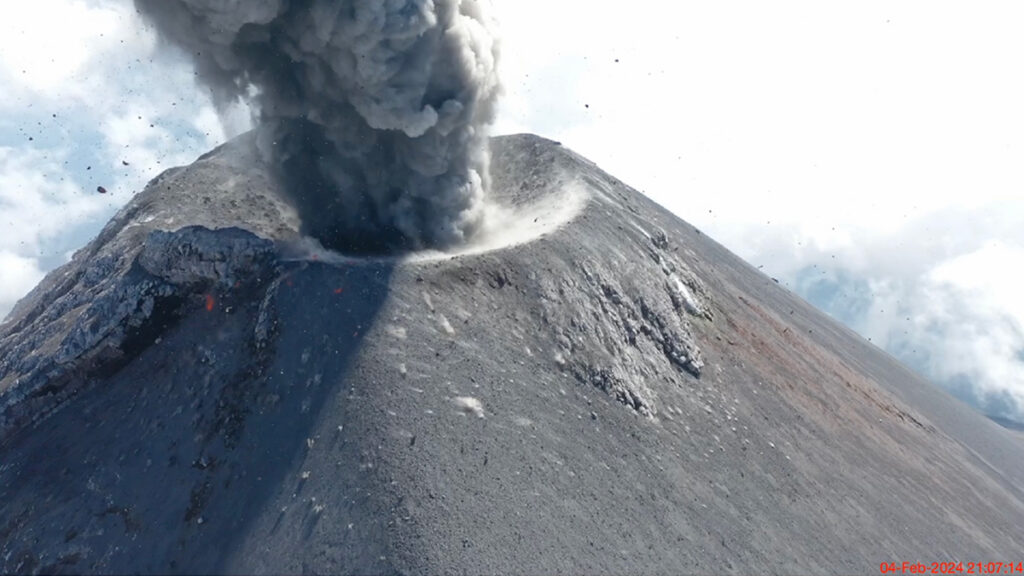
In another case, we landed a pair of Gems on the ground near a frequently exploding crater at Fuego volcano in Guatemala using a drone (see video below). We later retrieved one of the sensors from high on the volcano’s flanks. Another was lost because high winds initially posed too great a risk to fly the drone back for it. Then the following day after the wind subsided, we could not locate the stranded Gem, which was probably a casualty of a nighttime explosion.
Drone footage and infrasound recordings were collected during an explosion of Fuego volcano on 4 February 2024. Pa = pascals. Credit: video: Jerry C. Mock; animation and infrasound: Jeffrey B. Johnson
Our group at BSU also has nascent interest in using Gems to study fire in natural environments. Wildfires produce infrasound from a spatially extensive source region corresponding to actively burning areas. Because of the source complexity and the fact that fire infrasound is low amplitude and tremor-like [Johnson et al., 2025], enhancing signal-to-noise ratios in recorded infrasound is critical. This enhancement is enabled by using large-N monitoring networks, making infrasound wildfire surveillance a promising area of investigation.
Low-cost, rapid infrasound deployments could one day be used as an effective operational tool.
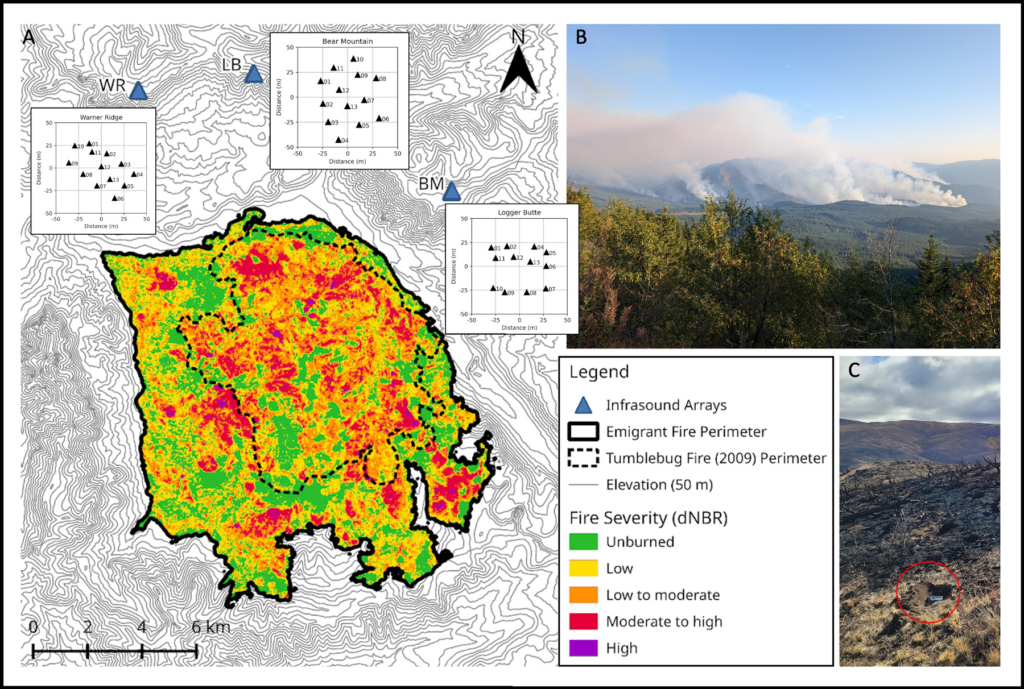
Toward this objective, our group installed 76 sensors ahead of a prescribed burn in Reynolds Creek, Idaho, in October 2023 to begin developing infrasound as a tool for monitoring and mapping wildfire. We have also deployed Gems for infrasound studies of naturally occurring wildfires, such as the Emigrant wildfire in Oregon in August and September 2025 (Figure 3). During that active wildfire response, a team safely and quickly installed tens of sensors within a matter of hours in an area facing dynamic hazards from the rapidly expanding fire, which eventually covered 33,000 acres (about 13,354 hectares). Luckily, no instruments were lost, and the data have shown the potential to track a wildfire as it advances.
Preliminary results suggest that low-cost, rapid infrasound deployments could one day be used as an effective operational tool. For example, in firefighting responses, infrasound might complement intermittent aerial observations, from aircraft or drones, because it provides a continuous record of fire activity. Infrasound surveillance might also be able to “hear” combustion sources within a burn area that is obscured to optical sensing because of clouds or nightfall.
Fig. 3. (a) The spread and severity of the 2025 Emigrant Fire in Oregon, as calculated from prefire (21 August) and postfire (18 October) Sentinel-2 satellite images, are shown. Inset maps show the distribution of 37 Gem sensors rapidly deployed in three arrays. (b) Smoke from the fire rises from the landscape on 31 August during deployment of the sensors. (c) Following the fire, one sensor that had been melted by the fire was recovered with its data card still intact (red circle). dNBR = differenced normalized burn ratio. Click image for larger version. Credit: (a) and (b): Madeline A. Hunt; (c): Jacob F. Anderson
The Evolution of Low-Cost Sensors
Five years ago, the single-sensor Gem was a cutting-edge infrasound logging solution. While it remains a powerful and economical tool for large-N arrays and for sensing in hostile environments, it is evolving.
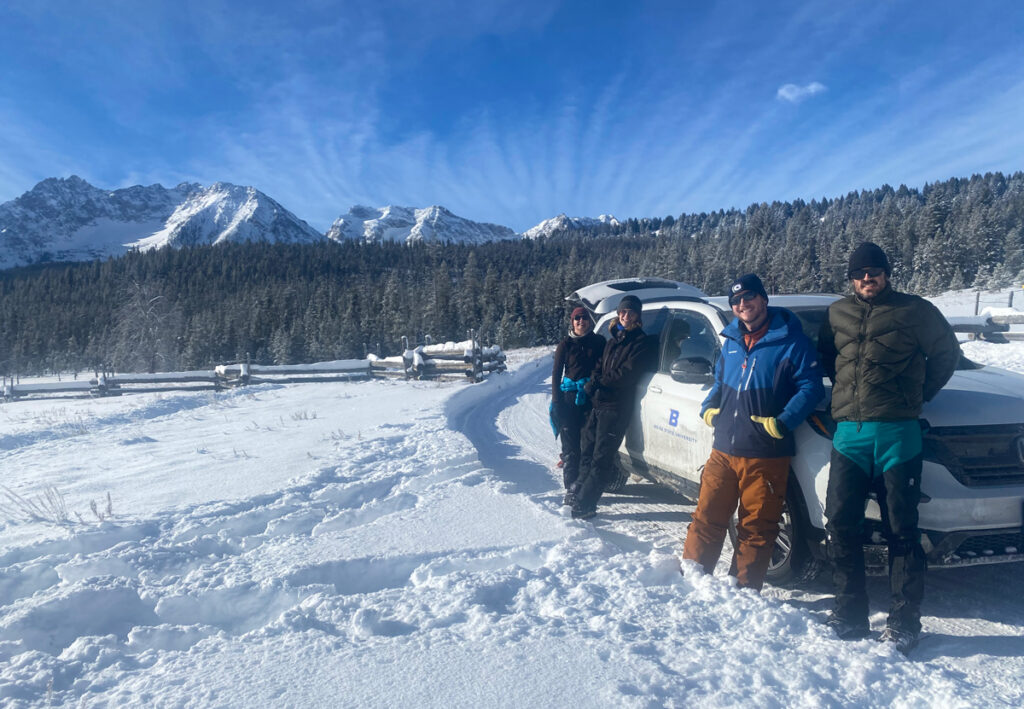
Boise State University researchers (left to right) Madeline Hunt, Owen Walsh, Jerry Mock, and Jacob Anderson prepare to deploy Gem sensors in Idaho’s Sawtooth Mountains in January 2024. Credit: Jeffrey B. Johnson
We have now developed the Gem into an even more versatile version called the Aspen, which can log four independent sensors at a sample rate of 200 hertz, double that of the Gem. The Aspen retains the small size, low weight, low power consumption, and low cost of the Gem, but with the capability to record higher-resolution 24-bit, time-synchronized data from a triaxial seismic sensor and an infrasound transducer.
Recording synchronous seismoinfrasonic data on the same logging platform offers the advantage of sensing both ground shaking and infrasonic oscillations. The ability to measure waves propagating in the ground and in the air simultaneously could facilitate work in the growing field of environmental seismology, which focuses on geophysical sources at Earth’s surface like debris flows and volcanoes.
Although we have focused on seismoacoustic geophysical measurements in our work, the concept of gathering data with low-cost instrumentation in harm’s way or from coordinated arrays of numerous sensors holds promise across Earth and environmental sciences. Such approaches could be used, for example, with tiltmeters (which measure slope changes), gravity meters, or near-infrared thermometers (e.g., optical pyrometers), all of which would offer additional data streams complementing seismoacoustic observations in geophysical studies of volcanoes.
With the diversity of emerging uses, it’s clear that large-N sensing—infeasible or cost prohibitive in many cases until recently—could transform how we measure many facets of Earth, helping to reveal the inner workings of volatile volcanoes, twisting tornadoes, and more.
Acknowledgments
More information about low-cost infrasound sensing solutions can be found at https://sites.google.com/boisestate.edu/infravolc/home. Development of the Gem infrasound logging platform was supported by a grant from the National Science Foundation (EAR-2122188).
References
Anderson, J. F., et al. (2018), The Gem infrasound logger and custom‐built instrumentation, Seismol. Res. Lett., 89(1), 153–164, https://doi.org/10.1785/0220170067.
Anderson, J. F., et al. (2023), Remotely imaging seismic ground shaking via large-N infrasound beamforming, Commun. Earth Environ., 4(1), 399, https://doi.org/10.1038/s43247-023-01058-z.
Bosa, A. R., et al. (2024), Dynamics of rain-triggered lahars and destructive power inferred from seismo-acoustic arrays and time-lapse camera correlation at Volcán de Fuego, Guatemala, Nat. Hazards, 121, 3,431–3,472, https://doi.org/10.1007/s11069-024-06926-1.
Brissaud, Q., et al. (2021), The first detection of an earthquake from a balloon using its acoustic signature, Geophys. Res. Lett., 48, e2021GL093013, https://doi.org/10.1029/2021GL093013.
Johnson, J. B., et al. (2012), Probing local wind and temperature structure using infrasound from Volcan Villarrica (Chile), J. Geophys. Res., 117, D17107, https://doi.org/10.1029/2012JD017694.
Johnson, J. B., et al. (2018), Forecasting the eruption of an open-vent volcano using resonant infrasound tones, Geophys. Res. Lett., 45, 2,213–2,220, https://doi.org/10.1002/2017GL076506.
Johnson, J. B., et al. (2020), Mapping the sources of proximal earthquake infrasound, Geophys. Res. Lett., 47, e2020GL091421 , https://doi.org/10.1029/2020GL091421.
Rosenblatt, B. B., et al. (2022), Controls on the frequency content of near-source infrasound at open-vent volcanoes: A case study from Volcán Villarrica, Chile, Bull. Volcanol., 84(12), 103, https://doi.org/10.1007/s00445-022-01607-y.
Scamfer, L. T., and J. F. Anderson (2023), Exploring background noise with a large‐N infrasound array: Waterfalls, thunderstorms, and earthquakes, Geophys. Res. Lett., 50, e2023GL104635, https://doi.org/10.1029/2023GL104635.
Slad, G., and B. Merchant (2021), Evaluation of Low Cost Infrasound Sensor Packages, Sandia Rep. SAND2021-13632, Sandia Natl. Lab., Albuquerque, N.M., https://doi.org/10.2172/1829264.
Tatum, T., J. F. Anderson, and T. J. Ronan (2023), Whitewater sound dependence on discharge and wave configuration at an adjustable wave feature, Water Resour. Res., 59, e2023WR034554, https://doi.org/10.1029/2023WR034554.
Author Information
Jeffrey B. Johnson (jeffreybjohnson@boisestate.edu), Jacob F. Anderson, Madeline A. Hunt, Owen A. Walsh, and Jerry C. Mock, Department of Geosciences, Boise State University, Idaho
Citation: Johnson, J. B., J. F. Anderson, M. A. Hunt, O. A. Walsh, and J. C. Mock (2026), Sensing the sounds from Earth’s hazardous environments, Eos, 107, https://doi.org/10.1029/2026EO260142. Published on 8 May 2026.
It’s been more than a decade since Michael Gollner and his colleagues first watched a viral YouTube video of a fire tornado fueled by Jim Beam bourbon.
A warehouse in Kentucky had just been struck by lightning, funneling almost a million gallons of the flammable spirit into a nearby retention pond. As the flames whipped across the surface of the water, however, something in the atmospheric stars aligned: The flames coalesced into a towering fire whirl, more commonly known as a fire tornado.
“We saw that and went, ‘Wow, that would be a neat application’” for cleaning up oil spills, said Gollner, a mechanical engineering professor at the University of California, Berkeley Fire Research Lab. “I wonder if we could do that on purpose.”
They could, in fact. As Gollner and his collaborators recently reported in Fuel, fire whirls offer the potential to clean up oil spills more quickly and cleanly than existing methods.
Oil spill responses depend on fast, immediate action. After just 24 hours, crude oil naturally absorbs water and begins to sink beneath the waves, wreaking havoc on marine life.
Alongside other major techniques, such as containment and recovery and chemical dispersal, in situ burning via “fire pools” has been adopted as an imperfect but unavoidable tool for addressing oil spills. Fire pools stop the spread of an oil spill but send clouds of smoke into the atmosphere and leave behind a layer of tar that sinks to the seafloor.
The European Space Agency’s Envisat satellite captured an image of the Deepwater Horizon oil spill 1 week after the accident. Credit: European Space Agency, CC BY-SA 3.0 IGO
Fire Away
If it’s far from shore, there are few methods other than basically corralling it up and burning it.”
Environmental agencies like the Bureau of Safety and Environmental Enforcement (BSEE) “were very excited about the concept of putting a change to what had been the standard for cleanup since the Exxon Valdez,” Gollner said. “There’s good knowledge, there’s an oil spill conference every year.…But if it’s far from shore, there are few methods other than basically corralling it up and burning it.”
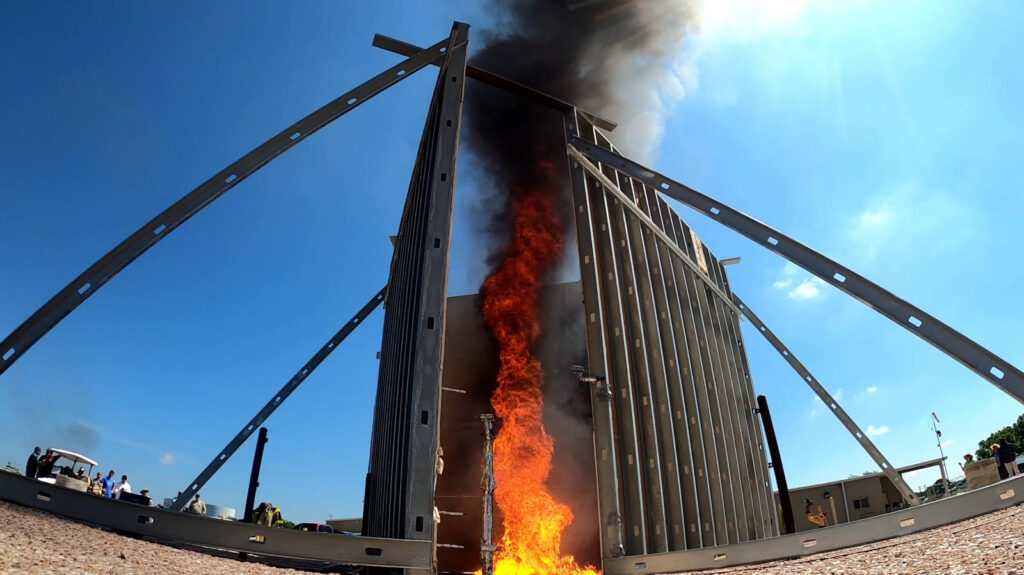
In May 2023, Gollner, Texas A&M aerospace engineering professor Elaine Oran, and two dozen others congregated at the Texas A&M Engineering Extension Service’s (TEEX) Brayton Fire Training Field in collaboration with BSEE. The team erected a trio of 5-meter walls that would channel air flow above a central pool of water, about 3 meters square and 1.2 meters deep, topped by either a 15- or 40-millimeter layer of oil. The scale of the setup was a far cry from traditional fire whirl experiments, which take place mostly in laboratories.
“Everything’s bigger in Texas,” Gollner said.
The three walls, constructed with gaps in just the right places, caused air drawn in by the flames to spiral into a swirling, combusting tower. The intense whirlwinds effectively acted as a vortex furnace, increasing burning rates by 40% compared to traditional fire pools while also vaporizing many of the particles that would have polluted the air: Emissions of PM2.5, or particles smaller than 2.5 micrometers across that can be harmful to human health, were 40% lower in the fire whirl experiments than in pool fires.
A team built fire tornadoes like this one in a custom-built, three-walled chamber at the TEEX Brayton Fire Training Field. Credit: Wuquan Cui/Michael Gollner
Cameras recording the fire whirl did their best to survive the experiment. Credit: Wuquan Cui/Michael Gollner
Why these soot reductions occur is still largely a mystery; probing this question would require building a novel laboratory apparatus to take measurements from within the flame itself, Gollner explained. In the field experiments, meanwhile, one of the fire whirls managed to consume 95% of the available fuel, though the remaining tests extinguished prematurely, lowering the overall rates. Ambient wind conditions on the days of the experiments may also have had some effect.
Summoning a fire whirl in even semi-ideal conditions on the outskirts of College Station, Texas, remains a far simpler task than manifesting one in the thick of a disaster: Towing a three-walled tornado generator onto open water becomes as much a question of marine and naval engineering as of fire science. In the experiment at TEEX, the captive firenado rose to the full length of the 5-meter walls; lower walls could make a floating rig easier to transport, but the resulting mix of oxygen and fuel could actually make subsequent air pollution worse, not better.
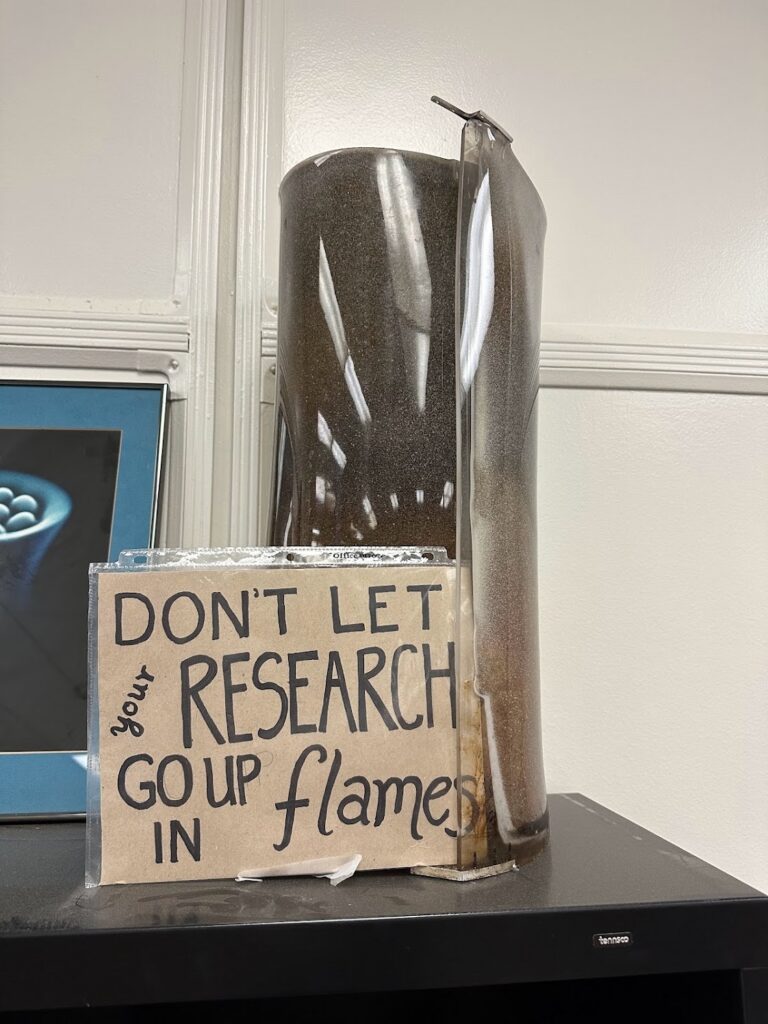
Years ago, while attending a fire safety conference, Michael Gollner received a frantic call: An experiment back in Maryland had resulted in boilover, splashing the walls and burning up a piece of lab equipment. Gollner has kept the charred remnant ever since, and on his computer, a photo of it is labeled “Don’t let your research go up in flames.” Credit: Michael Gollner
Ali Rangwala, a professor of fire protection engineering at Worcester Polytechnic Institute (WPI) who was not involved with the project, also encourages scientific due diligence. A fire whirl “works very well if the boundary conditions are fixed and well-engineered,” he said in an email to Eos, adding that these whirls have yet to be tested on open water with waves and that the required infrastructure may be costly. (Rangwala helped conduct fire whirl experiments with Gollner at WPI but has not maintained a relationship with the project.)
“The honest fact is that this is a disaster-driven field,” Gollner said. One of the largest oil spills in history, the Deepwater Horizon spill, unleashed more than 750 million liters (200 million gallons) into the Gulf of Mexico. That was in 2010. “We haven’t seen a big oil spill for a long time, and interest in it has wavered.…We require a more interdisciplinary team and more testing. Does anyone have the appetite? Unfortunately, I think it will come with time, when we have another accident.”
Blazing a Trail
Gollner stressed the critical value of fundamental research—of lines of inquiry driven by fascination, not just application. What started as a pure appreciation of a natural wonder has the potential to change fields in ways that researchers have yet to imagine.
“Swirling or not, flames are beautiful,” Gollner said. “It is a natural flow tracer. I can see the fluid mechanics and the combustion interacting.…All the physics, all in one: It’s just beautiful.”
—Jonathan Feakins, Science Writer
Citation: Feakins, J. (2026), The fiery tornadoes that could mop up oil spills, Eos, 107, https://doi.org/10.1029/2026EO260158. Published on [DAY MONTH] 2026.
