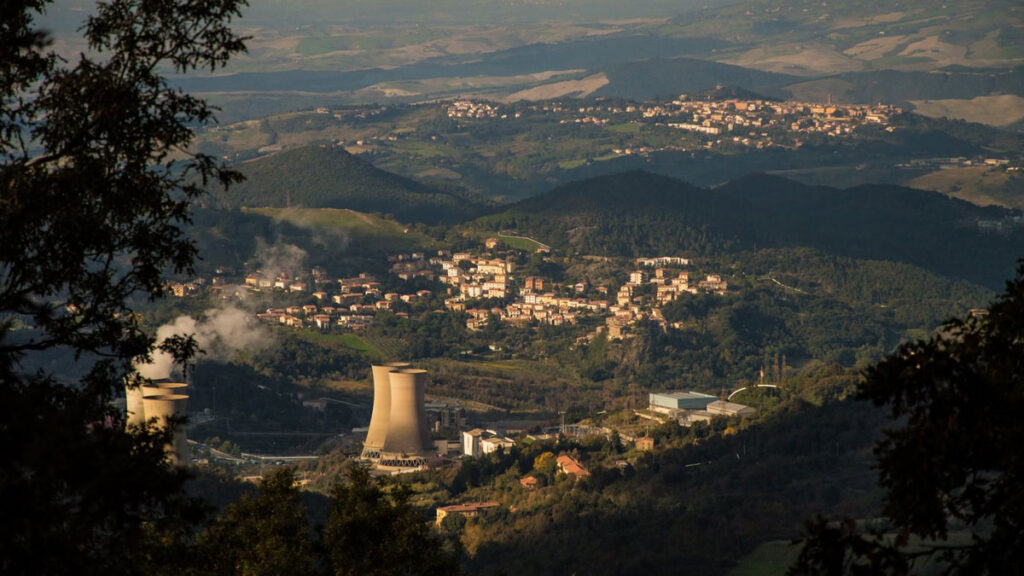
It’s long been clear that Italy’s Larderello region is supplied with abundant heat from Earth’s interior. The area, located in the center of Tuscany, is home to the world’s very first geothermal power plant and once bore the nickname “Devil’s Valley” for the steam vents that dot the rolling landscape.
The source of all of that heat has never been clear because the region has little volcanic activity. But now, new research points to the existence of a massive reservoir of magma, thousands of cubic kilometers in volume, hiding beneath Larderello.
“It’s beautiful to think that in a few hundred thousand years, we might find a supervolcano in there.”
The reservoir was discovered by University of Geneva geophysicist Matteo Lupi and his colleagues using a relatively new technique called ambient noise tomography (ANT). With ANT, the researchers peered deeper beneath the crust in the region, discovering anomalies that pointed to large volumes of magma.
The reservoir sits about 10 kilometers beneath the surface and is around 20 kilometers in diameter, the authors reported in a paper published in CommunicationsEarth and Environment. Those dimensions make the reservoir comparable in size to those underlying so-called supervolcanoes like Yellowstone and Toba, though Lupi said there’s no apparent danger of an eruption anytime soon.
“I don’t think that, in human time frames, we should change the way we perceive the area,” he said. “Nevertheless, it’s beautiful to think that in a few hundred thousand years, we might find a supervolcano in there as well.”
Listening for Magma
Previous studies had posited the existence of large amounts of magma somewhere beneath Tuscany but never provided definitive evidence. A borehole project that concluded in 2018 revealed sudden temperature increases several kilometers down. Other studies using seismic vibrations to infer the structure of the crust in the region hinted at the presence of magma.
Lupi, along with colleagues in Italy, has been working to expand the use of ANT in Tuscany and elsewhere to make new and better images of structures deep underground. The technique involves using a network of seismometers to pick up on surface waves traveling through Earth that record a kind of background noise created by wind, ocean waves, and other subtle forces. Then, statistical algorithms help scientists find relevant seismic signals amid the static.
“Surface waves are sensitive to the shear properties of the rock,” said Brandon Schmandt, a geophysicist at Rice University who wasn’t affiliated with the research. “If you heat something or introduce a little melt, the shear properties weaken a lot. And so it’s a good way to find a big magma reservoir [in Earth’s crust].”
Using more than 60 seismometers spread across Tuscany and islands just offshore, Lupi and his team cross correlated surface wave data to produce a map of seismic velocities beneath Larderello. That map contains a large blob where seismic signals travel markedly slower than in other places. Those speeds align with a body of partially melted rock, Lupi said, surrounded by a region of slightly cooler and more solid “crystal mush.”
The researchers estimate the reservoir is about 5,000 cubic kilometers in volume, with molten rock making up about 80% of its innermost contents and about 20% of the surrounding crystal region.
A Missing Supervolcano?
The magma reservoir’s existence provides an explanation for the abundant geothermal activity in the Larderello region while simultaneously raising another question. The quantity of magma discovered could fuel a massive eruption on the scale of other supervolcanoes worldwide—yet no supervolcano exists in Tuscany.
Why Tuscany doesn’t host a caldera similar to Yellowstone in the United States is still an open question. There are several nonexclusive possibilities for the lack of eruptivity, said Federico Farina, a geologist and professor of geochemistry at the University of Milan who was also an author of the study. The magma under Larderello might be drier and therefore less eruptive, or it could have been produced, and therefore intruded into the crust, more slowly. Additionally, the structure of the crust in the region could have helped to trap the magma and prevent it from getting out.
Another clue to the region’s geological history comes from dating zircons, small crystals formed when magma cools and hardens. Farina has found zircons with different ages very close to each other in the rock matrix, which he said indicates a long-lived system where magma moves through different reservoirs as it cools. He said these zircons may also enable the researchers to model the size of the reservoir and better understand the speed and amount of magma accumulation there.
More to Come
Discovering so much magma underneath Tuscany is a surprise, but Lupi thinks it’s likely to be far from the only large magma reservoir hiding beneath a volcanically quiet region. He noted that research he carried out in the Andes around a decade ago also suggested, though not conclusively, the existence of a large, hidden magma reservoir. That experience was, in part, what convinced him to use ANT’s deep imaging capabilities elsewhere.
“This is good momentum to encourage people to look at it from a magmatic system standpoint and not just focus on the vents at the surface.”
Schmandt agreed that large reservoirs are likely to exist in other places even when there’s little for human eyes to see. “This is good momentum in that direction to encourage people to look at it from a magmatic system standpoint and not just focus on the vents at the surface,” he said.
Lupi may not have to go far to discover his next massive pool of molten rock. He said his data indicated there may be another reservoir buried under nearby Mount Amiata that’s twice as big as the one beneath Larderello. That area was just at the edge of their seismometer network, meaning the team couldn’t fully resolve it.
Citation: Scharping, N. (2026), Scientists find thousands of cubic kilometers of magma hiding beneath Tuscany, Eos, 107, https://doi.org/10.1029/2026EO260157. Published on 18 May 2026.
Orbital imaging has hinted that Mars may have carbon-containing rocks called carbonates on its surface. Carbonates on Mars could offer new insights into how water interacted with rock on the Red Planet, helping scientists learn more about its past. In addition, because carbonates on Earth are primarily produced by living organisms, these rocks are high-value targets in the search for signatures of past life on Mars.
NASA’s Perseverance rover has been traversing Mars since 2021, covering more than 41 kilometers, much of it within Jezero Crater in the Nili Fossae region. Previous orbital data indicated the crater contains carbonates, as well as abundant olivine, which can change to carbonate in the presence of water and carbon dioxide. Now Clavé et al. have analyzed spectroscopic data from Perseverance’s SuperCam instrument suite from multiple locations within Jezero Crater, providing clear evidence of carbonates on Mars, as well as detailed information on how the mineralogy varies between locations.
The authors confirmed the presence of both carbonates and olivine-bearing rocks throughout Jezero Crater and found a generally inverse relationship between the two minerals. By contrast, carbonates were generally positively correlated with the presence of hydrated silica. The researchers hypothesize that an ancient lake in the crater, along with potential hydrothermal activity, played a role in transforming olivine to carbonate. The varying amounts of carbonate and different alteration states seen today may have been caused by changing lake levels on Mars billions of years ago, the researchers suggest.
Amounts of carbonate by weight vary between locations, from 1%–3% in the Séítah unit to 6%–16% in the Eastern Margin Unit. Extrapolating to the entire regional olivine-rich unit, the researchers calculated it could contain as much as 1.1 × 10¹⁴ kilograms of carbon, or up to 0.4% of the current total mass of the Martian atmosphere. Overall, Mars’s crust could contain significant amounts of carbon, implying that widespread carbon sequestration may have cooled the planet significantly in the past. (Journal of Geophysical Research: Planets, https://doi.org/10.1029/2025JE009107, 2026)
Citation: Scharping, N. (2026), Carbon-rich rocks may have cooled the ancient Martian atmosphere, Eos, 107, https://doi.org/10.1029/2026EO260170. Published on 28 May 2026.
The biological carbon pump moves carbon from near the ocean’s surface to deeper regions, maintaining the upper ocean’s ability to absorb carbon from the atmosphere. One component of this system is driven by eddies, or relatively small-scale circular water currents powered by physical instabilities within the ocean. Previous estimates have suggested the eddy subduction pump may play a large role in moving carbon deep into the ocean, but the absence of global synthesis leaves the question open.
With data from a worldwide network of remote sensors, Keutgen De Greef et al. captured the eddy subduction pump in action around the globe. Their analysis shows that this pump carries less than 5% of the overall organic carbon transported by the biological carbon pump, meaning it’s of secondary importance to understanding ocean carbon flows.
The authors used data spanning 2010 to 2024 from 941 Argo floats drifting autonomously around the globe. They found 1,333 eddy subduction events below 200 meters. Adding up the contribution of a subset of these they identified as carbon subduction events, they estimated the eddy subduction pump exports 0.05 petagram (~50 million metric tons) of carbon per year from the ocean surface. Carbon subduction hot spots exist at mid- to high latitudes in the Southern Ocean and subpolar North Atlantic, both of which also exhibited a strong seasonal peak in spring. The authors also noted a correlation between eddy kinetic energy and physical subduction events (when surface waters sink below the mixed layer), providing insights into the mechanisms driving the eddy subduction pump
The study comes with some limitations, including the sparsity of data in ocean regions including much of the Pacific, the South Atlantic, and the southern Indian Ocean, which could lead to those regions’ contributions being underestimated. The Argo floats measure particulate carbon levels but are unable to effectively measure dissolved organic carbon, meaning some carbon export is being missed. But given the minimal contribution of the eddy subduction pump, these factors may not significantly change estimates of overall biological carbon subduction, the authors suggest. (Global Biogeochemical Cycles, https://doi.org/10.1029/2025GB008912, 2026)
Citation: Scharping, N. (2026), Eddy or not: Do eddies actually transport that much carbon?, Eos, 107, https://doi.org/10.1029/2026EO260119. Published on 17 April 2026.
As seismic waves travel through Earth, they gradually lose energy, a process called attenuation. That energy loss doesn’t happen uniformly—some features in the crust sap far more energy from seismic waves than others. Researchers can map underground features by watching where seismic waves lose more or less energy. The Southern Array for the Lithosphere and Uplift of Taiwan Experiment (SALUTE) is doing just that, providing information that could lead to improved seismic hazard planning in the country.
Lin et al. report attenuation results from SALUTE focused on the convergence between the Eurasian plate and the Luzon Arc, an understudied, geologically dynamic area where Earth’s crust is deforming. Using the overall attenuation rate and relative attenuation rates of P and S seismic waves, the authors imaged active faults, identified distinct lithologies, and better resolved the Luzon forearc block that sits just offshore of Taiwan.
The authors used data from the SALUTE high-density seismographic network, spanning December 2020 to December 2023, to construct both 2D and 3D attenuation models. They found clear changes in attenuation associated with major faults, as well as areas of high attenuation associated with fluid-rich, ductile zones in the lower crust that cause tectonic tremors. Their attenuation imaging additionally revealed that the Luzon forearc block, which had been poorly imaged in the past, dips northward and narrows as it nears the convergence zone.
The authors say their results agree well with previous velocity-based seismic imaging studies and show that attenuation can image features, such as transition zones, that were previously difficult to capture. Their data could also be useful for better understanding seismic hazard throughout the region, they note. (Geophysical Research Letters,https://doi.org/10.1029/2025GL121583, 2026)
Citation: Scharping, N. (2026), Seismic attenuation techniques reveal what lies beneath Taiwan, Eos, 107, https://doi.org/10.1029/2026EO260150. Published on 11 May 2026.
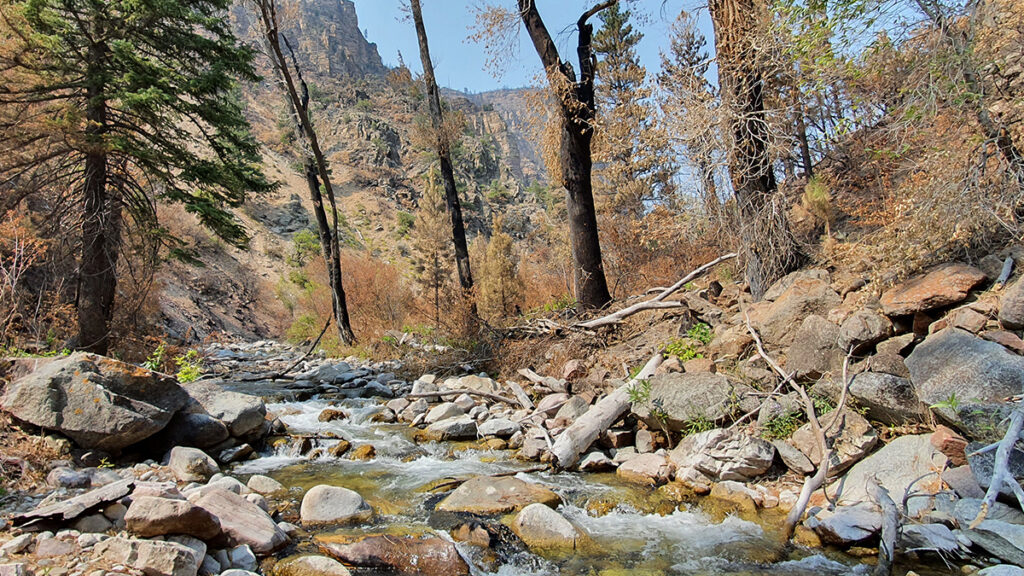
Wildfires can increase flooding risks in and downstream of burned areas by removing vegetation and disturbing hydrologic processes. As the climate changes, the severity of both wildfires and heavy rainfall events is increasing, meaning flooding is likely to become more severe in the near future. Better understanding how, and by how much, wildfires change flood risk is important for disaster and infrastructure planning for communities around the country.
To make the most of the limited data on flooding in the years following wildfires, the researchers created a paired-storms framework: They identified postfire peak flows (PFPFs), defined as the five highest peak flows within 3 years of a wildfire across seven watersheds. Then, for each precipitation event causing a PFPF, they looked for storms with similar characteristics (or paired storms) that occurred before the wildfire. Storm characteristics used for pairing included the season in which the storm occurred, recent precipitation, and precipitation depth, duration, and peak intensity.
The researchers found significantly elevated peak flows after wildfires in many cases, underlining the risks to communities following wildfires and validating their approach for use elsewhere.
Altogether, the authors found 26 PFPF events, including 20 with paired storms occurring before wildfires. For 75% of the postfire storms, their peak flows were 2 or more times greater than prefire peak flows. PFPFs were most likely to happen in the first year after a wildfire and typically occurred following storms that were centered upstream of the watershed centroid, were uniform in shape, and fully covered the watershed and burned area, the authors reported. They also found some evidence that the first storm in the year immediately following a fire has a higher-than-expected chance of producing a PFPF.
Future work could look more deeply at the characteristics of storms occurring over burned areas, such as storm direction and watershed recovery, and could apply the automated methods to more burned watersheds and storm events to enhance the robustness of the work, the authors say. (Water Resources Research, https://doi.org/10.1029/2025WR040693, 2026)