Reading view

The Global Impact of Losing U.S. Sea Level Science

View looking down a beach with small waves and sea foam washing ashore while a single bird flies above.

Since the beginning of the 20th century, global sea level has risen by about 20 centimeters (roughly 8 inches) [Fox-Kemper et al., 2021]. As a result, coastal and island communities around the world are experiencing more frequent high-tide flooding, worsening storm surges, and increasing damage to homes and infrastructure. In the United States, for example, human-caused sea level rise alone increased damages from 2012’s Hurricane Sandy by about $8 billion [Strauss et al., 2021].

The United States has long been a key member of the global climate research community. However, that role is now threatened.

Scientific understanding of the magnitudes and rates of sea level rise, of how they vary around the planet, and of why the ocean is rising is based on a body of rigorous research that, for decades, has tracked past and present sea levels and projected future rise.

The United States has long been a key member of the global climate research community, including in producing the wealth of sea level research that has informed countries, states, and communities of what lies ahead for their shorelines. However, that role is now threatened by the Trump administration’s attacks on the country’s scientific research enterprise broadly and on climate research especially.

Analysis of the evolution of sea level rise projection science [Garner et al., 2018] underscores both the country’s prominent past role in the field and how the ongoing attacks may undermine progress in our understanding of sea level change. It also points to the urgency of acting across multiple fronts to preserve scientific knowledge and prevent further harm to the capacity to measure and project how much and how fast rising seas will affect global coastlines.

Four Decades of Advancing Sea Level Science

By the late 1970s, scientists around the world had begun to recognize the growing threat that climate change posed to the Greenland and Antarctic ice sheets and the danger their melting presented to coastal regions [Mercer, 1978]. The first global mean sea level (GMSL) projections were published in 1982 [Gornitz et al., 1982], and the first planning-oriented sea level scenarios were published just a few years later [e.g., National Research Council, 1987].

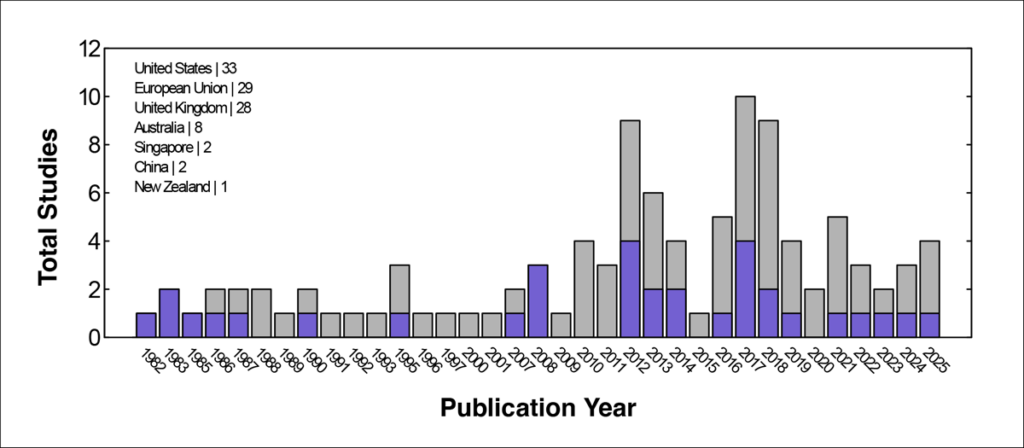
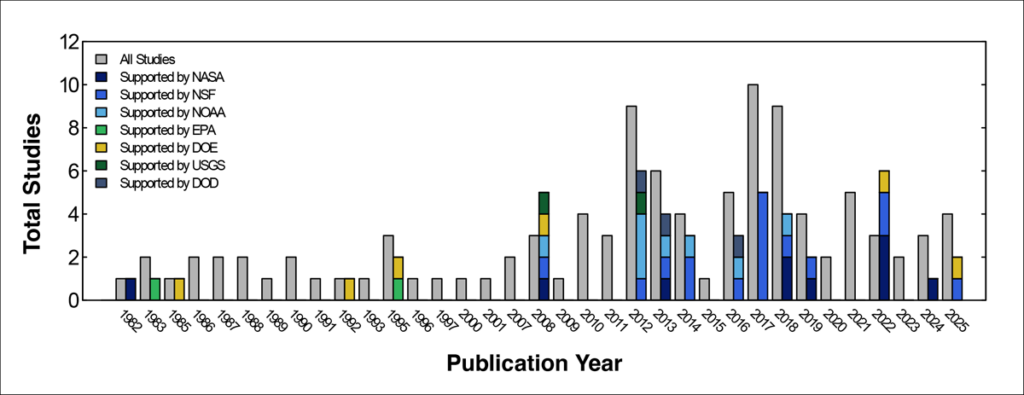
Since 1982, 103 studies have produced GMSL projections [Garner et al., 2018]. About one third of the studies (33 in total), including the first five, were published by teams led by scientists at U.S. institutions (Figure 1). Thirty-three studies (some, but not all, of which were also led by U.S.-based scientists) have also benefited from U.S. federal funding, sometimes from multiple agencies (Figure 2), including the National Science Foundation (NSF; 16 studies), NASA (10 studies), NOAA (8 studies), the U.S. Department of Energy (DOE; 6 studies), the U.S. Department of Defense (3 studies), the U.S. Geological Survey (2 studies), and the EPA (2 studies).

Bar chart showing the total number of sea level rise projection studies published each year from 1982 to 2025 (gray bars) and the number of studies each year that were led by scientists based at U.S. institutions (purple bars).
Fig. 1. This time series shows the total number of sea level rise projection studies published each year from 1982 to 2025 (gray bars) and the number of studies each year that were led by scientists based at U.S. institutions (purple bars). The text at top left tabulates the total number of studies led by authors in each country or region listed.
Bar chart showing the total number of sea level rise projection studies published each year from 1982 to 2025 (gray bars) beside separate bars indicting the number of studies each year that were supported by funding from various U.S. federal science agencies (stacked colored bars).
Fig. 2. The total number of sea level rise projection studies published each year from 1982 to 2025 is shown again here (gray bars), this time beside the number of studies each year that were supported by funding from various U.S. federal science agencies (stacked colored bars). Note that some studies were supported by more than one U.S. federal agency.

U.S. scientists have further played critical roles in developing GMSL projections for Intergovernmental Panel on Climate Change (IPCC) assessments. For example, chapters producing sea level projections for the IPCC Fifth Assessment Report [Church et al., 2013], the IPCC Special Report on the Ocean and Cryosphere in a Changing Climate [Oppenheimer et al., 2019], and the IPCC Sixth Assessment Report (AR6) [Fox-Kemper et al., 2021] were all coled by U.S.-based scientists.

Meanwhile, U.S. funding has been essential to the IPCC, constituting more than 25% of the nearly $207 million invested globally in the organization from 1989 to 2024 [IPCC, 2025]. NASA also played a key role in making IPCC AR6 sea level projections more accessible and usable through the NASA/IPCC Sea Level Projection Tool [Kopp et al., 2023; Fox-Kemper et al., 2021; Garner et al., 2021], which supports local assessments of sea level change around the world and has about 400,000 users annually.

U.S. institutions have been vital in developing, hosting, and maintaining critical sea level datasets.

Beyond direct contributions of U.S. scientists and federal funding to the global scientific community’s sea level projection research, U.S. institutions have been vital in developing, hosting, and maintaining critical sea level datasets. For example, the University of Hawai‘i Sea Level Center is a crucial part of the Global Sea Level Observing System, operating a network of more than 90 tide gauge stations and supporting global real-time oceanographic operations and long-term climate studies. NASA satellite missions, including TOPEX/Poseidon and the Gravity Recovery and Climate Experiment (GRACE and GRACE-FO), have been instrumental in helping to measure changes in GMSL and ice sheets, providing new ways to assess the accuracy of global sea level projections [Törnqvist et al., 2025]. And the Sea Level Research Group at the University of Colorado has consistently processed such datasets, providing critical data access for the broader research community.

Pushed to a Precipice

Since January 2025, climate and sea level science in the United States has come under an unprecedented attack. Scientists have seen congressionally approved research funding revoked or frozen. Agencies like NASA, NOAA, and NSF have been stripped of physical resources, talented scientific experts, and independent advisory and governing boards. The Trump administration, in its fiscal year (FY) 2026 budget, sought debilitating funding cuts for federal scientific agencies, including proposed budget reductions of 24% for NASA, 27% for NOAA, 57% for NSF, and 55% for EPA. Although the scale of these cuts was reduced in the enacted FY2026 budget, the administration is pushing for similarly steep cuts in its FY2027 budget request.

In May 2025, NASA’s Goddard Institute for Space Studies, which produced the first global sea level projections [Gornitz et al., 1982], was evicted from its 49-year home, and efforts to undermine the institute have continued into 2026. Since December, the administration has advanced plans to dismantle the National Center for Atmospheric Research, which developed and maintains a host of climate datasets and resources, including the Community Earth System Model that is widely used to help generate GMSL projections. And in January 2026, the government announced it would withdraw from more than 60 international bodies, including the IPCC, as part of a broader move to pull back from international scientific cooperation.

Efforts to apply climate science in U.S. policy have been hindered not only by political polarization and proposed funding cuts but also by deliberate suppression of data and research.

Efforts to apply climate science in U.S. policy have been hindered not only by political polarization and proposed funding cuts but also by deliberate suppression of data and research. Broadly, the current U.S. administration has removed more than 2,000 datasets from federal platforms, and more specifically, it has systematically scrubbed climate-related content from agency websites. Such erasures disrupt public access to critical information and undermine scientific transparency.

Furthermore, the DOE published a report that without conducting any statistical analysis, denied the scientific evidence for sea level acceleration. It similarly claimed, without any analysis of the numerous sea level projection studies documented here, that sea level is “rising at a lower rate than predicted.” The EPA went further, falsely claiming that “aggregate sea level rise has been minimal.” In fact, the most recent IPCC sea level projections are in good agreement with observations [Törnqvist et al., 2025; Dessler and Kopp, 2025].

The U.S. scientific community now stands at a precipice. Efforts to dismantle federal scientific agencies and diminish research are eroding the United States’ foundational contributions to our knowledge of global change and sea level rise.

The Path to Preserving Critical Science

As we plummet toward a loss of data, expertise, and innovation, we face a future that would not only further damage the United States’ reputation for scientific excellence and transparency but also cripple the global sea level research community at a time when the risks from sea level rise are rapidly increasing [Fox-Kemper et al., 2021].

While some U.S.-based sea level scientists could move to countries more committed to climate science, there are not enough positions in the world nor enough mobility for the vast majority to relocate. Grassroots archiving efforts have helped preserve some critical datasets, but this is a temporary and often insufficient stopgap. An urgent need remains for resilient and transparent scientific infrastructure, so that U.S. taxpayer–funded research findings and datasets are, and remain, publicly accessible.

Historically, federally funded scientific initiatives have enjoyed strong support across the political spectrum in the United States.

Historically, federally funded scientific initiatives have enjoyed strong support across the political spectrum in the United States. However, the unprecedented hostility facing science in the country today has revealed that new institutional safeguards and legal protections to prevent political interference are critically needed.

Expanding collaborations between U.S. universities and private foundations and donors provides one potential route to providing some protection and improving long-term stability for sea level science data and initiatives. Climate Central’s Surging Seas project offers one model to emulate. However, philanthropic efforts are far from sufficient to preserve the U.S. scientific enterprise.

Another avenue to protect federally funded science from political pressure is through bipartisan legislation. Bills such as the Scientific Integrity Act (which aims to ensure that scientific findings are not influenced or altered by political pressure) and the Protect America’s Workforce Act (which aims to restore collective bargaining rights for unionized federal employees) represent such opportunities.

Yet the effectiveness of such legislative efforts hinges on the critical caveat that the people holding authority in government recognize and abide by enacted legislation. Under an executive who does not abide by the rule of law, such legislative efforts, even if they are passed successfully, will offer little actual protection. The path to preserving U.S. climate and sea level science, therefore, cannot be separated from the path to restoring the rule of law within the U.S. government.

Progressing on this front requires the scientific community to advocate for its priorities more vocally and to build coalitions that include both academics and the stakeholders who benefit from scientific climate projections. It also requires making use of tools and levers that many scientists are unaccustomed to, such as the court system. AGU and other institutions have modeled this approach over the past year, joining legal efforts to protect federal workers, for example, and speaking up against the dismantling of valued science agencies.

Restoring the rule of law also requires electoral organizing to reestablish Congress as an independent and coequal branch of government that wields, rather than abdicates, lawful oversight of administration officials and federal agencies.

Scientific understanding of sea level processes and projections of future changes inform local, national, and international decisionmaking and provide a pathway to resilience against the risks of rising coastal waters. Safeguarding the long-standing leadership, integrity, and continuity of U.S. climate and sea level science is both a national and global imperative—one that many scientists are already stepping up to support. Now we need the rest of the scientific community—and its allies in academia, philanthropy, industry, and the public—to join in.

Acknowledgments

The authors thank Amy Appollina and Jessica Slotter for their assistance in curating a database of global sea level rise projections.

References

Church, J. A., et al. (2013), Sea level change, in Climate Change 2013: The Physical Science Basis. Contribution of Working Group I to the Fifth Assessment Report of the Intergovernmental Panel on Climate Change, edited by T. F. Stocker et al., pp. 1,137–1,216, Cambridge Univ. Press, Cambridge, U.K., https://doi.org/10.1017/CBO9781107415324.026.

Dessler, A., and R. E. Kopp (2025), Climate experts’ review of the DOE Climate Working Group Report, ESS Open Archive, https://doi.org/10.22541/ESSOAR.175745244.41950365/V2.

Fox-Kemper, B., et al. (2021), Ocean, cryosphere and sea level change, in Climate Change 2021: The Physical Science Basis. Contribution of Working Group I to the Sixth Assessment Report of the Intergovernmental Panel on Climate Change, edited by V. Masson-Delmotte et al., pp. 1,211–1,362, Cambridge Univ. Press, Cambridge, U.K., https://doi.org/10.1017/9781009157896.011.

Garner, A. J., et al. (2018), Evolution of 21st century sea level rise projections, Earth’s Future, 6, 1,603–1,615, https://doi.org/10.1029/2018EF000991.

Garner, G. G., et al. (2021), IPCC AR6 Sea Level Projection Tool, NASA Sea Level Change Portal, sealevel.nasa.gov/data_tools/17.

Gornitz, V., S. Lebedeff, and J. Hansen (1982), Global sea level trend in the past century, Science, 215(4540), 1,611–1,614, https://doi.org/10.1126/science.215.4540.1611.

Intergovernmental Panel on Climate Change (IPCC) (2025), IPCC Trust Fund Programme and Budget, IPCC-LXII/Doc. 2, rev. 1, IPCC Secr., Geneva, Switzerland, apps.ipcc.ch/eventmanager/documents/88/180220250655-Doc.%202,%20Rev.1%20-%20IPCC%20Programme%20and%20Budget.pdf.

Kopp, R. E., et al. (2023), The Framework for Assessing Changes To Sea-level (FACTS) v1.0: A platform for characterizing parametric and structural uncertainty in future global, relative, and extreme sea-level change, Geosci. Model Dev., 16, 7,461–7,489, https://doi.org/10.5194/gmd-16-7461-2023.

Mercer, J. (1978), West Antarctic ice sheet and CO2 greenhouse effect: A threat of disaster, Nature, 271, 321–325, https://doi.org/10.1038/271321a0.

National Research Council (1987), Responding to Changes in Sea Level: Engineering Implications, Natl. Acad. Press, Washington, D.C.

Oppenheimer, M., et al. (2019), Sea level rise and implications for low-lying islands, coasts and communities, in IPCC Special Report on the Ocean and Cryosphere in a Changing Climate, edited by H.-O. Pörtner et al., pp. 321–445, Cambridge Univ. Press, Cambridge, U.K., https://doi.org/10.1017/9781009157964.006.

Strauss, B. H., et al. (2021), Economic damages from Hurricane Sandy attributable to sea level rise caused by anthropogenic climate change, Nat. Commun., 12, 2720, https://doi.org/10.1038/s41467-021-22838-1.

Törnqvist, T. E., et al. (2025), Evaluating IPCC projections of global sea-level change from the pre-satellite era, Earth’s Future, 13, e2025EF006533, https://doi.org/10.1029/2025EF006533.

Author Information

Andra J. Garner (garnera@rowan.edu), Department of Environmental Science, Rowan University, Glassboro, N.J.; Robert E. Kopp, Department of Earth and Planetary Sciences and Rutgers Climate and Energy Institute, Rutgers University, New Brunswick, N.J.; Gregory G. Garner, Glassboro, N.J.; Aimée B. A. Slangen, Department of Estuarine and Delta Systems, Royal Netherlands Institute for Sea Research, Yerseke; and Benjamin P. Horton, School of Energy and Environment, City University of Hong Kong

Citation: Garner, A. J., R. E. Kopp, G. G. Garner, A. B. A. Slangen, and B. P. Horton (2026), The global impact of losing U.S. sea level science, Eos, 107, https://doi.org/10.1029/2026EO260156. Published on 15 May 2026.
This article does not represent the opinion of AGU, Eos, or any of its affiliates. It is solely the opinion of the author(s).
Text © 2026. The authors. CC BY-NC-ND 3.0
Except where otherwise noted, images are subject to copyright. Any reuse without express permission from the copyright owner is prohibited.
  •  

Mexico’s Sheinbaum calls for proof after US authorities accuse senior politicians of narco ties

Bogotá, Colombia – Mexican President Claudia Sheinbaum has demanded that United States authorities provide evidence for their claims that several senior politicians have ties to drug cartels.

Yesterday, the U.S. Justice Department indicted Sinaloa Governor Ruben Rocha, Senator Enrique Inzunza, and eight other current and former officials for drug trafficking and weapons offenses.

Sheinbaum said that without proof, the charges would be treated as politically motivated, marking the latest flashpoint in tense relations between the two neighbors. 

“If there isn’t clear evidence, it ⁠is obvious that the objective of these indictments by the Department of Justice is political,” said Sheinbaum at a press conference this morning.

Her statement came a day after the U.S. Attorney’s Office for the Southern District of New York announced the indictments against the ten officials from Sinaloa.

In addition to the governor and senator, justice officials charged Sinaloa’s deputy attorney general, several former police officials, and the current Mayor of Culiacán – the state capital. 

“These politicians and law enforcement officials have abused their ​authority in ⁠support of the cartel, exposed and subjected victims to threats and violence, and sold out their offices in exchange for massive bribes,” read the indictment.

Rocha was charged with narcotics importation conspiracy and weapons possession, which carry a minimum sentence of 40 years and up to life in prison.

In the indictment, authorities accused the governor of receiving help from a faction of the Sinaloa cartel in his 2021 election campaign.

They alleged that “Los Chapitos”, a group run by the sons of jailed kingpin Joaquin “El Chapo” Guzman, had kidnapped and threatened Rocha’s political rivals in exchange for guarantees of impunity.

But Rocha denied the charges, writing on X, “They lack any truth or foundation whatsoever.”

Both the governor and Senator Inzunza are members of Sheinbaum’s ruling Morena party, threatening to embarrass the president as she leads a crackdown on organized crime. 

In February, authorities killed “El Mencho”, the head of the powerful Jalisco New Generation Cartel (CJNG), in an operation with U.S. intelligence assistance. Last week, they took out a possible successor to lead the CJNG, alias “El Jardinero”. 

The Mexican government’s offensive comes amid U.S. pressure to deliver results on drug trafficking as the Donald Trump administration takes a renewed interest in tackling hemispheric organized crime.

During his election campaign, Trump pledged to stop the flow of illegal drugs, primarily Fentanyl, which contributed to the nearly 80,000 deaths from overdose in the U.S. in 2024.

In addition to pressuring regional governments to take firmer action against organized crime, Washington has overseen a boat bombing campaign in the Caribbean and Eastern Pacific aimed at stopping drug trafficking.

But drug experts note that the use of military force has failed to stem the illegal narcotics trade during the decades-long U.S.-led ‘war on drugs’.

Featured image description: Claudia Sheinbaum pictured at her desk on April 30, 2026.

Featured image credit: @Claudiashein via X.

The post Mexico’s Sheinbaum calls for proof after US authorities accuse senior politicians of narco ties appeared first on Latin America Reports.

  •  

How Much Will Western Wildfires Worsen Under Warming?

The West Kern Fire and thick smoke move through trees near the boundary of California’s Sequoia National Park.
Source: AGU Advances

Across the western United States, wildfires are increasing in size and intensity. As the climate continues to warm, more extreme wildfires will reshape landscapes and pose a growing risk to human health and natural ecosystems throughout the West.

Climate models, used to predict other effects of climate change, are unable to directly simulate wildfires. Instead, researchers link previously burned areas to climate variables such as temperature, precipitation, drought, and evaporation, then apply those relationships to future climate projections.

Many recent studies have connected higher vapor pressure deficit (VPD)—a measure of atmospheric dryness—to more area burned in previous fires. VPD increases as the temperature rises, so models that rely on it generally predict an increase in wildfire activity as the climate warms.

Cheng et al. raise questions about the role VPD plays in modeling wildfire, suggesting that VPD is a poor measure of fuel dryness at larger scales and overestimates potential burned areas under significant warming conditions. Instead, researchers suggest soil moisture could be a more reliable indicator of fuel dryness and lead to more moderate projections of wildfire increases.

The researchers looked at five forested ecoregions in the western states. Using the Western US MTBS-Interagency wildfire dataset from 1984 to 2020 combined with climate data (temperature, VPD, and soil moisture), the researchers analyzed drivers of the area burned from May through October. They connected this information with output from climate models to look at future burn potential.

VPD-based wildfire predictions increase sharply under warming conditions. These predictions showed that under 3°C of average global warming, 16 times as much land would burn by the end of the century, compared to historical levels. Under 4°C of warming, up to 66 times more land would burn by the end of the century. This “truly massive” increase, the authors say, would mean fires consuming vegetation almost as soon as it regrows.

Soil moisture, on the other hand, provides a more moderate, though still concerning, picture. Under the same warming scenarios, soil moisture changes would lead to an increase in burned area of only 2–3 times that of the historical period. The researchers argue that projections relying on VPD severely exaggerate wildfire risk. (AGU Advances, https://doi.org/10.1029/2026AV002350, 2026)

—Rebecca Owen (@beccapox.bsky.social), Science Writer

A photo of a telescope array appears in a circle over a field of blue along with the Eos logo and the following text: Support Eos’s mission to broadly share science news and research. Below the text is a darker blue button that reads “donate today.”
Citation: Owen, R. (2026), How much will western wildfires worsen under warming?, Eos, 107, https://doi.org/10.1029/2026EO260147. Published on 15 May 2026.
Text © 2026. AGU. CC BY-NC-ND 3.0
Except where otherwise noted, images are subject to copyright. Any reuse without express permission from the copyright owner is prohibited.
  •  

Collaged Denim Sculptures by Nick Doyle Unravel American Mythology

Collaged Denim Sculptures by Nick Doyle Unravel American Mythology

Despite its name, the Canadian Tuxedo is a distinctly American look. The denim-on-denim getup dates back to the 1950s, when Bing Crosby sported a full Levi’s ensemble while in Vancouver, setting a sartorial trend that continues today.

The national mythology woven into this utilitarian material is also the focus of Brooklyn-based Nick Doyle, who layers denim atop denim into large wall sculptures. From a pair of aviators reflecting puffy clouds to a vast Rocky Mountain landscape framed by brick, the works evoke a sort of nostalgic road trip west, as if chasing a big break, and ultimately, realizing the American dream.

a large denim wall sculpture by Nick Doyle of sunglasses with clouds in the lenses
“First Come the Dreamers” (2026), bleached and collaged denim on panel, 25 x 72 inches

For Doyle, denim is a poignant, loaded metaphor for much of American culture and history. The material has roots in chattel slavery, when people enslaved in the South were dyeing cotton with indigo. There’s also its association with the brusque masculinity of James Dean and cowboy ruggedness, itself an extension of the gold rush and Manifest Destiny. The fabric, in many ways, is a stand-in for the contradictions, hypocrisies, and unreachable desires so bound up in American life.

While researching the visual language of Americana in 2018, Doyle came upon a roll of denim discarded by a fashion designer moving out of his building. “At the time, I had no money, so I was making work out of material I found in the garbage or at my local hardware store,” he shares. “As I was pulling [the roll] out of the trash, I noticed a network of ideas connecting in my brain… I felt the material reflected the historical complexities I was seeing in my research, as well as being reflected in my own familial history.”

This encounter was one of those providential moments that set off an enduring fascination. In his solo exhibition Collective Hallucinations, on view at Perrotin, Doyle presents the latest of his denim sculptures, including stylized cacti, landscapes cordoned off by chainlink fences, and more mystical objects like tarot cards and a life-sized fortune teller’s shop.

a large denim wall sculpture by Nick Doyle of a landscape shown throw a brick wall
“Innocent Industry” (2026), bleached and collaged denim on panel, 72 x 64 inches

The show contains myriad symbols of American exceptionalism and individualism, presented in the heritage fabric of the nation. Doyle shares:

Over the last few years, my conception of American mythology has only become more complex… I think in a lot of ways what we’re experiencing now is a breakdown of these mythologies. They are in direct conflict with the current political reality, yet they are summoned as if it is business as usual. The world’s image of America has changed, but our country’s nostalgia for itself is making us late to the party. There’s tragedy in vanity.

Collective Hallucinations presents these unrealized dreams and confrontations in varying shades of blue, rendering what appears to be individual moments as simply different washes of the same story.

In addition to his practice, Doyle will soon open the second iteration of a kink bar called Human Resources at Basel Social Club and is working toward a fall exhibition of paper collages and prints at Pace. If you’re in New York, Collective Hallucinations runs through May 30. Otherwise, find more on Instagram.

a large denim wall sculpture by Nick Doyle of a cactus
“Here We Go Round the Prickly Pear Bush” (2026), bleached and collaged denim on panel, 48 x 26 inches
a large denim wall sculpture by Nick Doyle of a cloud tarot card
“The Clouds” (2026), bleached denim on panel, 24 x 18 inches
a large denim wall sculpture by Nick Doyle of a cactus with a flamingo in the center
“Plastic Eden” (2026), bleached and collaged denim on panel, 68 x 42 inches
“Black Market Bodies” (2026), bleached and collaged denim on panel, 36 x 64 inches

Do stories and artists like this matter to you? Become a Colossal Member today and support independent arts publishing for as little as $7 per month. The article Collaged Denim Sculptures by Nick Doyle Unravel American Mythology appeared first on Colossal.

  •  

How Wildfires Worsen Flood Risk

A rocky stream flows through a landscape of burned trees. A mountain is visible in the background.
Source: Water Resources Research

Wildfires can increase flooding risks in and downstream of burned areas by removing vegetation and disturbing hydrologic processes. As the climate changes, the severity of both wildfires and heavy rainfall events is increasing, meaning flooding is likely to become more severe in the near future. Better understanding how, and by how much, wildfires change flood risk is important for disaster and infrastructure planning for communities around the country.

Canham and Lane used streamflow data from the U.S. Geological Survey’s National Water Information System and precipitation data from the NOAA Analysis of Record for Calibration product to identify storms and quantify their effects across seven burned watersheds in the western United States.

To make the most of the limited data on flooding in the years following wildfires, the researchers created a paired-storms framework: They identified postfire peak flows (PFPFs), defined as the five highest peak flows within 3 years of a wildfire across seven watersheds. Then, for each precipitation event causing a PFPF, they looked for storms with similar characteristics (or paired storms) that occurred before the wildfire. Storm characteristics used for pairing included the season in which the storm occurred, recent precipitation, and precipitation depth, duration, and peak intensity.

The researchers found significantly elevated peak flows after wildfires in many cases, underlining the risks to communities following wildfires and validating their approach for use elsewhere.

Altogether, the authors found 26 PFPF events, including 20 with paired storms occurring before wildfires. For 75% of the postfire storms, their peak flows were 2 or more times greater than prefire peak flows. PFPFs were most likely to happen in the first year after a wildfire and typically occurred following storms that were centered upstream of the watershed centroid, were uniform in shape, and fully covered the watershed and burned area, the authors reported. They also found some evidence that the first storm in the year immediately following a fire has a higher-than-expected chance of producing a PFPF.

Future work could look more deeply at the characteristics of storms occurring over burned areas, such as storm direction and watershed recovery, and could apply the automated methods to more burned watersheds and storm events to enhance the robustness of the work, the authors say. (Water Resources Research, https://doi.org/10.1029/2025WR040693, 2026)

—Nathaniel Scharping (@nathanielscharp), Science Writer

A photo of a telescope array appears in a circle over a field of blue along with the Eos logo and the following text: Support Eos’s mission to broadly share science news and research. Below the text is a darker blue button that reads “donate today.”
Citation: Scharping, N. (2026), How wildfires worsen flood risk, Eos, 107, https://doi.org/10.1029/2026EO260133. Published on 30 April 2026.
Text © 2026. AGU. CC BY-NC-ND 3.0
Except where otherwise noted, images are subject to copyright. Any reuse without express permission from the copyright owner is prohibited.
  •  

Lula and Trump declare bilateral relationship reset after three-hour meeting at the White House

“We discussed many subjects, including trade, specifically tariffs,” Trump wrote at the conclusion of the encounter The presidents of Brazil, Luiz Inácio Lula da Silva, and the United States, Donald Trump, held a meeting of close to three hours at the White House on Thursday in which both leaders declared an end to one of the most severe bilateral crises in two centuries of relations between the two largest economies in the Americas. The encounter, formalized as a working meeting, unfolded in a climate of personal fluency and allowed for the agreement to establish bilateral channels to address commercial, security, and regional cooperation matters.

  •  

The 10 August 2025 landslide and tsunami at Tracy Arm fjord in Alaska

A mountainside stripped of trees has some dead vegetation still visible.

A wonderful new paper on the huge Tracy Arm landslide and tsunami will have profound but challenging implications for the management of risk in an age of increased tourism and rapid climate change.

Image of a landslide partially covered with a transparent sand-colored overlay and the words “The Landslide Blog,” centered, in white

The journal Science has published an excellent new paper (Shugar et al. 2026) that examines the extraordinary 10 August 2025 landslide and tsunami at Tracy Arm fjord in Alaska. The paper is open access, so you can read it for yourself (it is very accessible), and there has been a plethora of media coverage (quite rightly).

I wrote about this event at the time and in the aftermath, but Shugar et al. (2026) is the authorative source. There is little for me to add to the science, but AGU Eos has a really excellent write up and explainer that I thoroughly recommend.

That large landslides occur in fjords is not a surprise, and that they can generate enormous displacement waves is also not news. We know that landslide occurrence in these environments in general is increasing, and specifically so in Alaska. However, this paper is the most comprehensive and systematic analysis of such an event, and it has shown the remarkable threat that these events can generate. The tsunami created by this landslide had a 481 metre run-up; it is remarkable that there were no fatalities. If a large cruise ship had been in the area, with passengers being ferried ashore on small boats and exploring the shoreline, the consequences would have been catastrophic. It is unsurprising then that cruise companies are now amending their itineraries.

The USGS released the image below of the aftermath of the landslide and tsunami – scale is hard to understand in such images, but the crown of the landslide is over 1,000 metres above the level of the fjord, and the landslide had a subaerial volume of over 63 million cubic metres.

A photo shows a mountainside with a large wedge of lighter-colored rock, above a churning channel of water. The foot of a glacier can be seen at the lower edge of the image.
This aerial photo shows the north side of Alaska’s Tracy Arm Fjord in the aftermath of the 2025 landslide and tsunami. The lighter-colored rock is the exposed surface, where the mountainside collapsed and fell into the water. The foot of South Sawyer Glacier is visible at lower right; in decades past, the ice extended much farther and was thick enough to hold the rock slopes in place. Credit: Cyrus Read/U.S. Geological Survey

Shugar et al. (2026) has a brief section that examines the implications of this event, and of the understanding that it provides of the hazards posed by very large landslides in fjord settings. These are locations with extensive human activity – local communities, trade, fishing and tourism. There is some evidence that these landsldies are more likely to occur in the spring and summer months, when human occupation is higher. Our resilience to a tsunami wave that starts off being hundreds of metres high is low.

A case in point lies in Milford Sound in New Zealand, where (for example) an earthquake on the Alpine Fault has the potential to trigger a large landslide that could result in a major tsunami. Milford Sound is an extremely popular tourism location. Should such an event occur, and mass fatalities result, there is no doubt that the public inquiry would find that the societal risk was known and that it was probably unacceptable. However, to ban tourism, including cruise ships, in this area would carry heavy risks in its own right – it would profoundly impact the vital tourist economy of the area, on which many livelihoods depend. This is a substantial risk in its own right, and of course politics plays a major part too. Balancing these risks is a major challenge for any society.

Some hope is offered by the fact that this landslide showed substantial precursory seismic activity, which might represent a route to providing a warning for at least some of these rock slope failures. But research in this area is immature at the moment, and of course there will be no warning for a landslide triggered by a major earthquake.

So, the landslide at Tracy Arm fjord presents us with a host of major challenges, but it also represents a big step forward in our understanding of these events. Well done to Dan and his colleagues for another brilliant paper. I shall watch the debate with great interest.

Reference

Shugar et al. 2026. A 481-meter-high landslide-tsunami in a cruise ship–frequented Alaska fjord. Science, eaec3187. DOI:10.1126/science.aec3187

Text © 2026. The authors. CC BY-NC-ND 3.0
Except where otherwise noted, images are subject to copyright. Any reuse without express permission from the copyright owner is prohibited.

  •  

New USGS Tool Fills in the Gaps on U.S. Water Supply

A bridge crosses a river beneath a relatively short waterfall. A city skyline is on the other side of the river.

Research & Developments is a blog for brief updates that provide context for the flurry of news that impacts science and scientists today.

In the contiguous United States, crop irrigation, municipal water supplies, and thermoelectric power generation use more than 224 billion gallons of fresh water every day. Conducting water research or making decisions about water use, until now, often required referencing datasets across various agencies. The U.S. Geological Survey (USGS) National Water Availability Assessment Data Companion (NWDC), announced this week, aims to streamline this process. In part, the tool is designed to help decisionmakers better understand the balance between how high demand and limited supply affect water availability in their communities.

“While the United States has abundant water nationally, regional imbalances between supply and demand may create water challenges affecting millions of Americans,” said lead scientist Shirley Leung in a USGS press release. “What once required significant resources and time can now be done in minutes, giving communities of all sizes the same foundation for water planning.”

The lower 48 states are home to about 80,000 sub-watersheds, from those in the arid southwest to the Great Lakes Basin, where about 84% of North America’s surface fresh water is located. According to the USGS, the NWDC is the first tool that integrates information about water availability in individual watersheds at a national scale.

The tool is designed to complement Water Data for the Nation (WDFN), another USGS product that consolidates observational data from the agency’s thousands of local monitoring stations gathering data on streams, lakes, reservoirs, precipitation, water quality, and groundwater. The new tool uses modeling to fill in spatial and temporal gaps between the observations made at these stations.

Water managers, researchers, agricultural experts, and others can use the NWDC to compare watershed conditions, identify seasonal patterns in water use, or to create data visualizations of statewide water use, for example. Though the tool currently covers only the contiguous United States, it will soon be extended to Alaska, Hawaii, and Puerto Rico, according to the USGS.

David Tarboton, a professor of civil engineering at the Utah Water Research Laboratory, said he was “intrigued” by the new tool, and is interested in examining the data its model produces. 

While Tarboton was disappointed that the tool’s most recent available data are from 2020, “having a sort of integrated, wall-to-wall dataset that’s consistently produced is very valuable,” he said. He works, in part, in the areas of hydroinformatics and data sharing, and noted that the modern methods the agency is using to share the data could be useful in developing automated tools.

—Emily Gardner (@emfurd.bsky.social), Associate Editor

These updates are made possible through information from the scientific community. Do you have a story about science or scientists? Send us a tip at eos@agu.org.

A photo of a hand holding a copy of an issue of Eos appears in a circle over a field of blue along with the Eos logo and the following text: Support Eos’s mission to broadly share science news and research. Below the text is a darker blue button that reads “donate today.”
Text © 2026. AGU. CC BY-NC-ND 3.0
Except where otherwise noted, images are subject to copyright. Any reuse without express permission from the copyright owner is prohibited.
  •  

Hundreds of Candidates Put the “Science” in “Political Science”

The U.S. capitol building seen at night.

Research & Developments is a blog for brief updates that provide context for the flurry of news regarding law and policy changes that impact science and scientists today.

More U.S. scientists are running for state and federal office in the U.S. midterm elections than ever before, Nature reports. Scientist-candidates represent an array of parties, although most profiled in Nature identify as Democrats.

314 Action, an organization focused on getting Democrats with scientific backgrounds elected to public office, offers financial support and training to candidates who apply for it. This year, the organization told Nature, they’ve received nearly three times as many applications as usual.

Sam Wang, a neuroscientist at Princeton and director of the Princeton Gerrymandering Project, is running to represent New Jersey’s 12th Congressional District.

“Usually, scientists stick with a specialized field,” Wang, a Democrat, wrote in an opinion for The Daily Princetonian. “However, I am deeply unhappy with how unequally power is divided in our society. So I have used my statistical abilities to level one part of democracy’s playing field: by repairing unfair elections.”

Why Now?

This year, Democratic candidates appear to be motivated by cuts to federal science programs, grants, and agencies, Nature reports, while Republican candidates like Jeff Wilson, who is running to represent the 13th district of Illinois, cite the pursuit of energy independence.  Third-party scientist-candidates have also run, and scientists are entering local and municipal arenas, too.

Specifically, with the recent repeal of the Endangerment Finding, loosened restrictions on pollution, and plans to break up the National Center for Atmospheric Research, some candidates and their supporters think science needs a more prominent position in public policy.

The rise in scientist candidates may also be part of an ongoing trend. More than 200 STEM professionals ran for office in the 2024 election, as Eos reported in October 2024.

“There are a lot of people who believe that science can help us live better lives and that science really does need to be front and center when we’re making public policy,” Jess Phoenix, a volcanologist, science advocate, and former Democratic candidate for the U.S. House of Representatives told Eos at the time.

In March, thousands of people attended Stand Up for Science rallies across the country to protest the misuse of science in federal policy and extensive staffing and funding cuts to scientific agencies. Since President Trump took office in 2025, more than 10,000 PhD-level scientists have left the federal workforce, Science reported in January.

Pew research data shows that public trust in scientists has declined since the COVID-19 pandemic, but it has seen modest improvements since 2023. The latest poll, released in January, found that 77% of adults in the United States have a great deal or a fair amount of confidence in scientists to act in the public’s best interest, compared to 73% in 2023. The percentage is consistently higher among Democrats than Republicans: 90% versus 65%, in 2026. In contrast, only 27% of respondents reported at least a fair amount of confidence in elected officials.

“The last thing I want [is] to become a politician,” wrote one Redditor in response to the Nature story. “But at this rate I may not have a choice if current politicians keep screwing it up.”

—Emily Gardner (@emfurd.bsky.social), Associate Editor

These updates are made possible through information from the scientific community. Do you have a story about how changes in law or policy are affecting scientists or research? Send us a tip at eos@agu.org.

A photo of a hand holding a copy of an issue of Eos appears in a circle over a field of blue along with the Eos logo and the following text: Support Eos’s mission to broadly share science news and research. Below the text is a darker blue button that reads “donate today.”
Text © 2026. AGU. CC BY-NC-ND 3.0
Except where otherwise noted, images are subject to copyright. Any reuse without express permission from the copyright owner is prohibited.
  •  
❌