Normal view

  • ✇Eos
  • Tracing Water’s Hidden Journey Through the Earth’s Living Skin Andrea L. Popp and Harsh Beria
    Editors’ Vox is a blog from AGU’s Publications Department. Ensuring the sustainability of water resources and ecosystems in a changing world requires a thorough understanding of how water moves through Earth’s Critical Zone, a dynamic interface where air, water, soil, plants, and rocks interact. Researchers can track and model this movement of water using naturally occurring markers or “tracers.” A recent article in Reviews of Geophysics explores the latest advancements in tracer-aided mi
     

Tracing Water’s Hidden Journey Through the Earth’s Living Skin

13 May 2026 at 12:00
A river flowing through a mountainous region.
Editors’ Vox is a blog from AGU’s Publications Department.

Ensuring the sustainability of water resources and ecosystems in a changing world requires a thorough understanding of how water moves through Earth’s Critical Zone, a dynamic interface where air, water, soil, plants, and rocks interact. Researchers can track and model this movement of water using naturally occurring markers or “tracers.”

A recent article in Reviews of Geophysics explores the latest advancements in tracer-aided mixing models and how they can help us to better understand the Critical Zone. Here, we asked the authors to give an overview of the Critical Zone, how tracer-aided mixing modeling works, and future directions for research.

What is the Critical Zone (CZ)?

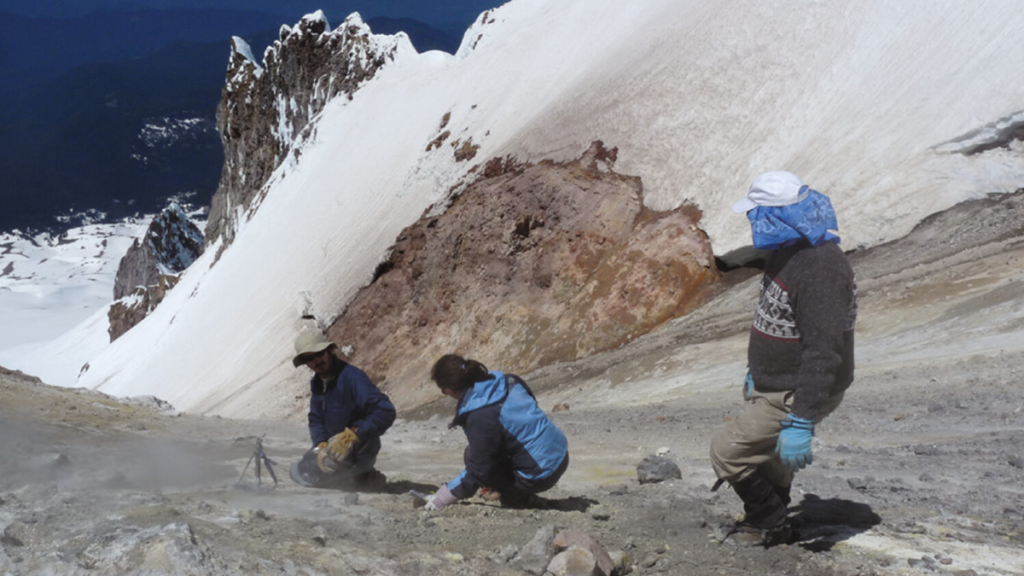
The Critical Zone is Earth’s “living skin”—the dynamic layer where the atmosphere, hydrosphere, biosphere, and lithosphere interact. It stretches from the top of the vegetation canopy and, in cold regions, from the surface of snowpacks and glaciers, down through soils and into the deeper aquifers. It encompasses lakes, streams, and wetlands at the surface, and extends beyond the soil layer to underlying groundwater aquifers. It is where rainfall, snowmelt and glacier melt become soil moisture, where plants take up water and return it to the atmosphere, where aquifers get recharged, and where streamflow is generated. In short, the Critical Zone is where most processes that sustain terrestrial life and freshwater resources unfold.

Why is it important to understand how water moves through the Critical Zone?

Virtually every freshwater resource we rely on (e.g., drinking water, irrigation) passes through the Critical Zone.

Virtually every freshwater resource we rely on (e.g., drinking water, irrigation) passes through the Critical Zone at some point. Global warming, land-use changes, and intensifying water demand emerging from rapid urbanization and changes in agriculture are reshaping how water is stored and released within the Critical Zone, often in ways we cannot yet predict. Understanding how much water is stored within the Critical Zone, how this water is both recharged from rainfall and snowmelt and eventually discharged into streams, and the timescale of these dynamic processes is essential for protecting ecosystems, safeguarding water supplies, and adapting to a changing climate.

How would you explain a tracer-aided mixing model to a non-specialist?

Imagine mixing a glass of orange juice with a glass of apple juice, and trying afterwards to work out how much of each went into the glass. If the juices had distinctive “fingerprints” (imagine its color, sugar content, or a specific chemical) and these fingerprints primarily changed because of the mixing of these two juices, you can then measure the fingerprint in the final mixture and back-calculate the proportion of its distinct sources.

Tracer-aided mixing models work in a similar way but can track the entire water cycle. Different water sources (e.g., rainfall, snowmelt, glacier melt, soil water, groundwater) can have distinct “fingerprints” in a naturally occurring tracer, such as stable isotopes of water or specific dissolved elements. By measuring these fingerprints in the streamwater or groundwater and in its potential sources for example, hydrologists can estimate how much each source contributed to the streamwater or groundwater.

Conceptual model of the different components of the Critical Zone. “Gw” stands for groundwater. Credit: Popp et al. [2025], Figure 2

What are some of the most significant and exciting recent advances in tracer-aided mixing models?

Classical mixing models relied on demanding assumptions: that all water sources can be identified and sampled, and that their signatures were distinct and constant in time. Much of the recent progress has been about relaxing these assumptions.

Bayesian approaches now estimate full probability distributions and provide a more realistic picture of uncertainty. Methods like Convex Hull End-Member Mixing Analysis (CHEMMA) use machine learning to infer the distinct sources directly from data, while ensemble hydrograph separation exploits tracer fluctuations over time, thereby making un-mixing feasible even when multiple sources have overlapping signatures. Perhaps the most conceptually novel advance is end-member splitting, which flips the question from “where does streamflow come from?” to “where does precipitation go?”

Alongside these modeling advances, there have been immense advances in how tracers are measured. Portable laser and mass spectrometers now enable high-frequency, in-situ tracer measurements which allows us to capture critical hydrological events such as storms and snowmelt in near-real time.

What are stable water isotope tracers and what are their advantages?

Stable water isotopes are naturally occurring non-radioactive atoms of hydrogen and oxygen that make up a water molecule but have slightly different molecular masses. The two stable isotopes widely used in hydrology are 2H (deuterium) and 18O (oxygen-18). Because these isotopes are part of the water molecule itself, they directly travel with the water molecule. Their key advantages are: (1) they are conservative, meaning they do not react chemically as water moves through soils and aquifers, and (2) they carry distinct signatures resulting from climatic variables such as air temperature.

These properties make stable water isotopes the most versatile and widely used tracer in Critical Zone hydrology.

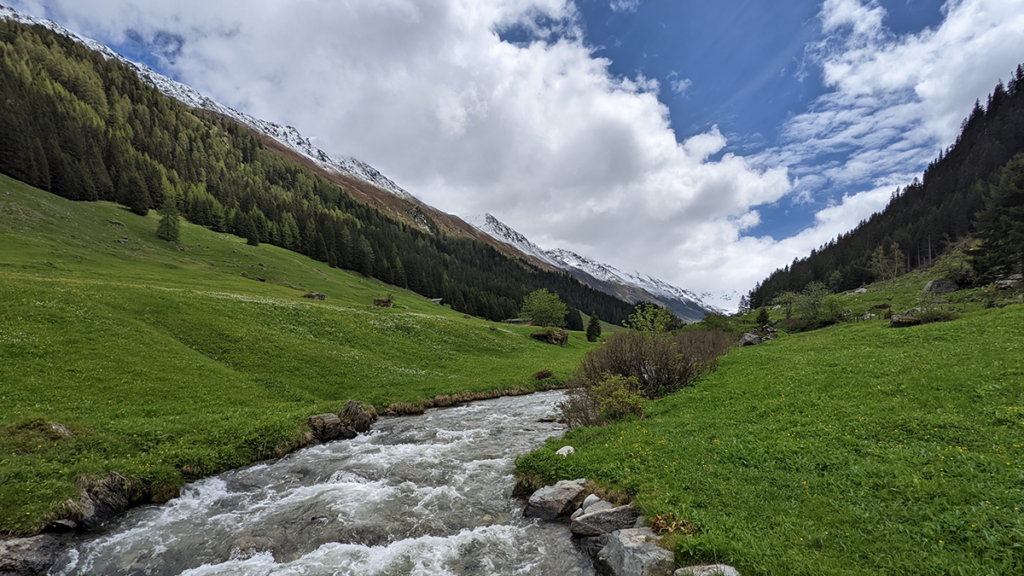
Consequently, in the European Alps, winter precipitation has a different isotopic signature than summer precipitation because winters are cooler than summers. Other hydrological processes such as evaporation and sublimation leave a recognizable fingerprint on the remaining water, thereby allowing us to estimate how much evaporation or sublimation occurred. Stable water isotopes can be measured in essentially every water compartment, from atmospheric vapor and precipitation to snowpack, plant xylem, soil water, streams, and groundwater. Together, these properties make stable water isotopes the most versatile and widely used tracer in Critical Zone hydrology.

What are the current limitations of tracer-aided mixing models?

Despite their power, mixing models still face many constraints. End-member signatures vary in space and time, are sometimes too similar to distinguish, and some sources may be overlooked entirely. Non-conservative tracers such as nitrate or sulfate can react with their environment along their journey, thereby biasing results if these reactions are not explicitly accounted for.

Sampling is another major bottleneck. Capturing the spatial heterogeneity of soils, snowpacks, and groundwater requires a lot of measurements that are often logistically or financially prohibitive, especially in remote regions. Many of the newer, more powerful tracers such as noble gases or stable isotopes of trace elements, can only be analyzed by a handful of specialized laboratories. As a result, global coverage remains highly uneven, with key regions such as the Arctic and the global South still under-sampled.

What are some of the major unsolved questions and where is more research needed?

There are several fronts where more research is needed. Source signatures are not static, and methods that explicitly capture their variability in time are still underdeveloped. Embedding tracers within global Earth System Models would, in theory, enable more accurate assessment of hydrological partitioning e.g., how rainfall, snowmelt, and glacier melt are split between sublimation, evapotranspiration, groundwater, and streamflow. These will directly inform more robust climate projections, but this remains technically demanding.

Expanding data coverage in under-sampled regions is critical, and citizen science and low-cost sensors may help. Machine learning is a promising approach for uncovering non-linear relationships and gap-filling sparse datasets, but requires training data that often do not yet exist. Greater interdisciplinary integration, e.g., combining tracers with remote sensing, ecological indicators, and biogeochemical data, could yield a more holistic view of the Critical Zone. Finally, the field would benefit from shared protocols and open data practices to enhance progress.

—Andrea L. Popp (andrea.popp@smhi.se; 0000-0003-3911-8105), Swedish Meteorological and Hydrological Institute, Sweden; Harsh Beria (hberia@ethz.ch; 0000-0003-2597-9449), ETH Zurich, Switzerland

Editor’s Note: It is the policy of AGU Publications to invite the authors of articles published in Reviews of Geophysics to write a summary for Eos Editors’ Vox.

Citation: Popp, A. L., and H. Beria (2026), Tracing water’s hidden journey through the Earth’s living skin, Eos, 107, https://doi.org/10.1029/2026EO265019. Published on 13 May 2026.
This article does not represent the opinion of AGU, Eos, or any of its affiliates. It is solely the opinion of the author(s).
Text © 2026. The authors. CC BY-NC-ND 3.0
Except where otherwise noted, images are subject to copyright. Any reuse without express permission from the copyright owner is prohibited.

  • ✇Eos
  • Hydrothermal Heat Flow as a Window into Subsurface Arc Magmas Benjamin A. Black · S. E. Ingebritsen and Kazuki Sawayama
    Editors’ Vox is a blog from AGU’s Publications Department. The supply of magma from the Earth’s mantle is a primary source of heat to volcanic arc crust, where the heat is then dissipated through various processes. Much of this magmatic heat is dissipated as heated water, or aqueous fluid. A new article in Reviews of Geophysics compares 11 different volcanic-arc segments where heat discharge via aqueous fluid has been well-inventoried to better understand the factors that influence this p
     

Hydrothermal Heat Flow as a Window into Subsurface Arc Magmas

Three scientists working on the side of a mountain.
Editors’ Vox is a blog from AGU’s Publications Department.

The supply of magma from the Earth’s mantle is a primary source of heat to volcanic arc crust, where the heat is then dissipated through various processes. Much of this magmatic heat is dissipated as heated water, or aqueous fluid.

A new article in Reviews of Geophysics compares 11 different volcanic-arc segments where heat discharge via aqueous fluid has been well-inventoried to better understand the factors that influence this process. Here, we asked the authors to give an overview of heat discharge from volcanic arcs, how scientists measure it, and what questions remain.

Why is it important to study how heat is dissipated from volcanic arcs?

The heat from these magmas matters for geothermal energy, patterns of groundwater flow, and the patterns of volcanic activity at the surface.

Volcanic arcs are the chains of volcanoes on top of subduction zones. They can produce some of Earth’s most explosive and hazardous eruptions. But much of the magma beneath the surface never erupts. Nevertheless, the heat from these magmas—and the simple fact of their existence and abundance—still matters for geothermal energy, patterns of groundwater flow, and the patterns of volcanic activity at the surface.

What are the main modes in which heat is discharged from volcanic arcs?

Heat at volcanic arcs can be carried by magmas, transmitted through the crust conductively, and carried by water seeping slowly through the crust. At the base of the crust, magmas are probably most important, with conduction coming in second. But as magmas move upwards through the crust, some of them solidify and impart their heat to their surroundings where it is transferred by conduction. Within a few kilometers of the surface, fluids seeping through the crust begin to take up all that heat, and so if we can quantify the heat carried by those fluids, we can retrace it to its origins in magmas.

How do scientists measure these different forms of heat loss?

Scientists measure the heat carried by erupting magmas using satellites, or by adding up the erupted masses and making an estimate of how much energy was released by cooling from eruption temperatures to solid igneous rocks at Earth’s surface. Conductive heat flow is measured by drilling holes in the Earth’s crust to see how quickly it gets hotter with depth.

Measuring the heat carried by aqueous fluids in the crust is in some ways the trickiest. One approach is to find all the springs where hot or even slightly warm water is trickling out and measure the temperature and discharge to estimate how much extra heat that water is carrying.

What are the challenges and uncertainties in measuring hydrothermal heat discharge?

One challenge is that many springs are only slightly warmer than you’d expect. There is good data for many hot springs, but there are data tracking these ‘slightly warm’ springs for only a subset of arcs. Another challenge is that warm underground fluids can flow laterally, so you have to try to account for that. This is not an uncertainty in hydrothermal discharge, but one additional big uncertainty for our study, where we were trying to quantify the proportion of magmas that freeze underground versus erupting, is in the estimates of how much magma has actually erupted through time.

What are some of the factors that influence hydrothermal heat loss?

A major goal of our paper is to try to quantify these hidden magmas.

A main factor that influences hydrothermal heat loss is the magmas that solidify underground. This link is the key motivation for our study. A major goal of our paper is to try to quantify these hidden magmas—how much magma needs to intrude the crust beneath the surface to supply the hydrothermal heat fluxes that we observe? The composition of magmas influences how much heat they can release. The depth at which magmas are emplaced also matters, because magmas that intrude the shallow crust eventually cool to lower temperatures than magmas emplaced in the lower crust and therefore release more heat.

What are the remaining questions or knowledge gaps where additional research efforts are needed?

A big outstanding challenge is combining estimates from hydrothermal data of how much magma is coming into the crust – like ours – with other approaches to estimating the same thing. The magmatic systems beneath volcanoes span the crust. At the base of the crust, you have magma supply, sort of like the water main feeding your plumbing system. Despite how fundamental magma supply is, we know remarkably little about it. It’s exciting to think about how the rates of magma supply could vary through time and space and why. Applying a range of techniques—including geophysical imaging, hydrothermal budgets, gas and igneous geochemistry, and petrology—to understand these questions could really be a game changer.

—Benjamin A. Black (bblack@eps.rutgers.edu; 0000-0003-4585-6438), Rutgers University, United States; S. E. Ingebritsen (steve.ingebritsen@gmail.com; 0000-0001-6917-9369), Kyoto University, Japan; and Kazuki Sawayama (sawayama@bep.vgs.kyoto-u.ac.jp; 0000-0001-7988-3739), Kyoto University, Japan

Editor’s Note: It is the policy of AGU Publications to invite the authors of articles published in Reviews of Geophysics to write a summary for Eos Editors’ Vox.

Citation: Black, B. A., S. E. Ingebritsen, and K. Sawayama (2026), Hydrothermal heat flow as a window into subsurface arc magmas, Eos, 107, https://doi.org/10.1029/2026EO265017. Published on 28 April 2026.
This article does not represent the opinion of AGU, Eos, or any of its affiliates. It is solely the opinion of the author(s).
Text © 2026. The authors. CC BY-NC-ND 3.0
Except where otherwise noted, images are subject to copyright. Any reuse without express permission from the copyright owner is prohibited.
  • ✇Eos
  • Can Any Single Satellite Keep Up with the World’s Floods? Chloe Campo
    Editors’ Vox is a blog from AGU’s Publications Department. As climate change increases the frequency and intensity of flooding, it’s becoming increasingly important to monitor and predict flood hazards at different scales. A new article in Reviews of Geophysics presents a data-driven performance analysis of various space-based sensors that monitor flood hazards. Here, we asked the lead author to give an overview of satellite-based flood monitoring, the benefits and challenges of using satell
     

Can Any Single Satellite Keep Up with the World’s Floods?

20 April 2026 at 13:32
Satellite image of a river with highlights indicating flood areas.
Editors’ Vox is a blog from AGU’s Publications Department.

As climate change increases the frequency and intensity of flooding, it’s becoming increasingly important to monitor and predict flood hazards at different scales. A new article in Reviews of Geophysics presents a data-driven performance analysis of various space-based sensors that monitor flood hazards. Here, we asked the lead author to give an overview of satellite-based flood monitoring, the benefits and challenges of using satellite-based sensors, and future space-based projects.

Why is it important to monitor the surface waters on Earth? 

More than half of the world’s population lives within three kilometers of a freshwater body. When seasonal flooding behaves as anticipated, it provides essential nutrient replenishment to soils and crops. However, extreme flooding disturbs the careful balance of freshwater systems and can cause damaging flooding that disrupts livelihoods.

Climate change is making these extremes more frequent and less predictable, while expanding populations in flood-prone areas amplify the human cost. Continuous monitoring of Earth’s surface waters is essential as it helps us anticipate hazards, evaluate risk, and design interventions that protect the people and places most exposed to hydrologic hazards.

What are the benefits of monitoring flood inundation from space compared to other techniques? 

Monitoring flood inundation from space is advantageous due to the wide-scale global coverage that captures important information over large areas. In-situ sensors, such as river gauges, provide valuable data but are limited in spatial coverage and may even fail under significant flood conditions. A single satellite overpass can potentially capture an entire river basin, allowing responders to see where water has spread, which communities are affected, and how the event is evolving.

When did scientists first start using satellites to monitor surface waters?

The value of monitoring surface water from space was first realized in the early 1970s, following the launch of Landsat 1. Soon after launch, it captured imagery of the devastating 1973 Mississippi River floods, producing one of the first flood maps made from space (Figure 1).  By the early 2000s, NASA’s MODIS sensors were providing global coverage at a daily frequency. Today, multiple global flood monitoring systems are in place, including the European Union’s Copernicus Emergency Management Service, which maps floods using Sentinel-1 synthetic aperture radar (SAR), and NOAA’s VIIRS Flood Mapping system.

Figure 1. Imagery from the start of the Landsat 1 mission illustrating the extent of the Mississippi River flooding of 1973 (EROS History Project). The Earth Resources Technology Satellite 1 (ERTS-1) was renamed Landsat 1 in 1975. Credit: USGS

What are the three types of satellite-based sensors that your review focuses on? 

Our review examines three families. Multispectral (optical and thermal) sensors capture reflected sunlight or emitted heat. Microwave sensors, including SAR, passive microwave radiometers, and GNSS Reflectometry (GNSS-R), can observe through clouds and at night but involve trade-offs between resolution and coverage. Finally, altimetric sensors measure water surface elevation with high precision but only along narrow tracks. Each family has distinct strengths and weaknesses that lend themselves to use in combination for comprehensive flood inundation monitoring.

What are some of the challenges of using satellite-based sensors to monitor flooding?

The fundamental problem is that floods and satellite observations are mismatched in time and space. Optical sensors often capture clouds rather than the floodwater beneath. Cloud-penetrating sensors like SAR can miss flood peaks if their orbital schedule doesn’t align with the event, and dense vegetation can obstruct floodwater from both optical and shorter-wavelength radar. Sensors with high temporal resolution typically deliver data at coarse spatial resolutions, sometimes tens of kilometers per pixel. These trade-offs form what we describe as the “iron triangle” of Earth observation: temporal resolution, spatial resolution, and cost. A sensor can typically be optimized for two, but rarely all three. Occasionally, the timing and conditions of a flood align well with sensors whose strengths are complementary across the iron triangle, yielding the kind of multi-sensor view shown in Figure 2.

Figure 2. Sentinel‐2 MSI True Color Image with Sentinel‐1 SAR derived flood‐extent superimposed on top. The top right circle highlights the missing SAR‐derived information, whereas the bottom circle highlights the missing optical information. Credit: Campo et al. [2026], Figure 5

What are some upcoming space-based sensor projects that could advance the field of hydrology?

Several are already reshaping the field. NISAR, a joint NASA–ISRO radar satellite launched in 2025, carries an L-band sensor designed to penetrate vegetation canopy, providing new insights into flooding beneath vegetation. Sentinel-1D, launched in late 2025, has restored the Sentinel-1 constellation to full two-satellite capacity, halving the revisit time. Landsat Next, a planned three-satellite constellation with 26 spectral bands and a six-day revisit, would provide valuable hydrologic data at both high temporal and spectral resolutions. However, recent budget pressures have introduced uncertainty about its final scope. Finally, the HydroGNSS mission from ESA will use GNSS-R to monitor hydrologically linked Essential Climate Variables.

—Chloe Campo (S4088633@student.rmit.edu.au; 0009-0007-4259-300X), Royal Melbourne Institute of Technology University: Melbourne, Australia

The logo for the United Nations Sustainable Development Goal 13 is at left. To its right is the following text: The research reported here supports Sustainable Development Goal 13. AGU is committed to supporting the United Nations 2030 Agenda for Sustainable Development, which provides a shared blueprint for peace and prosperity for people and the planet, now and into the future.

Editor’s Note: It is the policy of AGU Publications to invite the authors of articles published in Reviews of Geophysics to write a summary for Eos Editors’ Vox.

Citation: Campo, C. (2026), Can any single satellite keep up with the world’s floods?, Eos, 107, https://doi.org/10.1029/2026EO265016. Published on 20 April 2026.
This article does not represent the opinion of AGU, Eos, or any of its affiliates. It is solely the opinion of the author(s).
Text © 2026. The authors. CC BY-NC-ND 3.0
Except where otherwise noted, images are subject to copyright. Any reuse without express permission from the copyright owner is prohibited.
❌
Subscriptions