Editors’ Highlights are summaries of recent papers by AGU’s journal editors.
Source: Journal of Geophysical Research: Earth Surface
Permafrost beneath Arctic roads is warming and becoming less stable, creating growing risks for northern infrastructure. Yet predicting how frozen ground will evolve remains difficult because subsurface conditions vary sharply over short distances, observations are sparse, and conventional process-based models are not easy to update as new field data arrive.
Source: Journal of Geophysical Research: Earth Surface
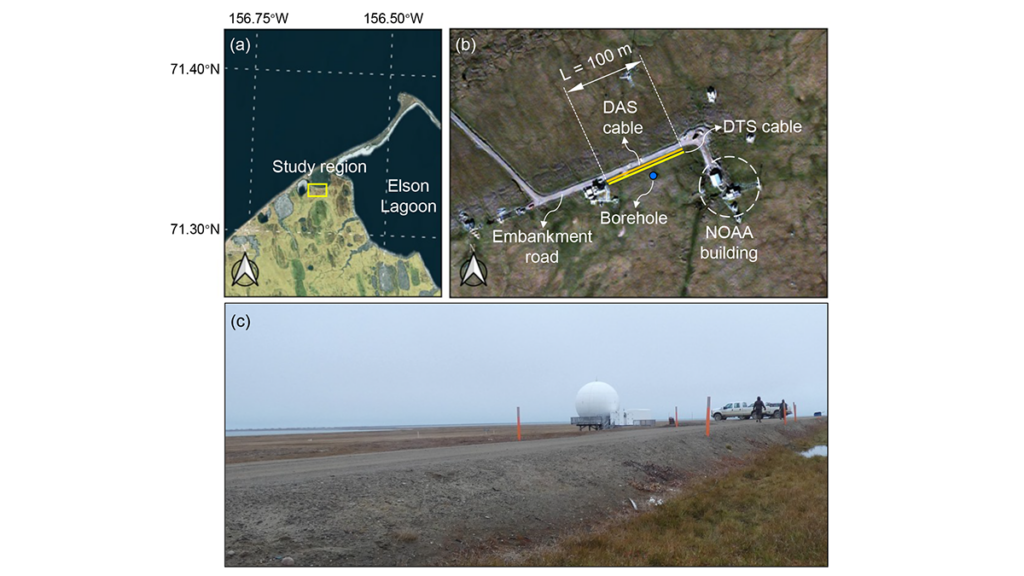
Permafrost beneath Arctic roads is warming and becoming less stable, creating growing risks for northern infrastructure. Yet predicting how frozen ground will evolve remains difficult because subsurface conditions vary sharply over short distances, observations are sparse, and conventional process-based models are not easy to update as new field data arrive. In a new study, Gou et al. [2026] address that challenge at an embankment road in Utqiaġvik, Alaska, using fiber-optic temperature measurements collected along a 100-meter transect to track how shallow ground conditions change through time. Rather than treating monitoring and modeling as separate tasks, the authors link them in a framework designed to evolve with the physical system itself.
What stands out here is not simply the use of machine learning, but the way the authors build a physics-informed digital twin for permafrost under infrastructure. Their framework embeds a neural network within a heat-transfer solver, so the governing physics remain central while the model can still update uncertain soil properties as new observations arrive. This study moves beyond black-box prediction toward an interpretable, updateable system that can reconstruct subsurface temperature fields, infer thermodynamic properties such as unfrozen water content and thermal conductivity, and then test those inferences against independent DAS data, borehole temperatures, and laboratory measurements. This makes the work more than a site-specific modeling exercise; it offers a credible pathway toward near-real-time permafrost forecasting and infrastructure monitoring in a rapidly warming Arctic.
Framework of the proposed digital twin model. The neural network (NN) takes soil temperature at each lateral position as input and outputs six unknown parameters that vary laterally with distance. These parameters are embedded in the heat‐transfer equation through constitutive relationships, and the resulting system is solved using a finite difference method (FDM). The difference between predicted and observed temperatures is computed and defined as “loss,” and the loss gradients are backpropagated to update the NN parameters. Credit: Gou et al. [2026], Figure 2
Citation: Gou, L., Xiao, M., Zhu, T., Martin, E. R., Wang, Z., Rocha dos Santos, G., et al. (2026). Physics-informed digital twin for predicting permafrost thermodynamic characteristics under an embankment road in Utqiaġvik, Alaska. Journal of Geophysical Research: Earth Surface, 131, e2025JF008787. https://doi.org/10.1029/2025JF008787
Editors’ Highlights are summaries of recent papers by AGU’s journal editors.
Source: AGU Advances
The critical zone (CZ) refers to the layer of Earth extending from the bedrock up to the vegetation canopy, including interconnected systems such as river and floodplain corridors, the active soil and root zone, and the near-surface environment where plants interact with the atmosphere. The conservation of the CZ requires a detailed understanding of how it evolves under anthropogenic impacts,
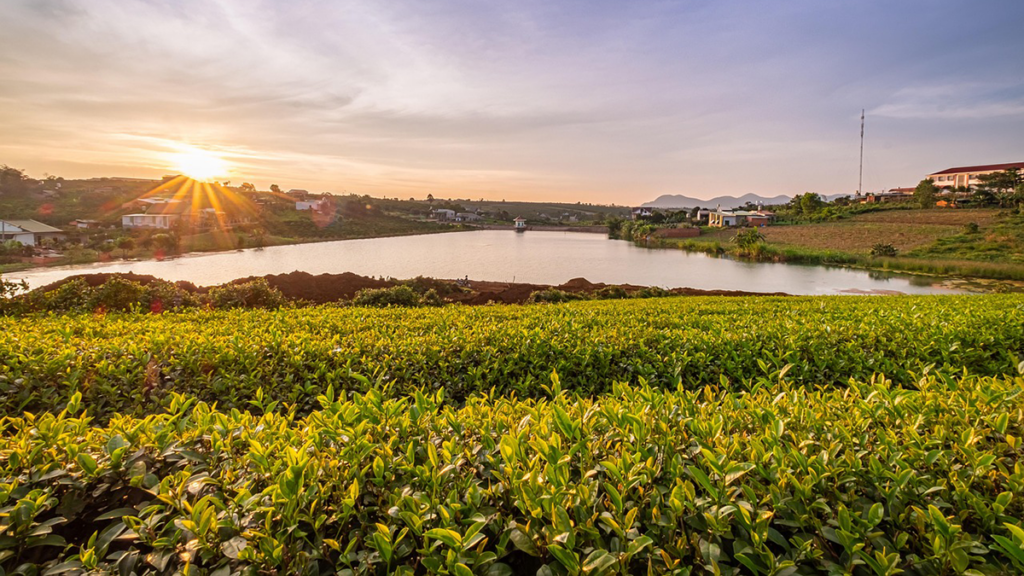
The critical zone (CZ) refers to the layer of Earth extending from the bedrock up to the vegetation canopy, including interconnected systems such as river and floodplain corridors, the active soil and root zone, and the near-surface environment where plants interact with the atmosphere. The conservation of the CZ requires a detailed understanding of how it evolves under anthropogenic impacts, such as intensive agriculture.
Goodwell et al. [2026] use a data driven approach to relate shifts in the critical zone to indicators of human impact. Their findings deliver innovative knowledge on transitions, drivers, and predictability in many contexts, and support better prediction and management of the critical zone under environmental change.
In particular, the authors find evidence of abrupt shifts in the variability of key features like stream and soil chemistry, land-atmosphere interaction and so forth, which can be attributed to intensive management, for instance due to mechanized planting and harvesting. These human-impacted and naturally appearing regimes in the dynamics of critical zone have implications for understanding processes and making predictions of the status of the critical zone under environmental change.
Data-driven methods include grouping of time-series data with clustering to detect regimes, dimensionality reduction to simplify system dynamics and identify main sources of variability. Credit: Goodwell et al. [2026], Figure 1
Citation: Goodwell, A. E., Saccardi, B., Dere, A., Druhan, J., Wang, J., Welp, L. R., et al. (2026). Detecting regimes of critical zone processes, drivers and predictability with a data-driven framework. AGU Advances, 7, e2025AV002098. https://doi.org/10.1029/2025AV002098
Editors’ Highlights are summaries of recent papers by AGU’s journal editors.
Source: AGU Advances
The albedo change of marine clouds is achieved by targeted additions of aerosols, and in particular, sea salt. To assess the viability of Marine Cloud Brightening (MCB) requires a fundamental understanding of the impact of aerosols on cloud evolution and properties, and on the cloud environment.
Doherty et al. [2026] propose a framework for studying MCB across scales. This includes small-
The albedo change of marine clouds is achieved by targeted additions of aerosols, and in particular, sea salt. To assess the viability of Marine Cloud Brightening (MCB) requires a fundamental understanding of the impact of aerosols on cloud evolution and properties, and on the cloud environment.
Doherty et al. [2026] propose a framework for studying MCB across scales. This includes small- to large-scale studies aimed at systematically characterizing the life-cycle of aerosols and the diurnal cycle of cloud processes, how these change with the magnitude, duration and type of aerosol applied, and monitoring potential harmful direct or indirect consequences of aerosol injection, such as regional changes in temperature or precipitation.
Possible configuration for a Stage III study for measuring local scale cloud responses to a single plume of generated sea salt aerosol sized for marine cloud brightening. Credit: Doherty et al. [2026], Figure 4
Citation: Doherty, S. J., Diamond, M. S., Wood, R., & Hirasawa, H. (2026). Defining scales of field studies and experiments to assess marine cloud brightening. AGU Advances,7, e2025AV001939. https://doi.org/10.1029/2025AV001939
Editors’ Highlights are summaries of recent papers by AGU’s journal editors.
Source: AGU Advances
The evolution of rivers that split into multiple channels is a scientific challenge in terms of modeling and prediction. On the other hand, these rivers are widespread and play a key role for ecosystems’ life, groundwater recharge, and therefore, water security. They are also extremely sensitive to hydroclimatic changes, leading to shifts in precipitation, erosion and sediment transport.
Z
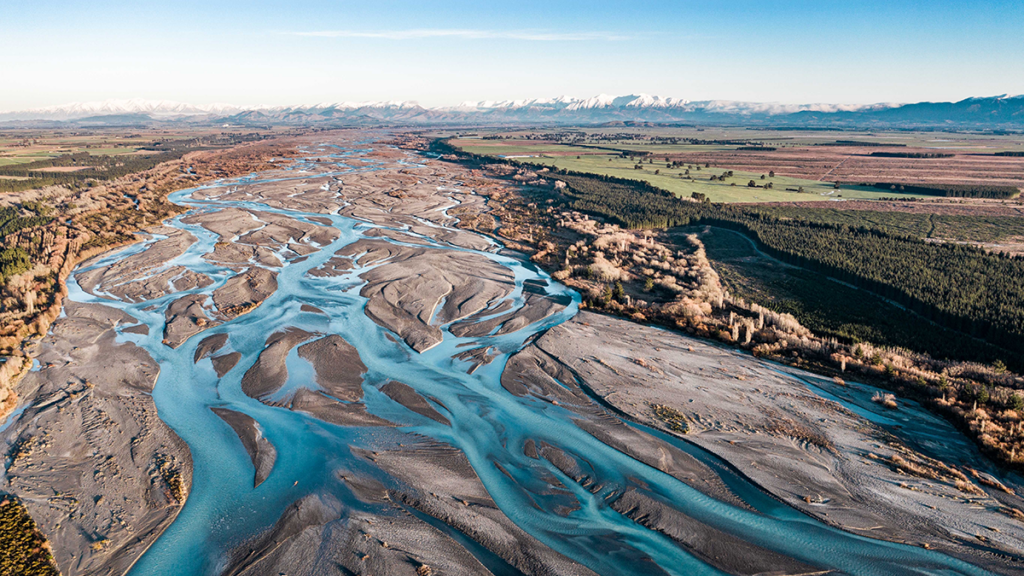
The evolution of rivers that split into multiple channels is a scientific challenge in terms of modeling and prediction. On the other hand, these rivers are widespread and play a key role for ecosystems’ life, groundwater recharge, and therefore, water security. They are also extremely sensitive to hydroclimatic changes, leading to shifts in precipitation, erosion and sediment transport.
Zhao et al. [2026] investigate the drivers of river evolution for 97 multithread river reaches worldwide, spanning diverse climates and morphologies. The study reveals the key role of intermittency for river evolution. In particular, higher flow intermittency could lead to more even flow partitioning among threads, therefore impacting hydrology and ecosystems. With flow variability increasing after climate change, rivers are likely to increase their thread count, thus impacting livelihoods and ecosystems.
Two example multithread reaches shown in Landsat images from (b) the Irtysh River (wandering) and (c) the Yukon River (braided). Credit: Zhao et al. [2026], Figure 1(b,c)
Citation: Zhao, F., Ganti, V., Chadwick, A., Greenberg, E., McLeod, J., Liu, Y., et al. (2026). Global hydroclimatic controls on multithread River dynamics. AGU Advances, 7, e2025AV002166. https://doi.org/10.1029/2025AV002166
Editors’ Highlights are summaries of recent papers by AGU’s journal editors.
Source: Journal of Geophysical Research: Atmospheres
The 2018 Camp Fire was the deadliest and most destructive wildfire in California history. The Camp Fire spread extremely rapidly, driven by strong winds and dry fuels, but also by organized long-range spotting, i.e. lofting and downwind fallout of burning embers to ignite new fires.
Using operational Doppler radar and satellite observations, Lareau [2026] pr
Source: Journal of Geophysical Research: Atmospheres
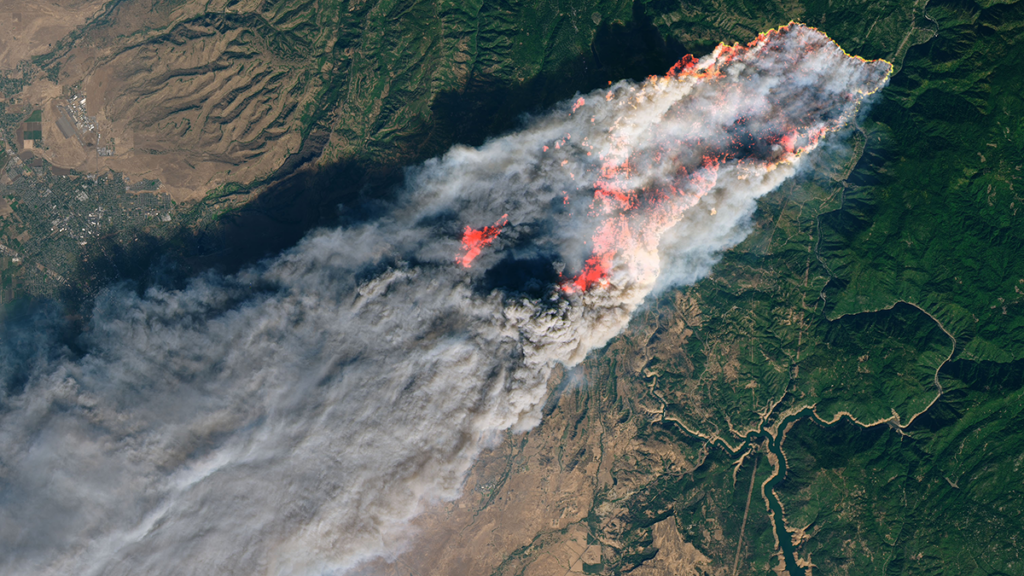
The 2018 Camp Fire was the deadliest and most destructive wildfire in California history. The Camp Fire spread extremely rapidly, driven by strong winds and dry fuels, but also by organized long-range spotting, i.e. lofting and downwind fallout of burning embers to ignite new fires.
Using operational Doppler radar and satellite observations, Lareau [2026] provides the first high resolution depiction of spotting behavior during an extreme wildfire. Observations show that spot fire events for the Camp Fire occurred 5-10 kilometers ahead of the fire front, quickly merging into new fire lines. Spot fires are not random but aligned within coherent fallout zones that are shaped by plume dynamics and background winds. These results show that operational weather radar can identify lofting and fallout regions in real time, providing a new way to anticipate spotting-driven fire spread and improve early warnings for fast-moving wildfires.
(a) Along wind cross section of Camp Fire plume reflectivity observed by radar measurements, showing distinct updrafts (white arrows) and ashfall regions (blue dashed arrow). Spot fires within 10 minutes of these radar measurements are shown as filled cyan triangles. (b) Map of column maximum radar reflectivity and fire perimeter. In both panels the black dashed line indicates the eastern edge of the town of Paradise, California. Credit: Lareau [2026], Figure 6ab
Citation: Lareau, N. P. (2026). Plume-coupled long-range spotting drove the explosive spread of the 2018 Camp Fire. Journal of Geophysical Research: Atmospheres, 131, e2025JD045798. https://doi.org/10.1029/2025JD045798
Editors’ Vox is a blog from AGU’s Publications Department.
As climate change increases the frequency and intensity of flooding, it’s becoming increasingly important to monitor and predict flood hazards at different scales. A new article in Reviews of Geophysics presents a data-driven performance analysis of various space-based sensors that monitor flood hazards. Here, we asked the lead author to give an overview of satellite-based flood monitoring, the benefits and challenges of using satell
As climate change increases the frequency and intensity of flooding, it’s becoming increasingly important to monitor and predict flood hazards at different scales. A new article in Reviews of Geophysics presents a data-driven performance analysis of various space-based sensors that monitor flood hazards. Here, we asked the lead author to give an overview of satellite-based flood monitoring, the benefits and challenges of using satellite-based sensors, and future space-based projects.
Why is it important to monitor the surface waters on Earth?
More than half of the world’s population lives within three kilometers of a freshwater body. When seasonal flooding behaves as anticipated, it provides essential nutrient replenishment to soils and crops. However, extreme flooding disturbs the careful balance of freshwater systems and can cause damaging flooding that disrupts livelihoods.
Climate change is making these extremes more frequent and less predictable, while expanding populations in flood-prone areas amplify the human cost. Continuous monitoring of Earth’s surface waters is essential as it helps us anticipate hazards, evaluate risk, and design interventions that protect the people and places most exposed to hydrologic hazards.
What are the benefits of monitoring flood inundation from space compared to other techniques?
Monitoring flood inundation from space is advantageous due to the wide-scale global coverage that captures important information over large areas. In-situ sensors, such as river gauges, provide valuable data but are limited in spatial coverage and may even fail under significant flood conditions. A single satellite overpass can potentially capture an entire river basin, allowing responders to see where water has spread, which communities are affected, and how the event is evolving.
When did scientists first start using satellites to monitor surface waters?
The value of monitoring surface water from space was first realized in the early 1970s, following the launch of Landsat 1. Soon after launch, it captured imagery of the devastating 1973 Mississippi River floods, producing one of the first flood maps made from space (Figure 1). By the early 2000s, NASA’s MODIS sensors were providing global coverage at a daily frequency. Today, multiple global flood monitoring systems are in place, including the European Union’s Copernicus Emergency Management Service, which maps floods using Sentinel-1 synthetic aperture radar (SAR), and NOAA’s VIIRS Flood Mapping system.
Figure 1. Imagery from the start of the Landsat 1 mission illustrating the extent of the Mississippi River flooding of 1973 (EROS History Project). The Earth Resources Technology Satellite 1 (ERTS-1) was renamed Landsat 1 in 1975. Credit: USGS
What are the three types of satellite-based sensors that your review focuses on?
Our review examines three families. Multispectral (optical and thermal) sensors capture reflected sunlight or emitted heat. Microwave sensors, including SAR, passive microwave radiometers, and GNSS Reflectometry (GNSS-R), can observe through clouds and at night but involve trade-offs between resolution and coverage. Finally, altimetric sensors measure water surface elevation with high precision but only along narrow tracks. Each family has distinct strengths and weaknesses that lend themselves to use in combination for comprehensive flood inundation monitoring.
What are some of the challenges of using satellite-based sensors to monitor flooding?
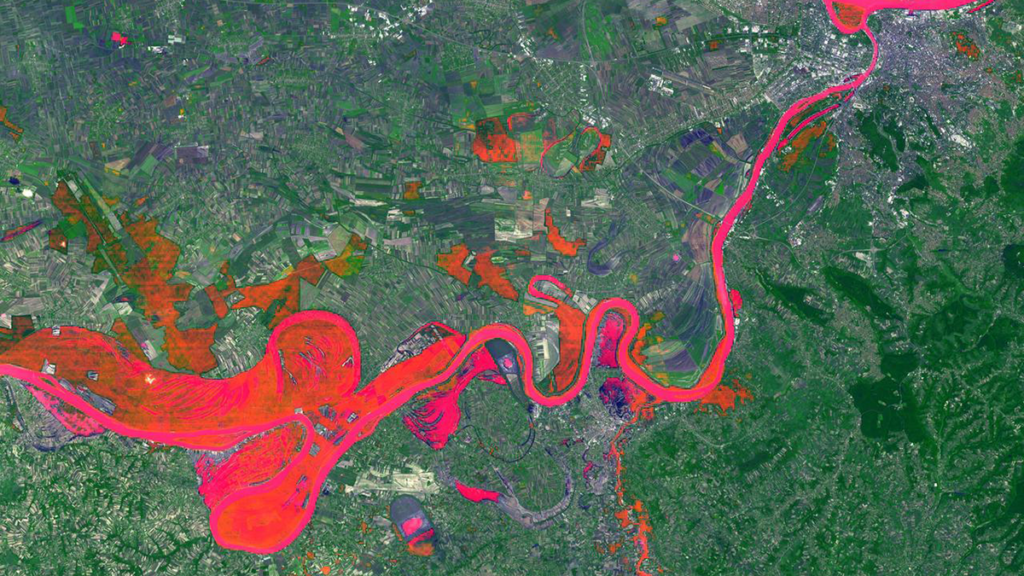
The fundamental problem is that floods and satellite observations are mismatched in time and space. Optical sensors often capture clouds rather than the floodwater beneath. Cloud-penetrating sensors like SAR can miss flood peaks if their orbital schedule doesn’t align with the event, and dense vegetation can obstruct floodwater from both optical and shorter-wavelength radar. Sensors with high temporal resolution typically deliver data at coarse spatial resolutions, sometimes tens of kilometers per pixel. These trade-offs form what we describe as the “iron triangle” of Earth observation: temporal resolution, spatial resolution, and cost. A sensor can typically be optimized for two, but rarely all three. Occasionally, the timing and conditions of a flood align well with sensors whose strengths are complementary across the iron triangle, yielding the kind of multi-sensor view shown in Figure 2.
Figure 2. Sentinel‐2 MSI True Color Image with Sentinel‐1 SAR derived flood‐extent superimposed on top. The top right circle highlights the missing SAR‐derived information, whereas the bottom circle highlights the missing optical information. Credit: Campo et al. [2026], Figure 5
What are some upcoming space-based sensor projects that could advance the field of hydrology?
Several are already reshaping the field. NISAR, a joint NASA–ISRO radar satellite launched in 2025, carries an L-band sensor designed to penetrate vegetation canopy, providing new insights into flooding beneath vegetation. Sentinel-1D, launched in late 2025, has restored the Sentinel-1 constellation to full two-satellite capacity, halving the revisit time. Landsat Next, a planned three-satellite constellation with 26 spectral bands and a six-day revisit, would provide valuable hydrologic data at both high temporal and spectral resolutions. However, recent budget pressures have introduced uncertainty about its final scope. Finally, the HydroGNSS mission from ESA will use GNSS-R to monitor hydrologically linked Essential Climate Variables.
Editor’s Note: It is the policy of AGU Publications to invite the authors of articles published in Reviews of Geophysics to write a summary for Eos Editors’ Vox.
Citation: Campo, C. (2026), Can any single satellite keep up with the world’s floods?, Eos, 107, https://doi.org/10.1029/2026EO265016. Published on 20 April 2026.
This article does not represent the opinion of AGU, Eos, or any of its affiliates. It is solely the opinion of the author(s).