Normal view

  • ✇Eos
  • Melting Glaciers Make the Coastal Ocean More Sensitive Henry C. Henson
    When we picture the effects of melting glaciers, many of us think of rising seas and retreating ice streams. But along Greenland’s coastline, a quieter transformation is underway, one that is affecting how the ocean breathes and how it reacts to and buffers itself against change. In Young Sound, a fjord carved into Greenland’s remote northeastern coast, decades of monitoring have revealed that glacial meltwater does not simply dilute the salt in seawater. As fresh water enters the ocean, it
     

Melting Glaciers Make the Coastal Ocean More Sensitive

16 April 2026 at 13:09
Aerial view of a small research boat sitting in blue-green water in front of glaciated mountains that rise steeply from the shoreline.

When we picture the effects of melting glaciers, many of us think of rising seas and retreating ice streams. But along Greenland’s coastline, a quieter transformation is underway, one that is affecting how the ocean breathes and how it reacts to and buffers itself against change.

In Young Sound, a fjord carved into Greenland’s remote northeastern coast, decades of monitoring have revealed that glacial meltwater does not simply dilute the salt in seawater. As fresh water enters the ocean, it weakens the ocean’s natural chemical resistance to swings in acidity. This so-called buffering capacity keeps seawater pH in balance. The loss of buffering due to freshwater runoff leaves these coastal waters unusually sensitive to even small biological and environmental shifts.

Atmospheric warming is accelerating fastest in the Arctic, and with it come longer glacial melt seasons and increased freshwater runoff. The result is a coastal ocean that is both a frontline witness to climate change and a laboratory for understanding how the chemistry of the seas can change in unexpected ways.

The Ocean’s Chemical Safety Net

Seawater chemistry is naturally buffered by dissolved ions that act as chemical shock absorbers.

Globally, the ocean absorbs about a quarter of carbon dioxide (CO2) emissions each year. That uptake helps to slow climate change, but at a cost. The more CO2 that water absorbs, the more acidic it becomes. Thankfully, seawater chemistry is naturally buffered by dissolved ions—particularly carbonate, bicarbonate, and hydroxide—that act as chemical shock absorbers. These negatively charged ions, collectively called alkalinity, bind to the positive hydrogen ions released when carbonic acid forms, keeping the ocean’s pH relatively stable compared with the more variable conditions in freshwater rivers and lakes.

The polar oceans play a special role in this balance and in the global carbon cycle because cold waters at high latitudes take up carbon from the atmosphere faster than warm tropical waters. Yet these regions are also changing the most rapidly.

When Meltwater Meets the Sea

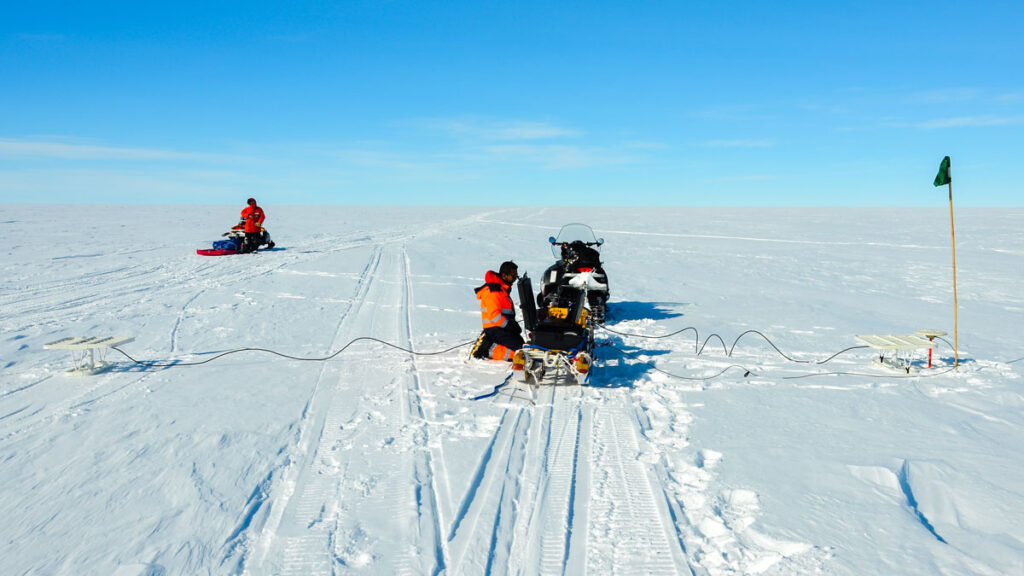
For 20 years, our team at Aarhus University has measured salinity, temperature, and carbon chemistry in Young Sound. Each August, we make the 2-day journey to northeast Greenland, where we spend the month sailing down the 90-kilometer-long fjord to capture these valuable measurements (Figure 1).

Satellite view over the glaciated islands and land of part of the northeastern Greenland coast. A red line maps the route of an August 2023 research cruise, and an inset map shows the location within Greenland.
Fig. 1. The red line, running from the Greenland Ice Sheet (y) to the Greenland Sea (z), maps the route taken by researchers in August 2023 during their annual transect of Young Sound in northeast Greenland. Credit: Adapted from Henson et al., 2025, https://doi.org/10.1038/s43247-025-02685-4, CC BY-NC-ND 4.0

During the time we have monitored this ecosystem, the melt season has lengthened, with sea ice–free conditions now lasting 8 days longer than 20 years ago. Glaciers feeding the fjord are also thinning and retreating, discharging about 5.5 million cubic meters more water into the fjord each year. These changes have freshened the coastal ocean and subtly, but significantly, altered its chemistry.

Fjords like these have long been known as major CO2 sinks. Surface waters near glaciers often have very low CO2 concentrations, creating a disequilibrium between CO2 levels in the surface ocean and the atmosphere that draws carbon out of the air. But how or why these glacial ecosystems act as carbon sinks and what mechanisms are at play haven’t been thoroughly described. We have also been deeply curious about what else happens when fresh water enters the sea. What are the hidden consequences of this change?

To find out, we paired our long-term field observations with controlled lab experiments in which we mixed glacial meltwater with seawater. Controlled experiments allow us to dig into the nuances of chemical changes that are impossible to measure in the field. We also ran mixing models that allowed us to estimate how the chemistry of those mixed waters responds to small shifts in biological activity or mineral interactions.

The results were striking. When meltwater mixes with seawater, it not only reduces salinity but also dilutes alkalinity, the measure of how well water can neutralize acid and buffer against pH change. This weakening of buffering capacity means that even small changes in photosynthesis or respiration can drive much larger swings in CO2 uptake and acidity than they would in more saline waters.

Aerial view looking across braided river streams and channel bars toward mountains, a glacier, and hills of glacial deposits in the distance. In the foreground, two researchers stand in the gray, sediment-filled waters of one of the streams.
Two researchers wade into a meltwater river in Tyrolerfjord in Northeast Greenland National Park in 2023 to collect samples bearing the chemical fingerprints of climate change in the region. Credit: Henry C. Henson

We found that in the freshened waters of Young Sound, these processes have 2–3 times the influence on carbon uptake that they do farther out at sea. In effect, meltwater primes the coastal ocean to overreact, amplifying any ecosystem changes that might occur.

Measurements from around Greenland show that this is not just a theoretical risk. Surface waters are measurably more acidic where meltwater inputs are high. The biological consequences of this trend are still uncertain, but species living at the edge of their tolerance, such as shell-forming plankton and Arctic cod larvae, could face growing stress as the chemistry of their habitat fluctuates more widely.

A Fragile Balance in the Freshening Arctic

The findings confirm that fjords absorb carbon as a result of biological activity and glacial input but indicate that they do so in a fragile, easily tipped state.

Our study adds nuance to conventional perceptions of carbon cycling in fjords, long seen as places where atmospheric CO2 is drawn down. The findings confirm that fjords absorb carbon as a result of biological activity and glacial input but indicate that they do so in a fragile, easily tipped state. Slight shifts in the processes that pull CO2 out of the air could tip the scales in either direction: toward even more uptake and the accompanying acidification or toward a release of CO2 to the atmosphere.

This chemical sensitivity explains why Arctic fjords can show such strong seasonal and spatial swings in carbon chemistry and why predicting their long-term role in the carbon cycle is difficult. As glaciers retreat and meltwater inputs grow, those sensitivities are likely to intensify.

At first glance, changes in how seawater in the narrow, remote fjords of Greenland reacts to glacial melt might sound like a local concern. But the chemical processes at play have global resonance.

  • A glacial tongue of the Greenland Ice Sheet curves through mountainous tundra.
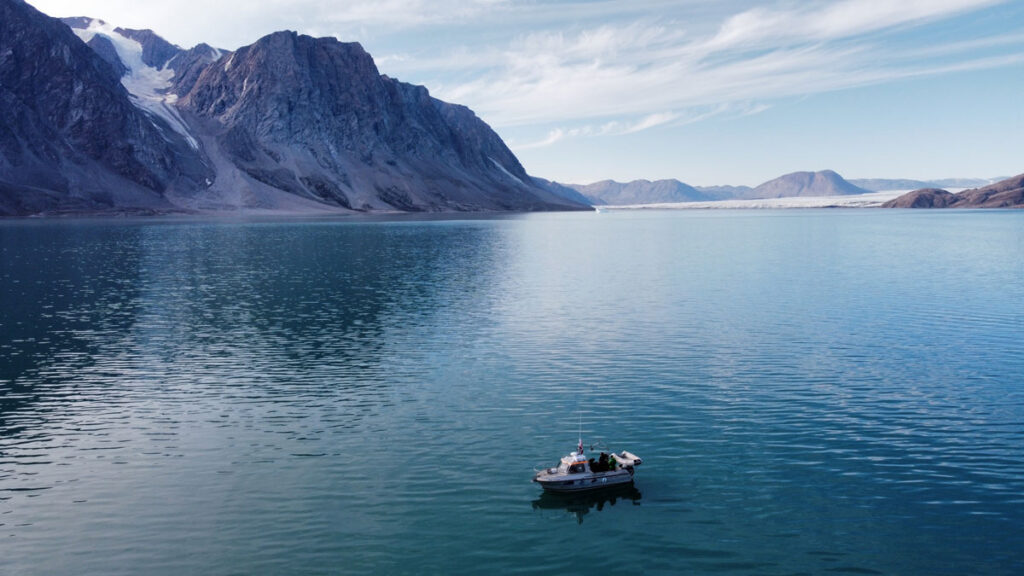
    A tongue of the Greenland Ice Sheet retreats along the tundra as temperatures across the Arctic warm. Credit: Henry C. Henson
  • Ridges in the Greenland Ice Sheet tell a story of movement and melt. Credit: Henry C. Henson
    Ridges in the Greenland Ice Sheet tell a story of movement and melt. Credit: Henry C. Henson
  • Ground-level view of gray-colored water rippling through a shallow river in a rocky valley between mountains.
    Glacial meltwater from the Greenland Ice sheet flows into Tyrolerfjord and Young Sound and in Northeast Greenland National Park in August 2023. Credit: Henry C. Henson

The Arctic Ocean as a whole is freshening, driven by accelerating ice melt as well as by increasing river discharge and changing weather bringing more precipitation to the region. Although river water, which arrives from the six great Arctic rivers of North America and Eurasia, is more alkaline than glacial melt, its alkalinity is only about half that of seawater. In other words, river runoff also increases the ocean’s chemical sensitivity. Fresh water also delivers organic matter from permafrost, fine sediments from glaciers, and tannin-rich runoff from tundra soils, each of which can influence carbon cycling and further compound changes already underway.

Similar patterns of increased rainfall and runoff reducing surface salinity are emerging around the Antarctic Peninsula, the Gulf of Alaska, and the North Atlantic. Almost everywhere that fresh water enters the ocean, it lowers alkalinity and limits the ocean’s ability to buffer change.

A Window into Climate Intervention

Our results also carry lessons for researchers and companies contemplating ocean chemistry interventions as ways to remove CO2 from the atmosphere. One proposed approach, ocean alkalinity enhancement, involves adding crushed minerals such as lime, olivine, and basalt to seawater to both counteract acidification and increase the ocean’s capacity to take up CO2.

Glacial systems already perform a natural version of this experiment by grinding rock into fine sediment and discharging it into the ocean. Minerals in this sediment react with seawater and shape its carbon chemistry.

Our study suggests that such reactions are especially potent in freshwater-influenced coastal regions, where reduced buffering capacity may amplify chemical responses not only from natural biological processes but also from potential human attempts to alter seawater chemistry. Thus, understanding the balance between carbon uptake and chemical vulnerability will be essential before any large-scale interventions are attempted.

Consequences Locally and Globally

Coastal communities from Greenland to Alaska to northern Eurasia depend on Arctic waters as part of their cultural identity and, by way of fisheries and tourism, for their economic and food security. As chemical buffering capacity declines, coastal ecosystems may become more susceptible to acidification and other environmental stresses. Small changes in temperature, ecosystem metabolism, or nutrient inputs could then have outsized effects on the marine life that supports these communities.

As coastal glaciers retreat and meltwater rivers carve new paths to the sea, they are doing more than raising sea level and reshaping coastlines. They are rewiring ocean chemistry.

At the same time, changing conditions in coastal Arctic ocean regions complicate scientific modeling of carbon cycling and climate feedbacks, which typically relies on averaged estimates of the ocean’s chemical reactivity. With meltwater making the coastal ocean more reactive, these seas may absorb or release CO2 more variably than how global predictions would suggest. In addition to the real effects on local ecosystems, seawater chemical variability could also affect the accuracy of modeled global carbon budgets, which we use to inform future climate projections and guide international policy goals.

As coastal glaciers retreat and meltwater rivers carve new paths to the sea, they are doing more than raising sea level and reshaping coastlines. They are rewiring ocean chemistry, leaving it fresher and more easily disturbed.

The chemical sensitivity we see in Greenland’s fjords today may be a preview of what is to come in many coastal regions. If so, then we must be concerned with not only how much CO2 the ocean can absorb but also how stably it can hold that CO2 in a rapidly changing world.

Author Information

Henry C. Henson (hch@ecos.au.dk), Aarhus University, Denmark

Citation: Henson, H. C. (2026), Melting glaciers make the coastal ocean more sensitive, Eos, 107, https://doi.org/10.1029/2026EO260116. Published on 16 April 2026.
Text © 2026. The authors. CC BY-NC-ND 3.0
Except where otherwise noted, images are subject to copyright. Any reuse without express permission from the copyright owner is prohibited.

New Directions in Mapping Ice Sheet Fabrics and Flow

Amid a wide open expanse of snow-covered ice sheet under a blue sky, a researcher crouches beside scientific equipment set atop a sled behind a snowmobile.

The retreat of glaciers and ice sheets is expected to have widespread impacts on communities around the world because of its effect on sea levels. Already, the global average sea level is more than 10 centimeters higher than it was just 3 decades ago; and the rate of rise is increasing, contributing to increased storm surges and flooding, lost infrastructure and community lands, and more.

Recent reports on the instability of Antarctica’s Thwaites Glacier, for example, have focused attention on how accelerating ice flow can lead to ice sheet collapse and rising sea levels.

Recent reports on the instability of Antarctica’s Thwaites Glacier, for example, have focused attention on how accelerating ice flow can lead to ice sheet collapse and rising sea levels. Yet there is still substantial uncertainty about how quickly Thwaites and other glaciers will lose ice, in part because we don’t fully understand the myriad processes that contribute to their mass balance.

Earth’s ice sheets accumulate ice through snowfall and lose mass through a mix of surface ablation, iceberg calving, and melting at their interface with the ocean. Glacial ice flows under its own weight, and the rate at which it flows to coastal areas is a primary control on ice sheet mass loss.

Flow rates depend on how much resistance an ice sheet encounters at its interface with the ground (e.g., whether it is frozen to its substrate) and on its effective viscosity, a measure of how strongly it resists deformation. The viscosity of ice, in turn, varies based on properties including temperature, crystal size and orientation, and impurity content.

Some properties within and beneath ice sheets that affect how they flow are anisotropic, meaning they vary by direction. For example, roughness in some directions at the ice bed can facilitate ice sliding more effectively than roughness in other directions, similar to the way a properly oriented corrugated metal roof allows snow to slide off. Several forms of anisotropy within ice also affect how ice flows from land to ocean (Figure 1).

Cross-sectional illustration of an ice sheet flowing toward the ocean with different sources anisotropy in ice fabric labeled. Aircraft- and ground-based radar sources are also shown, and an inset illustrates the concept of ice fabric.
Fig. 1. Anisotropy in glaciers and ice sheets has various sources, including from ice fabric and other properties within the ice (englacial) or at the ice-bed interface. Many forms of anisotropy in glacial ice can be measured with radar. Credit: Adapted from Hills et al., 2025, https://doi.org/10.1029/2024RG000842, CC BY 4.0

Measuring anisotropic properties is key to better understanding how quickly changes at the edges of the Greenland and Antarctic ice sheets will lead to sea level rise. Recent advances in ice-penetrating radar technology and in processing radar data are revolutionizing how we observe directionally varying ice sheet properties, paving the way for projections of mass changes that account for previously neglected processes.

Crystal Fabric: Memory and Modulator of Ice Flow

Fabric, the orientation of crystals composing ice, is the best studied and arguably most important of anisotropic ice sheet properties. As ice deforms, for example, by stretching horizontally as it flows toward the coast, its millimeter-scale crystals are reoriented (Figure 1).

Fabric thus contains a memory of past flow. Simultaneously, fabric influences flow because ice crystals are about 3 orders of magnitude easier to shear in some directions than others—similar to how stacked playing cards slide easily against each other when held along their edges but resist motion when pinched top to bottom.

Over the past 20 years, radar polarimetry has matured into a quicker and easier alternative means for inferring fabric.

The potential importance of fabric on large-scale ice flow has long been recognized, but a shortage of observations has made it difficult to quantify and validate its effect in ice sheet models. Until recently, fabric could be measured only directly in ice cores or inferred through seismic soundings. These methods provide highly detailed information about how fabric develops but are expensive, logistically taxing, and provide information only about sparse point locations.

Over the past 20 years, though, radar polarimetry has matured into a quicker and easier alternative means for inferring fabric, enabling observations at the scale of entire glaciers and providing new constraints on how fabric influences ice sheet flow.

How Radar Reveals Fabric

Ice-penetrating radar instruments emit electromagnetic energy as radio frequency waves. These waves reflect off interfaces within and beneath glacial ice, including transitions in ice chemistry and the contact surface between the ice sheet and the ground or water below. The properties of the reflected waves are then measured when they return to the radar. Just as fabric leads to anisotropic ice deformation, it also introduces directional dependence in the measured electrical properties.

The speed of a radar wave through an ice crystal is approximately 1% faster if the wave is polarized across the crystal’s principal (c) axis rather than aligned with it. Though small, this difference can compound enough that it causes measurable changes in returned radar signals.

In a typical radar survey over anisotropic ice, waves with different polarizations travel at slightly different speeds (Figure 2). The times that return signals arrive back at the receiver thus vary directionally, a difference that can be identified using polarimetric radars that transmit and receive radio waves at multiple orientations.

Cross-sectional illustration showing two sinusoidal waves, polarized in different directions, traveling down through a narrow, tall column of ice.

Fig. 2. Propagation of polarized radio waves through anisotropic ice reveals structural variations with depth because waves aligned across the prevailing ice fabric (represented by the ball, in which darker shading indicates a greater concentration of c axes) travel faster than waves aligned with the fabric. The phase delay increases as the effect of the anisotropy accumulates with depth. Credit: Adapted from Hills et al., 2025, https://doi.org/10.1029/2024RG000842, CC BY 4.0

Fabric’s effect on radar signal travel times accumulates through an ice column, so it is more prominent in thicker ice with stronger horizontal fabric (i.e., the ice crystals are more consistently aligned). In such cases, differences in travel times between polarizations can be measured even by standard radars.

When fabric is weaker or ice is thinner, the offset is smaller and detectable only by systems that can identify the phases of radar returns—that is, the exact positions of the returned waves in their oscillation cycle. Even small wave speed differences from weak fabrics accumulate into measurable phase shifts between polarizations, which can be used to determine the consistency of crystal alignment and the predominant crystal orientation.

Small differences in fabric through an ice column can also change the strength, or amplitude, of returned signals. This amplitude difference offers an independent way to identify fabric orientation and its depth variation.

Polarimetric radar has been widely applied in cryospheric science in recent years largely due to the advent of low-cost systems that can measure signal phases. For example, the popular Autonomous phase-sensitive Radio Echo Sounder (ApRES) is a lightweight, ground-based system that can be used to infer ice fabric at single points down to 2 kilometers deep. In the past decade, polarimetric ApRES systems have revealed ice flow histories, including changes in flow directions, of key glaciers over the past few millennia. These measurements offer windows into how ice sheets responded to previous climate variations.

A red, triangular-shaped sled containing radar equipment is towed across an expansive ice sheet.
A mobile, quad-polarimetric radar is dragged by snowmobile over the surface of Müller Ice Cap on Axel Heiberg Island in Nunavut, Canada, in May 2023. Credit: David Lilien

The next generation of polarimetric radars go beyond one-point-at-a-time stationary soundings, offering full polarimetry capabilities on moving platforms. These systems may soon allow scientists to map directional ice properties at the scale of entire ice sheets.

Insights into Fast-Flowing Ice Fabric

The growing number of radar studies conducted near sites where ice cores have been collected, which allow fabric to be investigated up close, has provided validation and bolstered confidence that fabric can be inferred accurately from its effects on radar. Researchers now infer fabric from radar in more dynamic areas, such as Thwaites Glacier, Whillans Ice Stream, and the Northeast Greenland Ice Stream (NEGIS), where ice fabrics change over short spatial scales and where drilling ice cores is logistically difficult. Airborne radar surveys are particularly effective in these settings because they can efficiently map fabric variations across large, fast-moving areas.

Observations of strong fabrics in fast-flowing regions suggest that fabric is an important control on ice viscosity, although its implications for ice flow are just beginning to be explored. For example, at Rutford Ice Stream in Antarctica, ApRES data indicate that fabric causes sharp changes in viscosity in different directions with depth, a complexity not captured by current ice flow models.

A combination of airborne and ground-based radar shows that the fabric of the NEGIS varies substantially across the ice stream, which facilitates horizontal shear that allows faster and more cohesive flow in the middle of the ice stream while simultaneously stiffening this ice against along-flow stretching. These viscosity variations may alter how quickly coastal changes, such as increased melt due to climate warming, influence inland ice flow.

Aerial view of a glacial ice tongue following through a valley between rocky sides.
Scientists have studied ice sheet mass balance at glacier-mounted stations along the renowned “K-transect” near Kangerlussuaq in southwestern Greenland since the early 1990s. This image shows a view up the transect in April 2025. Polarimetric radar offers another tool with which to study ice flow here and at other locations on the ice sheets. Credit: Tamara Gerber

The emerging consensus from radar observations and recent progress in fabric modeling is that ice fabric can soften ice stream shear margins by a factor of 10. In other words, the fabric tends to develop in a way that greatly reduces the ice’s effective viscosity at lateral boundaries between fast-flowing and slower-flowing ice, which enables the ice to deform more easily at the margins. The agreement between observations and process-scale modeling highlights fabric as a major, but largely ignored, control on ice flow that may affect estimates of how ice dynamics will contribute to future sea level rise.

Beyond Fabric

Most polarimetric radar studies so far have focused on fabric, but other ice characteristics can cause directional effects too. For instance, bubbles trapped in ice have dramatically different properties than ice itself. Ice deformation can bring bubbles into alignment, such that they affect radar waves differently in different directions.

Likewise, ice at its melting point can contain liquid water along boundaries between crystals, and if those pockets of water are aligned in one direction, they can also affect radar returns. Each of these properties has important influences on ice flow, but their implications are yet to be explored.

Another source of anisotropy is the bottom boundary of the ice sheet. This interface can be rougher in some directions than others, though the roughness is typically aligned with the prevailing ice flow direction or the direction of meltwater trapped within the ice.

Polarimetric radar can measure directionally dependent properties of ice sheet bases at a finer scale than radar profiling can. Such work is leading to new insights into glacier geomorphology, interactions of ice shelf bottoms with the underlying ocean, and how ice slides over substrate surfaces. Rates and extents of sub-ice-shelf melt and basal sliding are widely recognized as key controls on the future of the ice sheets.

Expanding Horizons: Large-Scale and Planetary Applications

Radar polarimetry has already transformed our understanding of ice fabric, revealing much about how crystal alignment modulates the flow of Earth’s ice sheets and filling critical gaps between the handful of direct measurements from ice cores. As polarimetric techniques mature, their applications are expanding.

Researchers are moving from studying isolated profiles of ice fabric to mapping it across whole basins, a key shift for validating bespoke models of fabric and its effects on flow. These models are also rapidly developing to include additional physical processes (e.g., migration recrystallization) and key simplifications (e.g., reducing directionally varying viscosity to a single number) that allow them to interface more easily with—and be incorporated into—large-scale models used for projecting sea level rise.

Techniques pioneered for measuring ice on Earth may also prove useful elsewhere in the solar system.

Techniques pioneered for measuring ice on Earth may also prove useful elsewhere in the solar system. Orbital radar sounders have already probed Mars’s ice masses, and the icy shell of Jupiter’s moon Europa will soon be surveyed by single-polarization radars aboard NASA’s Europa Clipper and the European Space Agency’s Jupiter Icy Moons Explorer (JUICE). These radars might be useful for polarimetry at some locations on Europa, which could reveal past and present motion of ice features and answer fundamental questions about the moon. Whether Europa’s shell flows, for example, may be key to whether its subsurface ocean can harbor life.

As polarimetric radar systems become routine tools for glaciologists and as similar instruments begin operating on spacecraft exploring icy worlds, a technique once limited to a few isolated core sites on Earth could be poised to transform our understanding of ice across the solar system.

Author Information

David Lilien (dlilien@iu.edu), Indiana University Bloomington; T. J. Young, University of St Andrews, Fife, Scotland; Benjamin Hills, Colorado School of Mines, Golden; Tamara Gerber, Université de Lausanne, Lausanne, Switzerland; and Matthew Siegfried, Colorado School of Mines, Golden

Citation: Lilien, D., T. J. Young, B. Hills, T. Gerber, and M. Siegfried (2026), New directions in mapping ice sheet fabrics and flow, Eos, 107, https://doi.org/10.1029/2026EO260154. Published on 14 May 2026.
Text © 2026. The authors. CC BY-NC-ND 3.0
Except where otherwise noted, images are subject to copyright. Any reuse without express permission from the copyright owner is prohibited.
  • ✇on off
  • Flash World Web admin
    Read Current World News at DACT Flash. Update rate 6 hrs. Cron is hourly, may not run sometimes. Press update feeds, blue button on right if needed. Built with FreshRSS is a self-hosted RSS and Atom feed aggregator. It is lightweight, easy to work with, powerful, and customizable.
     

Sensing the Sounds from Earth’s Hazardous Environments

Aerial view of the summit of a volcanic cone as it violently erupts ash and debris.

Thirty years ago, the blockbuster movie Twister featured a group of academics putting themselves at risk by chasing tornadoes in the name of science. Although the Hollywood story entailed a surfeit of sensationalism, special effects, and unrealistic stereotypes, the movie got a few things right. Specifically, the scientists were trying to study tornadoes using a large number of spatially distributed, home-built, low-cost (and potentially sacrificial) sensors.

Today, we commonly refer to the coordinated use of tens to hundreds of similar sensors that are spread out as “large-N” sensing. Such sensor distributions have led to important advances in seismology and infrasound science, where they have improved our understanding of seismic ground motion and helped shed light on volcanic eruption dynamics [e.g., Rosenblatt et al., 2022; Anderson et al., 2023].

The benefits of large-N networks and arrays include robust spatial sampling and signal extraction from noise. They are also advantageous for detecting small signals, sensing natural hazards in remote environments, and offering critical redundancies for sensors at risk from lava or debris flows, wildfire, weather, or even malicious mammals.

Since 2013, our research group in the Department of Geosciences at Boise State University (BSU) has worked to study infrasound from geophysical phenomena by capitalizing on the benefits of low-cost, large-N sensing technology [e.g., Slad and Merchant, 2021]. More than a decade on, this effort has yielded scientific successes from a variety of environments, and it is continuing to evolve.

Large-N Sensing for Infrasound

Many violent natural processes, including landslides, volcanic eruptions, earthquakes, avalanches, and meteors, produce infrasound.

Many violent natural processes, including landslides, volcanic eruptions, earthquakes, avalanches, and meteors, produce infrasound, defined as low-frequency sound below the threshold of human hearing (less than 20 Hertz). Such events may create audible sound as well, but the subaudible band is often much more energetic in terms of sound intensity, and it has long wavelengths that can propagate long distances with little attenuation. These characteristics make infrasound especially valuable for remote sensing of natural phenomena.

Our group at BSU grew more interested in developing our own inexpensive infrasound sensing solutions after costing out technology for commercial data logging systems, the compact electronic devices that record and store sensor data. These systems can be far more expensive than infrasound transducers—the sensors that actually detect sound—themselves.

The cost element became particularly relevant after we lost instrumentation deployed at the summit of Chile’s Villarrica volcano when it erupted a 2-kilometer-tall lava fountain on 3 March 2015 [Johnson et al., 2018]. In an instant, our hardware, including seismic and infrasonic sensors and their commercial multichannel data loggers, was entombed beneath falling lava. This financial loss incentivized our work to develop low-cost loggers that would match the technical specifications and fidelity of commercial systems.

The result was the customized Gem infrasound logger, which we created using the widely available and very economical Arduino open-source electronic prototyping platform and its low–power consumption microcontroller. The Gem is an all-in-one infrasound sensor and data logger with a high dynamic range (millipascals to 100 pascals), a 100-hertz sample rate appropriate for infrasound, and a built-in GPS for precise timing and synchronization [Anderson et al., 2018].

Although we initially conceived of the Gem as an alternative to commercial loggers to be deployed as single stations or in small arrays, we quickly realized its potential for use in high-density distributed sensing arrays that enabled new detection capabilities. In particular, its small package size (it has about the dimensions and weight of a paperback novel) and its ease of deployment—simply insert alkaline batteries, place it on the ground, and turn it on—have opened opportunities for rapid, large-N deployments in difficult-to-access environments.

Early Successes for the Gem

At left is a photo of a tall, snow-capped mountain in the distance, beyond a lake with docked sailboats and green forest. At right is a view looking down into a volcanic crater.
Volcán Villarrica, near Pucon, Chile, is seen in 2025 (left). The volcano regularly releases gas from a small lava lake recessed deep within the summit crater (right). Credit: Jeffrey B. Johnson

The Gem’s inaugural field mission came in January 2020 during a return to Villarrica, where activity had returned to normal following its 2015 paroxysmal eruption [Rosenblatt et al., 2022]. Typical activity in the volcano’s normal state includes open-vent degassing from a small lava lake recessed deep within the summit crater, which produces its famously powerful volcano infrasound [e.g., Johnson et al., 2012].

To capture Villarrica’s infrasound in detail, a four-person team from BSU climbed the 3,000-meter-tall glaciated volcano and quickly installed 16 sensors around the crater rim, as well as another 16 sensors along an 8-kilometer linear transect from the summit down the northern slope (Figure 1). This unique sensor distribution permitted us to capture the infrasound wavefield and how it interacts with topography in unprecedented detail.

Four-panel image showing oblique (top left) and plan (bottom left) views of a volcanic summit region created from structure-from-motion surveys in 2020 and labeled positions of scientific sensors. At top right, a scientist crouches by the edge of a volcanic crater to adjust a cable holding a sensor over the crater. At bottom right, a scientist wearing a helmet and bright yellow safety vest kneels on snow while unloading scientific equipment.
Fig. 1. (a) Oblique and (b) plan views of Villarica’s summit region were created from structure-from-motion surveys in 2020. Red triangles and circles indicate locations of Gem sensing packages. (c) Also in 2020, Jake Anderson adjusts a cable suspended across the volcano’s crater that held a Gem sensor (circled). (d) In 2025, Jerry Mock unloads Gem systems at Villarica’s summit during another data collection campaign there. Click image for larger version. Credit: Jeffrey B. Johnson

Deploying such an array configuration using much heavier, larger, and power-intensive conventional instruments would have taken far more time and resources, as well as a bigger group. With the Gems, however, the installation was feasible for our small team, each member of which could easily carry eight instruments and the batteries needed to power them.

To monitor volcanoes with infrasound, it is necessary to understand the influence of atmospheric effects.

Once in place, these sensors collected continuous data during the 2-week study that were used to quantify the diffraction of sound coming out of the volcanic crater [Rosenblatt et al., 2022] and to measure the sound’s attenuation as it propagated away. Such studies are important for investigating time-varying atmospheric parameters such as changing temperatures and winds, which can affect infrasound transmission, diminishing its amplitude or even—in extreme cases—completely silencing it in an acoustic shadow zone [Johnson et al., 2012]. To monitor volcanoes with infrasound, it is necessary to understand the influence of atmospheric effects.

Months later, another opportunity arose to demonstrate the Gems’ capability for large-N infrasound sensing. During the early days of the COVID-19 pandemic, on 31 March 2020, a magnitude 6.5 earthquake occurred near Stanley, Idaho. The earthquake, the largest in the state since 1983, kicked off an energetic aftershock sequence, with more than 700 magnitude 3 or greater earthquakes occurring in 6 months. Most of these events produced significant local infrasound radiation, or “airquakes,” caused by ground-atmosphere coupling [e.g., Johnson et al., 2020].

Pandemic-related precautions inhibited a large team from venturing as a group into the field. However, a lone BSU researcher (coauthor Jacob Anderson), trudging through forest terrain and deep snow on skis, was able to deploy and activate 22 Gems in less than 4 hours in early April, thanks in part to the sensors’ compact size and ease of deployment.

This array captured hundreds of local infrasonic aftershocks within about 25 kilometers of their epicenters. It also recorded a far larger event 700 kilometers away, the 15 May magnitude 6.5 Monte Cristo earthquake in Nevada. The array detected the epicentral infrasound from the distant earthquake source, as well as infrasound from numerous secondary sources, including mountain ranges throughout the western United States that reradiated the ground motion as infrasound (Figure 2) [Anderson et al., 2023].

A map of much of the western United States indicates source regions of infrasound associated with an earthquake in Nevada that was detected by sensors in Idaho.
Fig. 2. This map shows source region(s) of infrasound associated with the May 2020 Monte Cristo earthquake in Nevada that was detected by an array of Gem infrasound sensors deployed at the PARK site near Stanley, Idaho. Click image for larger version. Credit: Adapted from Anderson et al. [2023], CC BY 4.0

Detecting all these distinct signals was possible because of the enhanced array processing capabilities provided by the large number of sensors. Anderson et al. [2023] showed that when the data were processed from 3-sensor subsets of the 20+-sensor array—instead of from the whole array—it was possible to detect only the most intense earthquake infrasound arrivals. In other words, the larger array had much greater fidelity and sensing capabilities than smaller distributions of sensors.

During its 2-month deployment, the Stanley array also detected sounds from other distant nonearthquake sources, including waterfalls 195 kilometers away and thunder more than 900 kilometers away [Scamfer and Anderson, 2023]. Such enhanced detections, facilitated by large-N sensing, demonstrate an improved capacity to monitor a range of Earth phenomena continuously over a wide range of distances.

Putting Sensors in Harm’s Way

Since those proof-of-concept deployments, Gems have been used to monitor snow avalanches, lahars, river flow discharge, stratospheric sounds (while mounted aboard a solar balloon), and numerous volcanoes during field experiments [e.g., Tatum et al., 2023; Bosa et al., 2024; Rosenblatt et al., 2022; Brissaud et al., 2021]. Given their ease of use, small size, and low replacement cost, they’ve also been tested in hazardous environments where the risk to more expensive hardware could be considered unreasonable.

The motivation to put sensors in harm’s way is to gain insight into geophysical phenomena by recording subtle signals close to the source that may not be detectable from farther away.

The motivation to put sensors in harm’s way is to gain insight into geophysical phenomena by recording subtle signals close to the source that may not be detectable from farther away. For example, at Villarrica, Rosenblatt et al. [2022] suspended a Gem on a cable 100 meters above a lava lake to collect infrasound data from a unique, bird’s-eye perspective over the crater (Figure 1c). (Stringing the cable across the crater proved far more challenging than deploying the sensor itself, which slid down the cable until finding its resting place at the bottom of the cable’s arc.)

In another case, we landed a pair of Gems on the ground near a frequently exploding crater at Fuego volcano in Guatemala using a drone (see video below). We later retrieved one of the sensors from high on the volcano’s flanks. Another was lost because high winds initially posed too great a risk to fly the drone back for it. Then the following day after the wind subsided, we could not locate the stranded Gem, which was probably a casualty of a nighttime explosion.

Drone footage and infrasound recordings were collected during an explosion of Fuego volcano on 4 February 2024. Pa = pascals. Credit: video: Jerry C. Mock; animation and infrasound: Jeffrey B. Johnson

Our group at BSU also has nascent interest in using Gems to study fire in natural environments. Wildfires produce infrasound from a spatially extensive source region corresponding to actively burning areas. Because of the source complexity and the fact that fire infrasound is low amplitude and tremor-like [Johnson et al., 2025], enhancing signal-to-noise ratios in recorded infrasound is critical. This enhancement is enabled by using large-N monitoring networks, making infrasound wildfire surveillance a promising area of investigation.

Low-cost, rapid infrasound deployments could one day be used as an effective operational tool.

Toward this objective, our group installed 76 sensors ahead of a prescribed burn in Reynolds Creek, Idaho, in October 2023 to begin developing infrasound as a tool for monitoring and mapping wildfire. We have also deployed Gems for infrasound studies of naturally occurring wildfires, such as the Emigrant wildfire in Oregon in August and September 2025 (Figure 3). During that active wildfire response, a team safely and quickly installed tens of sensors within a matter of hours in an area facing dynamic hazards from the rapidly expanding fire, which eventually covered 33,000 acres (about 13,354 hectares). Luckily, no instruments were lost, and the data have shown the potential to track a wildfire as it advances.

Preliminary results suggest that low-cost, rapid infrasound deployments could one day be used as an effective operational tool. For example, in firefighting responses, infrasound might complement intermittent aerial observations, from aircraft or drones, because it provides a continuous record of fire activity. Infrasound surveillance might also be able to “hear” combustion sources within a burn area that is obscured to optical sensing because of clouds or nightfall.

Three-panel figure, with a topographic map at left representing the spread and severity of a large wildfire on a color scale from green (unburned) to purple (highly burned). The locations and layouts of three infrasound sensing array are also shown, as is a map legend. At top right is a view of wildfire smoke rising in the distance from forested hillsides. At bottom right is a view of burned hillside with a small sensor melted by the first circled in red.
Fig. 3. (a) The spread and severity of the 2025 Emigrant Fire in Oregon, as calculated from prefire (21 August) and postfire (18 October) Sentinel-2 satellite images, are shown. Inset maps show the distribution of 37 Gem sensors rapidly deployed in three arrays. (b) Smoke from the fire rises from the landscape on 31 August during deployment of the sensors. (c) Following the fire, one sensor that had been melted by the fire was recovered with its data card still intact (red circle). dNBR = differenced normalized burn ratio. Click image for larger version. Credit: (a) and (b): Madeline A. Hunt; (c): Jacob F. Anderson

The Evolution of Low-Cost Sensors

Five years ago, the single-sensor Gem was a cutting-edge infrasound logging solution. While it remains a powerful and economical tool for large-N arrays and for sensing in hostile environments, it is evolving.

Four people lean against a white sport utility vehicle in a snowy field, with forest, mountains, and a cloud-streaked blue sky behind them.
Boise State University researchers (left to right) Madeline Hunt, Owen Walsh, Jerry Mock, and Jacob Anderson prepare to deploy Gem sensors in Idaho’s Sawtooth Mountains in January 2024. Credit: Jeffrey B. Johnson

We have now developed the Gem into an even more versatile version called the Aspen, which can log four independent sensors at a sample rate of 200 hertz, double that of the Gem. The Aspen retains the small size, low weight, low power consumption, and low cost of the Gem, but with the capability to record higher-resolution 24-bit, time-synchronized data from a triaxial seismic sensor and an infrasound transducer.

Recording synchronous seismoinfrasonic data on the same logging platform offers the advantage of sensing both ground shaking and infrasonic oscillations. The ability to measure waves propagating in the ground and in the air simultaneously could facilitate work in the growing field of environmental seismology, which focuses on geophysical sources at Earth’s surface like debris flows and volcanoes.

Although we have focused on seismoacoustic geophysical measurements in our work, the concept of gathering data with low-cost instrumentation in harm’s way or from coordinated arrays of numerous sensors holds promise across Earth and environmental sciences. Such approaches could be used, for example, with tiltmeters (which measure slope changes), gravity meters, or near-infrared thermometers (e.g., optical pyrometers), all of which would offer additional data streams complementing seismoacoustic observations in geophysical studies of volcanoes.

With the diversity of emerging uses, it’s clear that large-N sensing—infeasible or cost prohibitive in many cases until recently—could transform how we measure many facets of Earth, helping to reveal the inner workings of volatile volcanoes, twisting tornadoes, and more.

Acknowledgments

More information about low-cost infrasound sensing solutions can be found at https://sites.google.com/boisestate.edu/infravolc/home. Development of the Gem infrasound logging platform was supported by a grant from the National Science Foundation (EAR-2122188).

References

Anderson, J. F., et al. (2018), The Gem infrasound logger and custom‐built instrumentation, Seismol. Res. Lett., 89(1), 153–164, https://doi.org/10.1785/0220170067.

Anderson, J. F., et al. (2023), Remotely imaging seismic ground shaking via large-N infrasound beamforming, Commun. Earth Environ., 4(1), 399, https://doi.org/10.1038/s43247-023-01058-z.

Bosa, A. R., et al. (2024), Dynamics of rain-triggered lahars and destructive power inferred from seismo-acoustic arrays and time-lapse camera correlation at Volcán de Fuego, Guatemala, Nat. Hazards, 121, 3,431–3,472, https://doi.org/10.1007/s11069-024-06926-1.

Brissaud, Q., et al. (2021), The first detection of an earthquake from a balloon using its acoustic signature, Geophys. Res. Lett., 48, e2021GL093013, https://doi.org/10.1029/2021GL093013.

Johnson, J. B., et al. (2012), Probing local wind and temperature structure using infrasound from Volcan Villarrica (Chile), J. Geophys. Res., 117, D17107, https://doi.org/10.1029/2012JD017694.

Johnson, J. B., et al. (2018), Forecasting the eruption of an open-vent volcano using resonant infrasound tones, Geophys. Res. Lett., 45, 2,213–2,220, https://doi.org/10.1002/2017GL076506.

Johnson, J. B., et al. (2020), Mapping the sources of proximal earthquake infrasound, Geophys. Res. Lett., 47, e2020GL091421 , https://doi.org/10.1029/2020GL091421.

Johnson, J. B., J. F. Anderson, and K. Yedinak (2025), Infrasound produced by a small pile fire, Appl. Acoust., 231, 110559, https://doi.org/10.1016/j.apacoust.2025.110559.

Rosenblatt, B. B., et al. (2022), Controls on the frequency content of near-source infrasound at open-vent volcanoes: A case study from Volcán Villarrica, Chile, Bull. Volcanol., 84(12), 103, https://doi.org/10.1007/s00445-022-01607-y.

Scamfer, L. T., and J. F. Anderson (2023), Exploring background noise with a large‐N infrasound array: Waterfalls, thunderstorms, and earthquakes, Geophys. Res. Lett., 50, e2023GL104635, https://doi.org/10.1029/2023GL104635.

Slad, G., and B. Merchant (2021), Evaluation of Low Cost Infrasound Sensor Packages, Sandia Rep. SAND2021-13632, Sandia Natl. Lab., Albuquerque, N.M., https://doi.org/10.2172/1829264.

Tatum, T., J. F. Anderson, and T. J. Ronan (2023), Whitewater sound dependence on discharge and wave configuration at an adjustable wave feature, Water Resour. Res., 59, e2023WR034554, https://doi.org/10.1029/2023WR034554.

Author Information

Jeffrey B. Johnson (jeffreybjohnson@boisestate.edu), Jacob F. Anderson, Madeline A. Hunt, Owen A. Walsh, and Jerry C. Mock, Department of Geosciences, Boise State University, Idaho

Citation: Johnson, J. B., J. F. Anderson, M. A. Hunt, O. A. Walsh, and J. C. Mock (2026), Sensing the sounds from Earth’s hazardous environments, Eos, 107, https://doi.org/10.1029/2026EO260142. Published on 8 May 2026.
Text © 2026. The authors. CC BY-NC-ND 3.0
Except where otherwise noted, images are subject to copyright. Any reuse without express permission from the copyright owner is prohibited.
❌
Subscriptions