SYDNEY, May 20 — An Australian animal welfare group is seeking a heroic dog with an appetite for adventure for a full-time position as a koala rescuer.The successful pooch will replace the world-famous Bear, credited with saving over 100 koalas from bushfires during a decade of service.“Bear set the gold standard for koala detection dogs,” the International Fund for Animal Welfare (IFAW) Oceania head of programmes Josey Sharrad said.“He’s leaving very big boots t
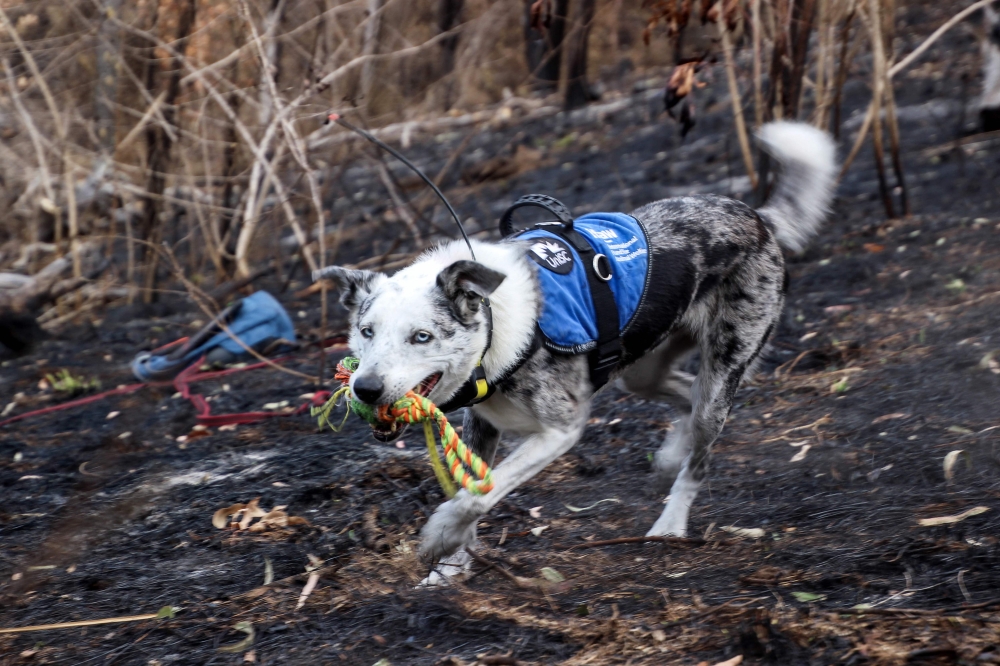
SYDNEY, May 20 — An Australian animal welfare group is seeking a heroic dog with an appetite for adventure for a full-time position as a koala rescuer.
The successful pooch will replace the world-famous Bear, credited with saving over 100 koalas from bushfires during a decade of service.
“Bear set the gold standard for koala detection dogs,” the International Fund for Animal Welfare (IFAW) Oceania head of programmes Josey Sharrad said.
“He’s leaving very big boots to fill, but now it’s time to find his successor to follow in his pawprints and keep protecting koalas.”
The ideal candidate will be a rescue pup with a lot of energy and an “obsessive” personality — attributes that might make it hard to find a home but which make it perfect for saving koalas, IFAW said.
“By only recruiting a rescue dog, it’s a win-win — giving a dog the chance of a new life while helping our iconic koalas,” Innovation for Conservation director and handler Russell Miller said.
Other key attributes are a love of play, confidence and a gentle temperament towards fellow animals is crucial.
They must also be medium sized — “not too small that they struggle in the bush, not too big that the handlers can’t carry them when needed”, according to the IFAW job ad.
Interviews were being held in eastern Australia’s Sunshine Coast but applications by video are also welcome.
Bear’s skills saved over 100 koalas as the Black Summer bushfires raged across Australia’s eastern seaboard from late 2019 to early 2020, razing millions of hectares, destroying thousands of homes and blanketing cities in noxious smoke.
The tail-wagging detective with a “joyful and goofy” personality retired with an extensive list of accolades — including an Animal of the Year award and Puppy Tales Photos Australian Dog of the Year award. — AFP
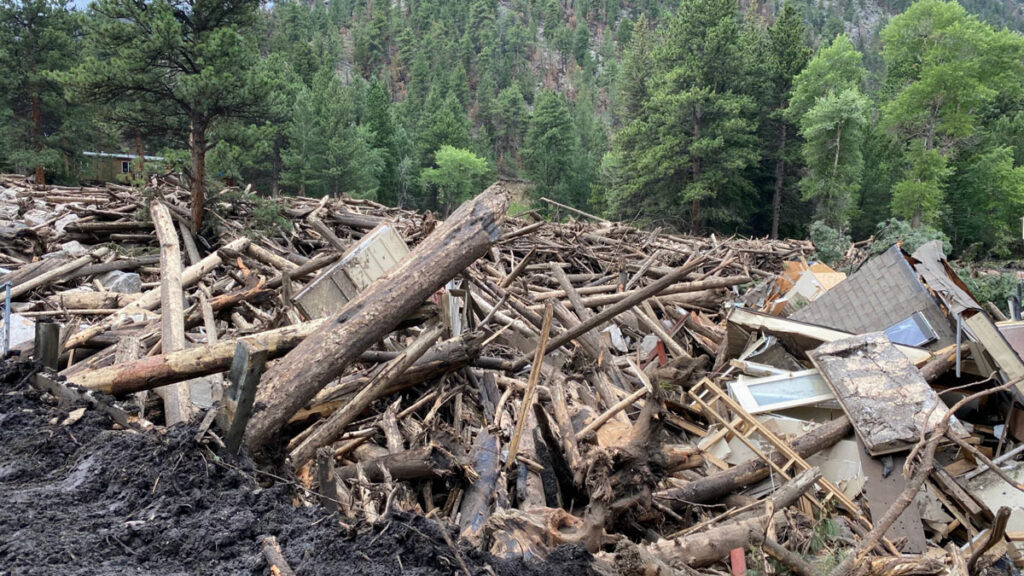
Months after wildfires eliminate vegetation that holds hillside sediment together, debris flows—destructive landslides that carry bulky material down once-stable slopes—can devastate infrastructure, taking out roads and buildings in their wake.
Though the U.S. Geological Survey (USGS) creates hazard predictions used to warn communities of the risk of these postfire debris flows, those predictions haven’t fully considered how recovering vegetation reduces risk over time—until now.
A new study published in Geosphere presents a new way to calculate postfire debris flow risk that takes vegetation recovery into account. The USGS will begin using the new method this wildfire season to create more accurate maps of debris flow hazard in the years after a fire.
“I’m so appreciative that the focus on how the debris flow hazard changes over time after fire is being addressed,” said Nancy Calhoun, a geologist and postwildfire debris flow program manager at the Washington Geological Survey who was not involved in the new study. Calhoun said she relies on the USGS hazard assessments for virtually everything her job requires.
“We’re glad to have a way that we can help our partners moderate those situations where the hazard has decreased,” said Andrew Graber, a geologist at the USGS Landslide Hazards Program and lead author of the new study.
Assessing Hazard, Again
After a wildfire, the USGS creates hazard maps that incorporate information about soil type, steepness, and burn severity (how much vegetation has been lost) to show where the risk of a debris flow may be elevated.
Then, the agency distributes this guidance to the National Weather Service, which uses it to set rainfall thresholds: levels of rainfall at which a debris flow becomes likely. State, county, and city agencies use those rainfall thresholds to issue warnings or take action when rainfall is imminent, for example, by closing highways or triggering evacuations.
“That left us with some uncertainty when we started to get further away in time from the fire.”
The methods used to create the USGS maps, however, historically relied on a snapshot of the burned area taken just after the fire, and the maps weren’t updated to reflect conditions as vegetation grew back and began holding soil in place again.
That led to situations where public safety decisions were made on the basis of outdated maps and rainfall thresholds. For example, concern over debris flows after the 2020 Grizzly Creek Fire in Colorado led to several closures of Interstate 70 in 2022, but the debris flows never happened.
“What [the original assessments] didn’t capture is how the vegetation came back,” Graber said. “That left us with some uncertainty when we started to get further away in time from the fire.”
Intense rainfall in July 2025 triggered a debris flow near Dayton, Wyo., in the 2024 Elk Fire burn area. Credit: USGS, Public Domain
To test an improved method for these hazard assessments, Graber and the research team incorporated satellite imagery of 12 burned areas that showed the degree of vegetation recovery right after the fire, 1 year after the fire, and 2 years after the fire. Then, they tested their new method by comparing its predictions to rainfall and debris flow data from the 12 burned areas.
The updated method better reflected what had actually happened after the fires, reducing the number of unnecessary warnings without missing real-world debris flows.
Risk Recalibration
The USGS plans to begin using their new workflow to create hazard maps for some higher-profile fires during the coming wildfire season.
“It’s a really important question: Are we still worried about this burn scar?”
That’s exciting for Calhoun. As part of her job, she’s in constant contact with emergency managers who periodically ask how worried they should be about debris flows in areas that burned years ago. “It’s a really important question: Are we still worried about this burn scar?” she said.
Right now, Calhoun has no data to point to in the years after a fire to give an updated answer to that question. Using the new method from Graber and the research team, she will.
“Because they’re using satellite [imagery] and repeatable quantitative methods to look at these burn scars over time, we’ll actually be able to say something useful and informed about vegetation recovery,” she said.
Having a deeper understanding of how debris flow risk evolves over time is especially important because debris flows themselves are becoming a greater risk to the public as a result of increasingly intense wildfires and rainstorms. In addition, more accurate assessments can reduce warning fatigue, which occurs when too many false alarms lead to people ignoring or opting out of alerts.
Graber hopes he and the USGS will continue to improve their methods for assessing debris flow hazards by collecting more debris flow data across the country and improving the underlying equation for hazard assessments so that it better reflects the unique conditions of different ecosystems in the United States. USGS researchers also published a new study in March presenting a method to generate maps of where debris flows might travel if they do occur.
“It’s a big year for USGS’s useful postfire products,” Calhoun said.
This news article is included in our ENGAGE resource for educators seeking science news for their classroom lessons. Browse all ENGAGE articles, and share with your fellow educators how you integrated the article into an activity in the comments section below.
Citation: van Deelen, G. (2026), A new approach can better predict debris flow hazards years after fires, Eos, 107, https://doi.org/10.1029/2026EO260160. Published on 19 May 2026.
Source: AGU Advances
Across the western United States, wildfires are increasing in size and intensity. As the climate continues to warm, more extreme wildfires will reshape landscapes and pose a growing risk to human health and natural ecosystems throughout the West.
Climate models, used to predict other effects of climate change, are unable to directly simulate wildfires. Instead, researchers link previously burned areas to climate variables such as temperature, precipitation, drought, a
Across the western United States, wildfires are increasing in size and intensity. As the climate continues to warm, more extreme wildfires will reshape landscapes and pose a growing risk to human health and natural ecosystems throughout the West.
Climate models, used to predict other effects of climate change, are unable to directly simulate wildfires. Instead, researchers link previously burned areas to climate variables such as temperature, precipitation, drought, and evaporation, then apply those relationships to future climate projections.
Many recent studies have connected higher vapor pressure deficit (VPD)—a measure of atmospheric dryness—to more area burned in previous fires. VPD increases as the temperature rises, so models that rely on it generally predict an increase in wildfire activity as the climate warms.
Cheng et al. raise questions about the role VPD plays in modeling wildfire, suggesting that VPD is a poor measure of fuel dryness at larger scales and overestimates potential burned areas under significant warming conditions. Instead, researchers suggest soil moisture could be a more reliable indicator of fuel dryness and lead to more moderate projections of wildfire increases.
The researchers looked at five forested ecoregions in the western states. Using the Western US MTBS-Interagency wildfire dataset from 1984 to 2020 combined with climate data (temperature, VPD, and soil moisture), the researchers analyzed drivers of the area burned from May through October. They connected this information with output from climate models to look at future burn potential.
VPD-based wildfire predictions increase sharply under warming conditions. These predictions showed that under 3°C of average global warming, 16 times as much land would burn by the end of the century, compared to historical levels. Under 4°C of warming, up to 66 times more land would burn by the end of the century. This “truly massive” increase, the authors say, would mean fires consuming vegetation almost as soon as it regrows.
Soil moisture, on the other hand, provides a more moderate, though still concerning, picture. Under the same warming scenarios, soil moisture changes would lead to an increase in burned area of only 2–3 times that of the historical period. The researchers argue that projections relying on VPD severely exaggerate wildfire risk. (AGU Advances, https://doi.org/10.1029/2026AV002350, 2026)
Citation: Owen, R. (2026), How much will western wildfires worsen under warming?, Eos, 107, https://doi.org/10.1029/2026EO260147. Published on 15 May 2026.
chris murkin posted a photo:
G-ASJV RAF Supermarine Spitfire MkIXB MH434 ZD-B in the markings of 222 Squadron
The most famous of all Spitfires still flying today, MH434 was built in 1943 at Vickers, Castle Bromwich. This Spitfire is remarkably original, having never been subject to a re-build
Photo taken at Duxford 9th May 2026 Flying Day Show (DE Day)
HAA_1047
California is no stranger to the hot, dry summer weather that makes wildfires more likely. But wildfire season in the state is now stretching into the heart of winter, when it has historically been protected by cool, wet weather. In January 2025, Southern California experienced some of the deadliest and costliest wildfires in the state’s history.
Now, a new study published in Nature Communications shows that the climatic changes that increase the risk of these winter wildfires could be drive
California is no stranger to the hot, dry summer weather that makes wildfires more likely. But wildfire season in the state is now stretching into the heart of winter, when it has historically been protected by cool, wet weather. In January 2025, Southern California experienced some of the deadliest and costliest wildfires in the state’s history.
Now, a new study published in Nature Communications shows that the climatic changes that increase the risk of these winter wildfires could be driven by low autumn snow levels thousands of miles away, in western Eurasia. The authors said that tracking snowfall in Eurasia could help forecast winters in California that will have higher chances of wildfires.
The researchers were motivated by the catastrophic 2025 wildfires to search for climate drivers of winter wildfire conditions in California. First, they looked for correlations between winter wildfires and ocean temperatures, especially La Niña events that are associated with drier-than-average conditions in California. They also examined variability in sea ice, which can affect global weather patterns. But they saw only weak connections.
Compared to oceans and sea ice, the influence of snow cover on global weather patterns is less studied, said Shineng Hu, a climate scientist at Duke University and lead author of the paper. But another climate researcher in Hu’s lab, Shizuo Liu (first author of the study), had previously studied the connection between snow cover and weather patterns and suggested the team look for connections between snow and fires. That’s when they found significant correlations between the winter wildfires in California and low snow cover in western Eurasia.
“When I saw the result, I was suspicious,” Hu said, “because we all know that correlation doesn’t mean causality.” But they ran hundreds of climate model simulations reducing snow cover in Eurasia and saw an increased probability of winter fires in California. “At that point, we were pretty much convinced that there could be something interesting happening over there,” Hu said.
Propagating Pressure
“I’m glad to see this group saying snow can do something similar to what ocean temperature anomalies can do.”
The scientists determined that this intercontinental link starts because the land absorbs more energy when snow cover is low, disturbing the atmosphere above it. This disturbance, like a stone thrown into water, generates large waves of air called Rossby waves that travel eastward along the jet stream across the Pacific Ocean. The Rossby waves drive the formation of a high-pressure zone that creates the hot, dry, windy conditions conducive to wildfires.
“I’m glad to see this group saying snow can do something similar to what ocean temperature anomalies can do,” said Judah Cohen, a climatologist at the Massachusetts Institute of Technology who was not involved in the study but has also studied the links between snow in North America and Eurasia. “I’ve been surprised by how important this mechanism is for U.S. weather in the winter and how little there is about it in the literature.”
“This is just one missing gap that people didn’t even realize. We want to add that to the table.”
But Cohen suggested the study tells only part of the story. In North America, dry winters in the west are paired with wet, cold winters in the east. The same is true in Eurasia, and according to Cohen’s past research, when snow levels are low in western Eurasia but high in eastern Eurasia, a temperature and pressure gradient is created across the continent. The energy released as the atmosphere works to equalize that pressure drives the Rossby waves. Cohen said the disparity between snow levels in eastern and western Eurasia would likely strengthen the Rossby waves and then the warming in California. “If all of Eurasia [had] below normal [snow levels], I don’t think you could easily excite this wave energy that propagates across the hemisphere.” He also stressed that Rossby waves don’t just travel eastward. They also travel upward into the stratosphere, where they bounce back down over North America and intensify the high pressure over the western United States.
Both Cohen and the study authors insisted that many other factors influence whether wildfires ignite in winter. “This is just one missing gap that people didn’t even realize. We want to add that to the table,” said Hu. But monitoring snow levels in Eurasia could offer signs of bad wildfire winters to come. The January 2025 Southern California fires were preceded by low snow levels in November and December in Eurasia, Hu said. “So there’s a 1‑month lag, which gives us some hope that we can use that for prediction.”
Citation: Chapman, A. (2026), Low snow in Eurasia linked to wildfires in California, Eos, 107, https://doi.org/10.1029/2026EO260138. Published on 13 May 2026.
As the climate warms, tree lines are generally understood to move up, because regions that were previously too cold for trees to survive now have higher, more tree friendly temperatures.
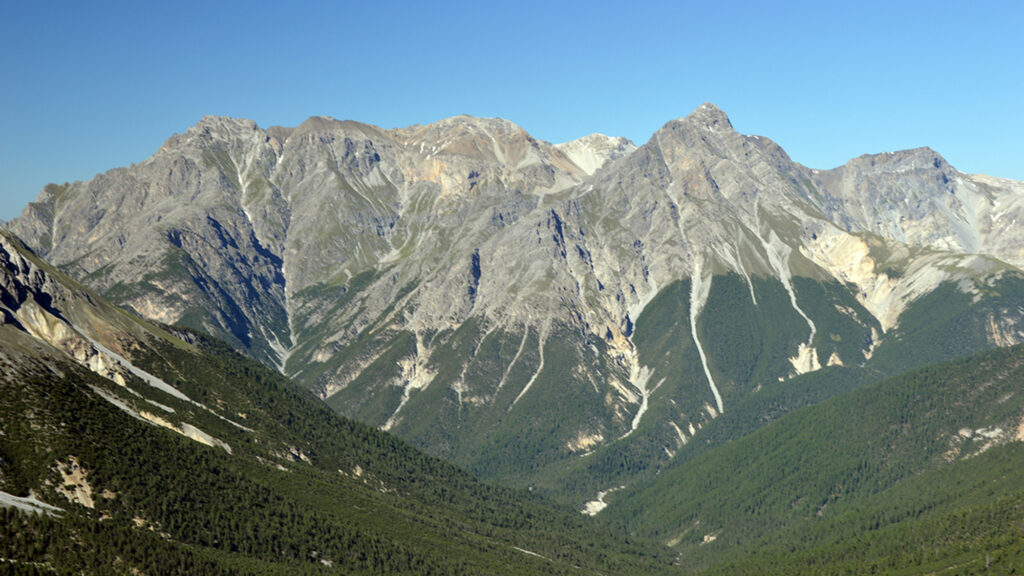
A tree line is clearly visible in the Swiss National Park, in Graubünden, Switzerland. Credit: Sabine Rumpf, University of Basel
This migration can be seen in these images of Canada’s Waterton Lakes National Park…
Rising tree lines are visible in Canada’s Waterton Lakes National Park,
As the climate warms, tree lines are generally understood to move up, because regions that were previously too cold for trees to survive now have higher, more tree friendly temperatures.
A tree line is clearly visible in the Swiss National Park, in Graubünden, Switzerland. Credit: Sabine Rumpf, University of Basel
This migration can be seen in these images of Canada’s Waterton Lakes National Park…
Rising tree lines are visible in Canada’s Waterton Lakes National Park, seen here in 1913 (left) and 2007 (right). Credit: Mountain Legacy Project
…and of Jackson Glacier in Montana’s Glacier National Park, for example.
Jackson Glacier, in Montana’s Glacier National Park, is seen here in 1912 and 2009. As the climate has warmed, the glacier has receded significantly, and tree lines have risen. Credit: MJ Elrod, U of M Library–9/3/2009, L McKeon, USGS
But new research, published in the International Journal of Applied Earth Observation and Geoinformation, paints a more complicated picture: Between 2000 and 2020, 42% of tree lines shifted up, true. But 25% of them actually moved downhill.
Sabine Rumpf, an ecologist at the University of Basel in Switzerland, said many studies of tree line shifts tend to be concentrated in limited geographic areas. A preponderance are based primarily on data from North America, Europe, and the Himalayas, where researchers are more likely to have funding to head to the field to take measurements themselves.
“But that also means that a large proportion of the surface of our planet is so understudied,” Rumpf said. “And [to remedy] that, remote sensing data [are] really amazing because you can get a truly global picture, even though there’s nobody, or too few people, observing things in the field.”
Tree Lines Aren’t Living up to Their Potential
So the team set out to take a more global look. They used a world mountain map, developed in 2018, with a 250-meter resolution. They did exclude some regions from their analysis: cells with less than 10% high-mountain coverage (which have so few trees that they don’t have much of a tree line) and cells more than 95% covered with trees (which have so many trees that they don’t have much of a tree line). For their purposes, the team defined the “observed tree line” as the upper limit of trees that stand 3 meters or taller.
Then, said Rumpf, they used a model to calculate the potential tree lines for each area, because, thanks to human effects on the environment, “where these trees could be surviving is almost always higher than where the trees are currently.” The model looked at the growing season length and mean growing season temperature for each cell in the map’s grid. The researchers determined that if a cell had a growing season length of 94 days or longer, and an average growing season temperature of 6.4°C or higher, it could potentially host trees. Cells that didn’t meet both criteria were considered unable to be covered in forest, and thus above the potential tree line.
With this model, “you can calculate based on climatic data where trees could potentially occur or not occur, even though they might not be there in the field,” Rumpf said. “It’s actually super simple. And that’s the beauty of it.”
Credit: Sabine Rumpf, University of Basel
Jordon Tourville, a terrestrial ecologist with the Appalachian Mountain Club, said the overall findings are not surprising, because other studies have shown seemingly “paradoxical downslope shifts in some cases.” But he noted that whereas this study estimated potential tree lines based on temperature constraints, some scientists have suggested that factors such as nutrient availability and wind exposure are also important in determining tree line position.
Unsurprising, on Second Thought
In areas with more human disturbance, the upward spread of trees is suppressed, or even reversed.
Armed with this information about observed versus potential tree lines, the researchers hypothesized that areas with the smallest deviation between the two were mostly responding to climatic factors. In contrast, they speculated, areas with a greater difference between observed and potential tree lines were likely experiencing more anthropogenic disturbance, such as logging, agriculture, and infrastructure development.
Their hypothesis held up. In areas with less human disturbance, tree lines were moving upward more quickly (the researchers noted, though, that the upward migration of tree lines lagged behind the rate of climate change). In areas with more human disturbance, the upward spread of trees is suppressed, or even reversed.
Fire played a big role in tree line shifts as well: The researchers found that 38% of the downslope shifts were linked to fire events. Wildfires played a particularly big role in western North America and Alaska.
Wildfires played a particularly large role in the downward shift of tree lines in western North America. Here, a tree line is visible in California’s Little Lakes Valley. Credit: mlhradio/Flickr, CC BY-NC 2.0
Rumpf and several of her colleagues are located in the Alps, where glaciers are retreating, tree lines are climbing, and towns are generally more threatened by mudslides than by wildfires.
Some of the study’s findings, like a quarter of tree lines shifting down, or such a clear signal from wildfires in some areas, were at first unexpected. But after some reflection, Rumpf realized the diversity of data was a perfect example of why global-scale research is important.
“A lot of scientific funding is based in North America and Europe,” Rumpf said, which means many studies return similar results. “Then we do something global and we are surprised that things are different somewhere else on the globe?… I mean, well, duh.”
This news article is included in our ENGAGE resource for educators seeking science news for their classroom lessons. Browse all ENGAGE articles, and share with your fellow educators how you integrated the article into an activity in the comments section below.
Citation: Gardner, E. (2026), Tree lines are migrating. Some up, some down., Eos, 107, https://doi.org/10.1029/2026EO260146. Published on 12 May 2026.
Research & Developments is a blog for brief updates that provide context for the flurry of news that impacts science and scientists today.
As the midpoint of the year approaches, several climate records have already been broken. Arctic winter sea ice extent reached a record low. Several countries saw record-breaking winter heat waves. And more than 150 million hectares have already burned globally in wildfires.
The increasingly likely emergence of an El Niño this summer will like
Research & Developments is a blog for brief updates that provide context for the flurry of news that impacts science and scientists today.
As the midpoint of the year approaches, several climate records have already been broken. Arctic winter sea ice extent reached a record low. Several countries saw record-breaking winter heat waves. And more than 150 million hectares have already burned globally in wildfires.
The increasingly likely emergence of an El Niño this summer will likely continue the year’s record-breaking weather trends and could lead to “an unprecedented year of global fire,” according to a statement from World Weather Attribution, a climate research collaboration.
“In modern human history, we’ve never experienced a strong or very strong El Niño event amid pre-existing conditions that were this warm globally.”
NOAA’s Climate Prediction Center predicts there is a 61% chance of El Niño—a natural climate pattern that involves warming waters in the Pacific Ocean—emerging by July 2026 and persisting through the end of the year. El Niño typically temporarily boosts global temperatures.
At a press briefing on 11 May hosted by World Weather Attribution, climate scientists outlined the potential risks of this emerging El Niño against the backdrop of human-caused climate change, including intensifying wildfire seasons, extreme heat waves, and worsening droughts.
In the press briefing, Frederike Otto, a climate scientist at World Weather Attribution and Imperial College London, emphasized that climate change will likely play a larger role in the rest of this year’s extreme weather events than El Niño will, pointing to more than 100 analyses done by World Weather Attribution that have controlled for the effects of the El Niño Southern Oscillation (ENSO), the broader climate phenomenon that produces El Niño and its sister condition, La Niña.
“We find that human-induced climate change has a much greater influence on the likelihood and intensity of extreme weather events than ENSO,” she said.
Still, El Niño could push average global temperatures to extremes. The effects of El Niño will “be amplified considerably by the now nearly 1.5°C [(2.7°F)] of global warming experienced as of 2026,” Daniel Swain, a climate scientist at the University of California, Los Angeles and the California Institute for Water Resources, said in a statement. “In modern human history, we’ve never experienced a strong or very strong El Niño event amid pre-existing conditions that were this warm globally.”
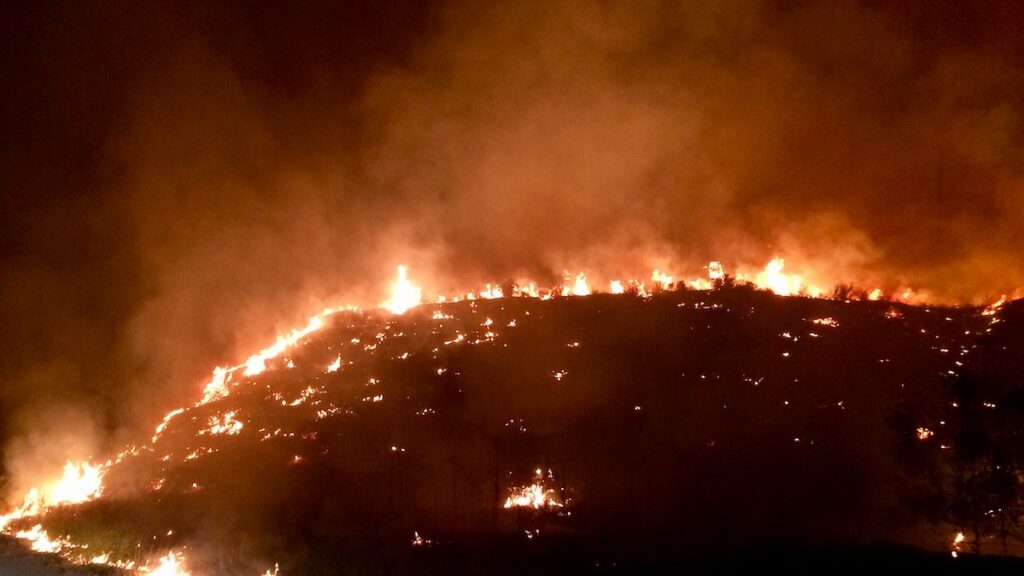
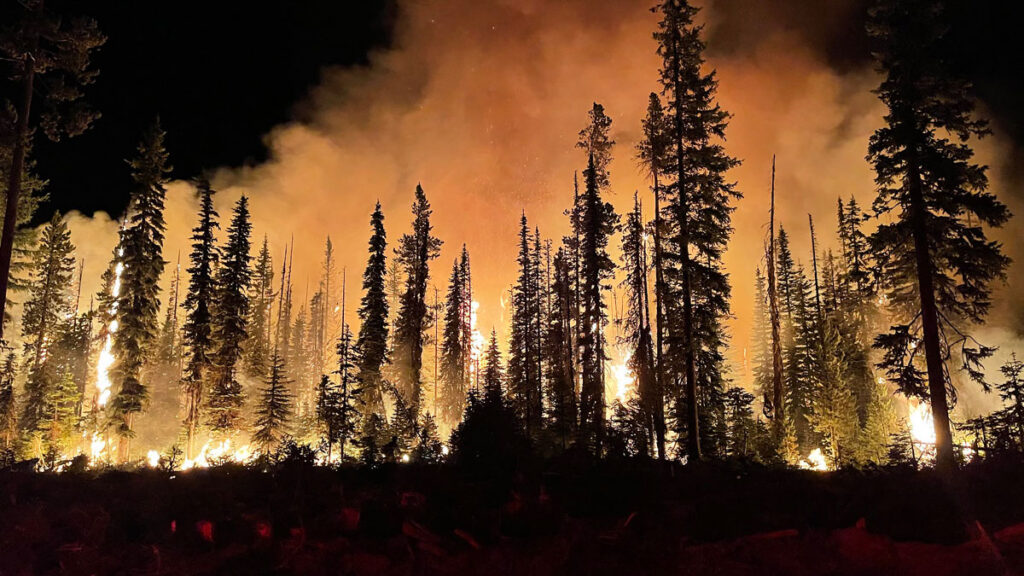
The global fire season has “got off to a very fast start,” particularly in the African savanna, Southeast Asia, and northeastern China, Theodore Keeping, who studies extreme weather and wildfires at Imperial College London and World Weather Attribution, said in the briefing. Though El Niño may have mixed effects on the U.S. wildfire season, much of the U.S. is expected to face elevated wildfire risk, and a strong El Niño could worsen wildfires elsewhere in the world, particularly in the Amazon rainforest and Australia, Keeping said.
More than 150 million hectares have burned in wildfires so far this year. Credit: Our World in Data, CC BY
“This rapid start [to the wildfire season], in combination with the forecast El Niño, means that we’re looking at a particularly severe year materializing,” Keeping said. “The likelihood of harmful, extreme fires potentially could be the highest we’ve seen in recent history.”
These updates are made possible through information from the scientific community. Do you have a story about science or scientists? Send us a tip at eos@agu.org.
Want your wildfire updates to come from a trusted source? Preference Eos in your searches!
Go to Google
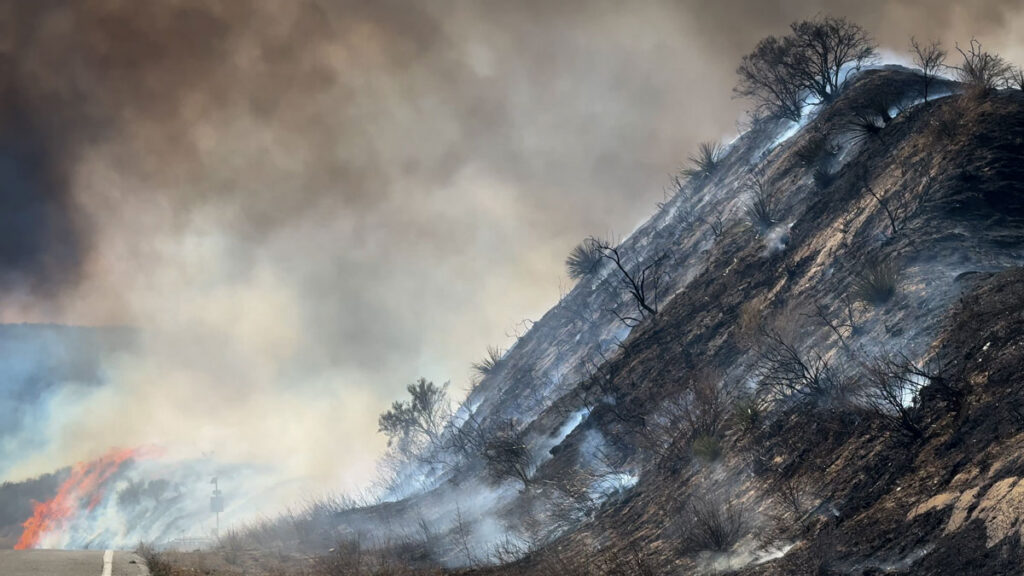
A warm, dry spring has set the stage for above-average significant wildland fire risk across much of the southern and western United States this summer, and no part of the United States will have below-average fire potential through the end of August.
“It’s not necessarily a foregone conclusion that we’re going to have a really busy season, but everything is pointing that way.”
These predictions are part of a 4-month outlook produced monthly by the National Interagency Fire Center (NIFC), a group of wildland fire experts from eight federal agencies that coordinates wildland fire resources across the country.
The most recent outlook, published 1 May, projects the likelihood of significant fires (defined as those that require an NIFC response) from May to August using long-term forecasts from NOAA’s Climate Prediction Center, current precipitation and drought conditions, and an assessment of the fuels available in different regions (like grasses, brush, and timber).
This year, 1,848,210 acres across the country have already burned—nearly twice the annual average over the past 10 years.
“It’s not necessarily a foregone conclusion that we’re going to have a really busy season, but everything is pointing that way,” said Jim Wallmann, a meteorologist for the U.S. Forest Service at the NIFC and one of the outlook’s authors.
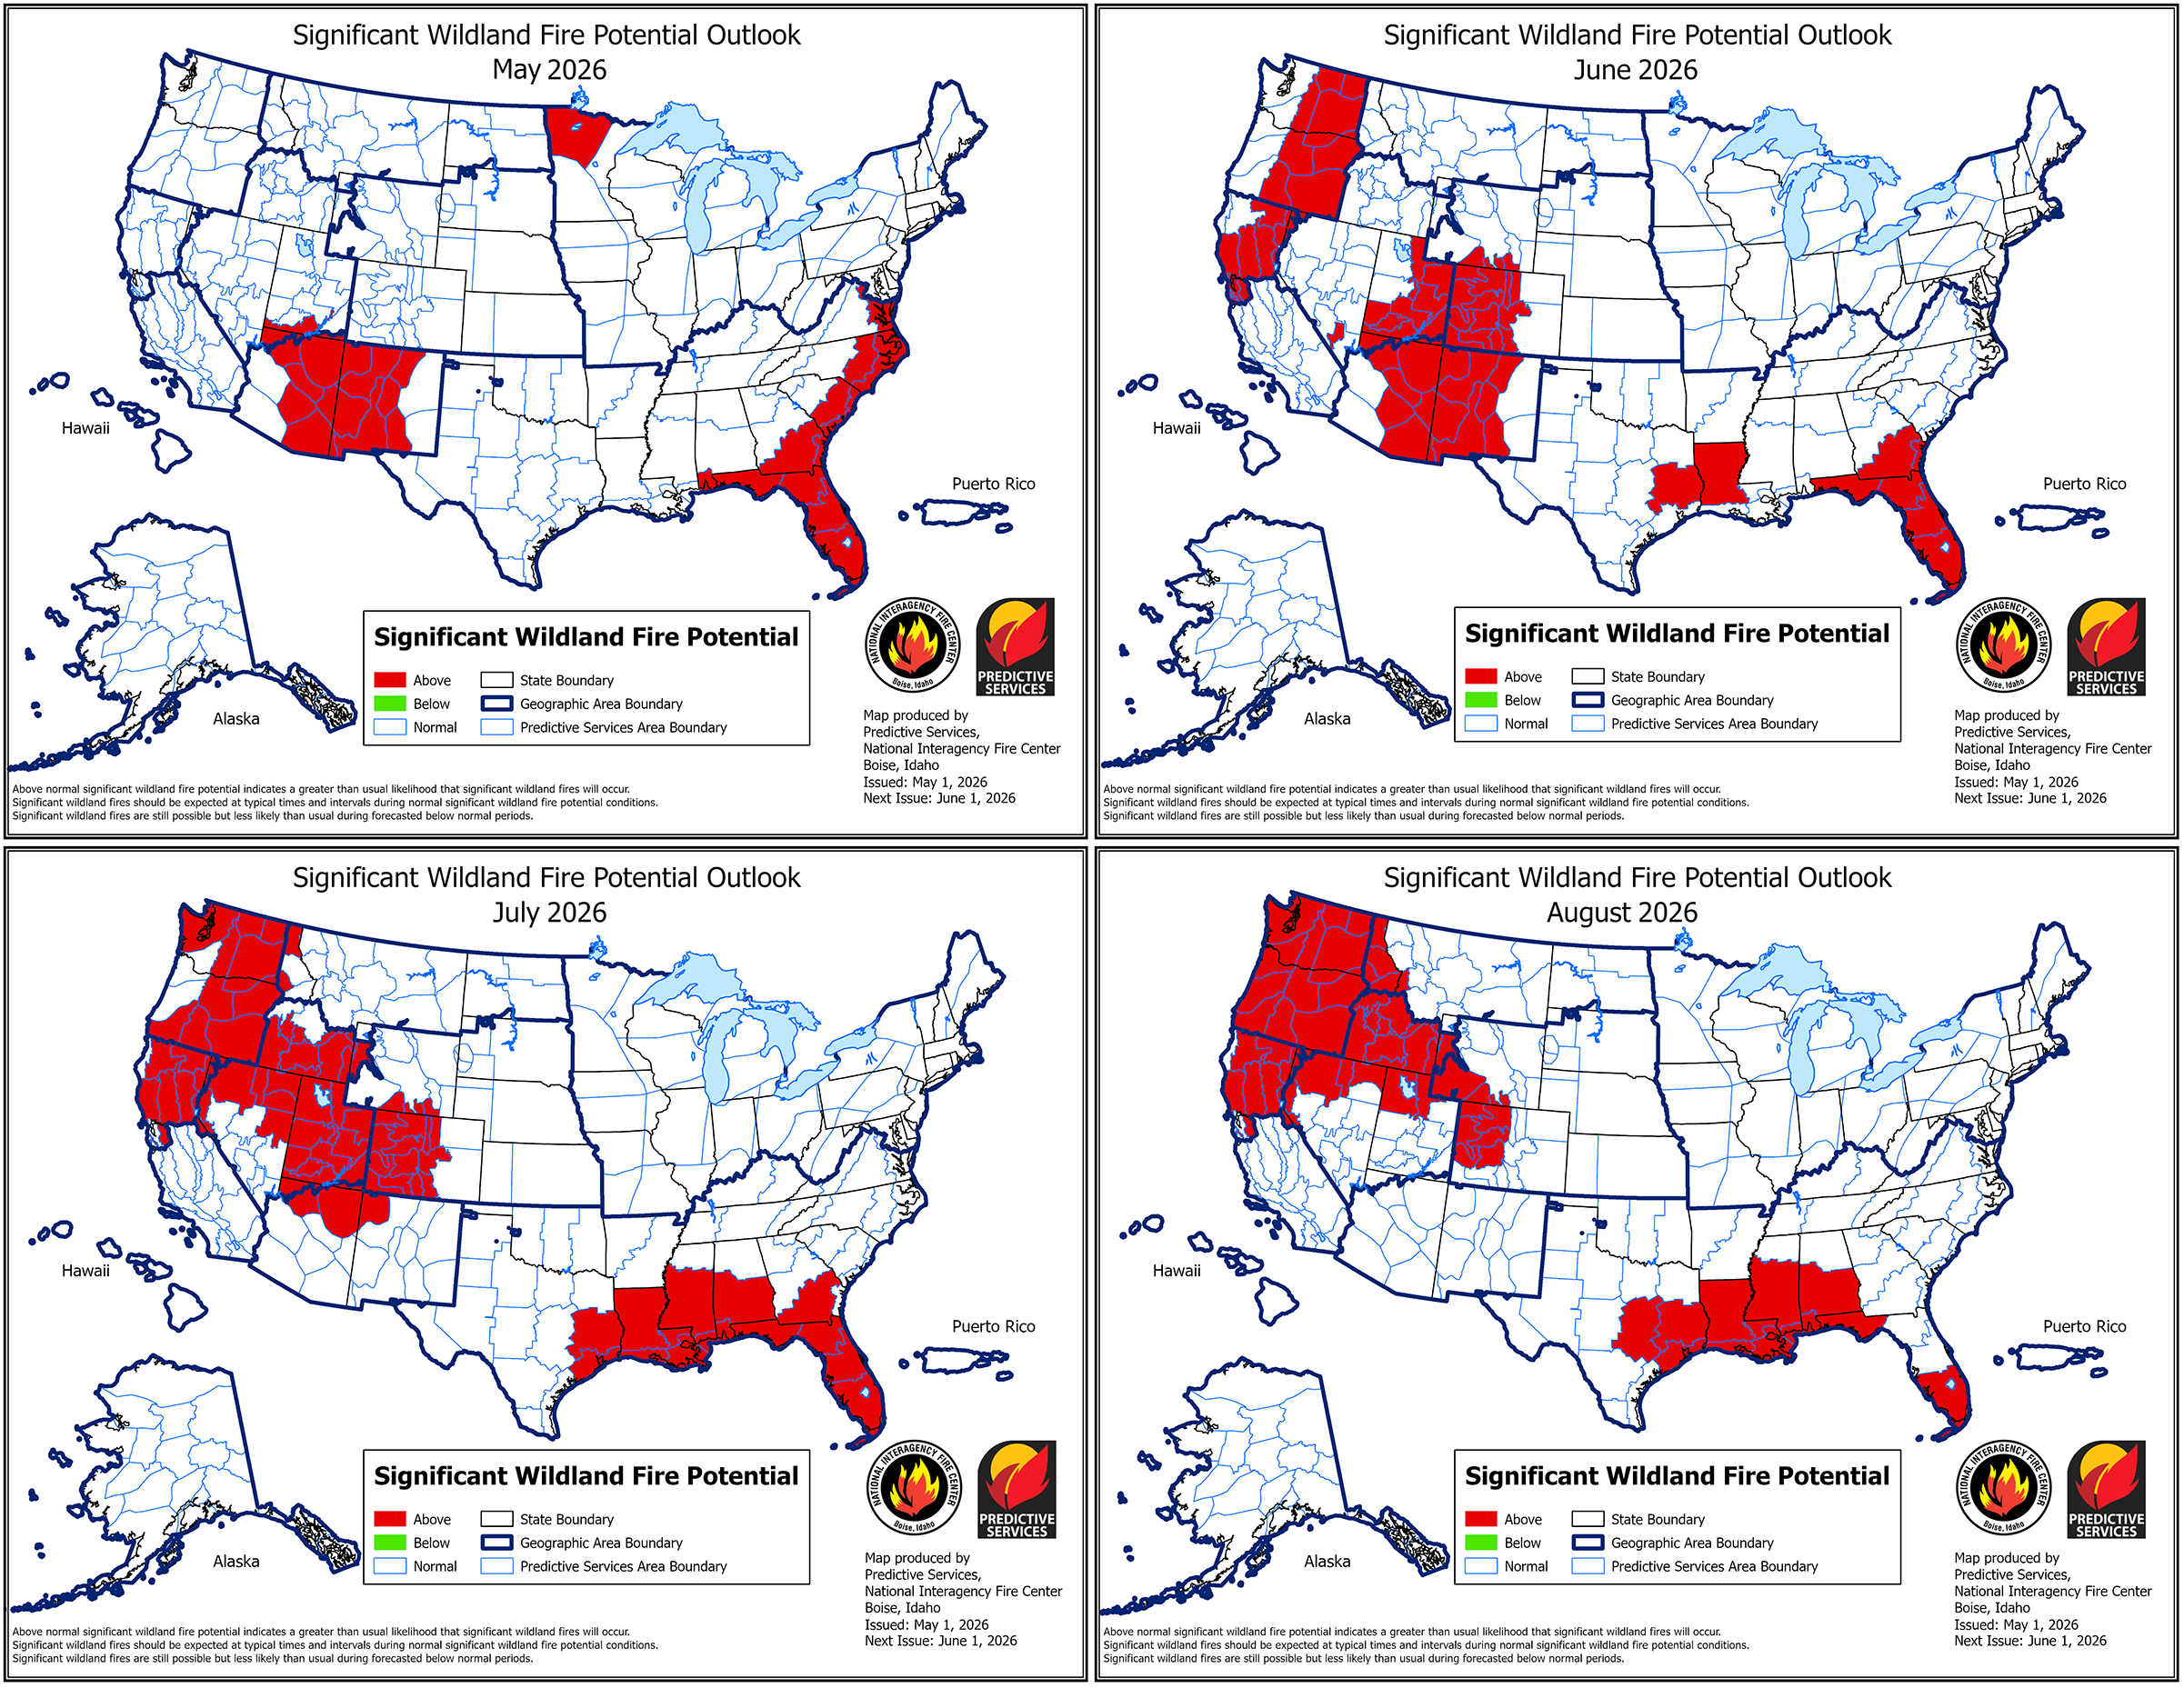
Significant wildland fire potential will be elevated across much of the West and Southeast this summer. Click image for larger version. Credit: National Interagency Coordination Center, Public Domain
Drought in the West
In the West, wildfire season typically peaks in late summer. This most recent outlook predicts an above-average significant fire potential for much of the West as the season peaks.
In May, the above-average risk is concentrated in eastern Arizona and western New Mexico, though that risk fades to normal by August as the Southwest’s monsoon season begins. In June, the above-average risk extends to western Colorado and parts of the Pacific Northwest. In July and August, that risk covers much of the Northwest, including Utah, Idaho, Oregon, Washington, and Northern California.
Above-average spring temperatures and a far-below-normal snowpack across the West are contributing to the elevated risk in Washington, Oregon, Idaho, and Northern California, in particular. Many river basins across the West contain less than 20% of their normal amount of snow, and some are already snow-free at all observed locations due to melting caused by warm temperatures in March.
As of May, many river basins in the West have a snow water equivalent—the amount of water held in their current snowpack—that is less than 50% (in red) of the 1991–2020 average level. Credit: USDA Natural Resources Conservation Service, Public Domain
“The snowpack being lower this time of year, and melting out, affects the soil moisture throughout the rest of the summer, which then affects the fuel moistures,” said Craig Clements, a meteorologist at San Jose State University’s Fire Weather Research Laboratory who was not involved in the outlook. Early snowmelt also uncovers fuels, like pine needles and leaf litter, that would typically be under snow, exposing them to the air to dry and catch fire.
Southern California and the Sierra Nevada mountain range, though, remain at an average significant fire risk throughout the summer, as a result of higher-than-average precipitation earlier in the year.
The Southeast and Beyond
Fire risk will also be elevated in the Southeast this summer. Florida, for example, remains at an above-average significant fire potential through the end of August. Southern Georgia, Mississippi, Louisiana, Arkansas, and the eastern halves of Virginia, North Carolina, and South Carolina will also have above-average significant fire potential.
The above-average risk is fueled, in part, by a worsening drought affecting the Southeast alongside the drought in the West. As of 1 May, nearly 63% of the country was experiencing drought, and 19% of the country was experiencing extreme or exceptional drought, according to the U.S. Drought Monitor.
The Midwest and the Northeast will remain at an average significant fire potential from May to August, though northwestern Minnesota faces an above-average potential in May.
No place in the United States is projected to have a below-average significant fire potential through the end of August.
Preparing Amid Uncertainty
A developing El Niño—a climate phenomenon that affects heat storage in the ocean—could alter the fire risk projections. Scientists expect that a strong El Niño could lead to a below-normal hurricane season, worsening drought in the Southeast. In the Pacific, a strong El Niño could intensify the hurricane season, which may lower wildfire risk.
However, a stronger El Niño could drive more lightning strikes in the Sierra Nevada, which could increase fire risk there, Clements said. In 2020, for example—a strong El Niño year—Hurricane Elida in the Pacific contributed to a lightning outbreak that supercharged wildfires in the West.
“We’re still not sure exactly how [El Niño] is going to impact the season.”
“We’re still not sure exactly how [El Niño] is going to impact the season,” Wallmann said. As late summer approaches, meteorologists will better understand how El Niño will develop and affect wildfire risk.
Weather patterns can change, and day-to-day conditions still play a role in fire occurrence. “If the weather shifts, or we get a really big heat wave, it can modify [the forecast]. Or if it remains relatively moderate, that might lessen the fire danger,” Clements said. “We’ll just have to see how the weather plays out.”
Wallmann and Clements emphasized that those living in areas with elevated fire risk should be aware of their surroundings and think ahead about where they might go for safety should a wildfire occur. “Having that situational awareness ahead of time can help you make better decisions,” Wallmann said.
Citation: van Deelen, G. (2026), Most of the U.S. West will face above-normal wildfire risk this summer, Eos, 107, https://doi.org/10.1029/2026EO260145. Published on 11 May 2026.