Research & Developments is a blog for brief updates that provide context for the flurry of news that impacts science and scientists today.
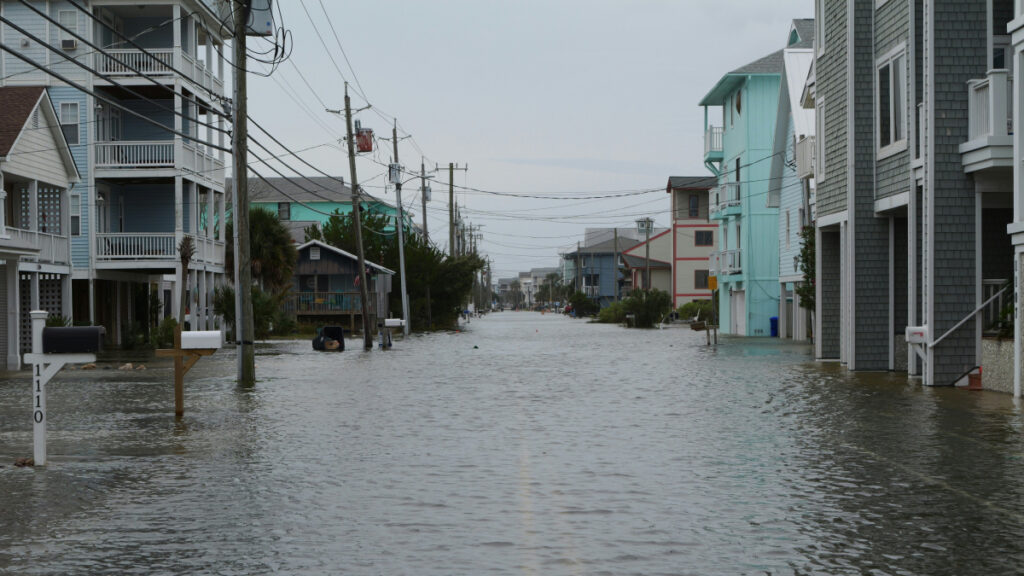
Human-driven climate change is driving the rise of sea levels, worsening flood conditions and threatening coastal communities around the world. Not only is sea level rising, but it’s rising faster every year. Understanding the degree to which different processes contribute to sea level, known as the sea level budget, can help scientists better predict where and how quickly sea level will rise under potential climate futures.
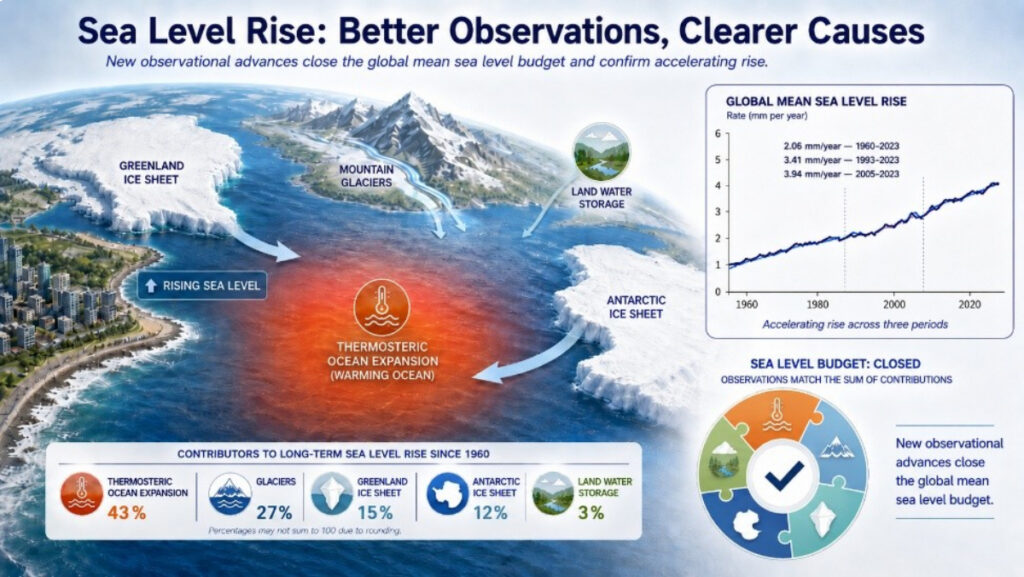
But for several decades there has been a “budget gap” between measurements of sea level change and the total estimated contributions from glaciers, polar ice, land storage, and oceans expanding as they heat up (thermospheric expansion). Research published today in Science Advances has helped close that budget gap by incorporating more recent sea level observations, reconciling measurements taken by different instruments, and including recent community estimates of sea level rise and its components.
The new analysis breaks down the drivers of sea level rise from 1960 to 2023. The team found that the largest contributor is heat-driven expansion of seawater, responsible for 43% of sea level rise since 1960. Melting ice contributed the next largest amount of sea level rise: 27% came from mountain glaciers, while 15% came from the Greenland Ice Sheet and 12% from the Antarctic Ice Sheet. Lastly, sea level rose 3% as land reduced its capacity to store water.
Since 1960, 43% of global sea level rise can be attributed to thermal expansion of water, just 3% to a reduction in land water storage, and the remainder from melting ice and glaciers. Credit: Zheng et al., Science Advances (2026)
“For years, there has been a frustrating gap between how much the oceans were observed to be rising and how much we could explain from the individual causes,” John Abraham, an engineer at the University of St. Thomas in St Paul, Minn., and a coauthor on the new research, said in a press release. “This work shows that, with better instruments, processes, and smarter analysis, this knowledge gap can be closed. We can explain sea level rise with greater confidence.”
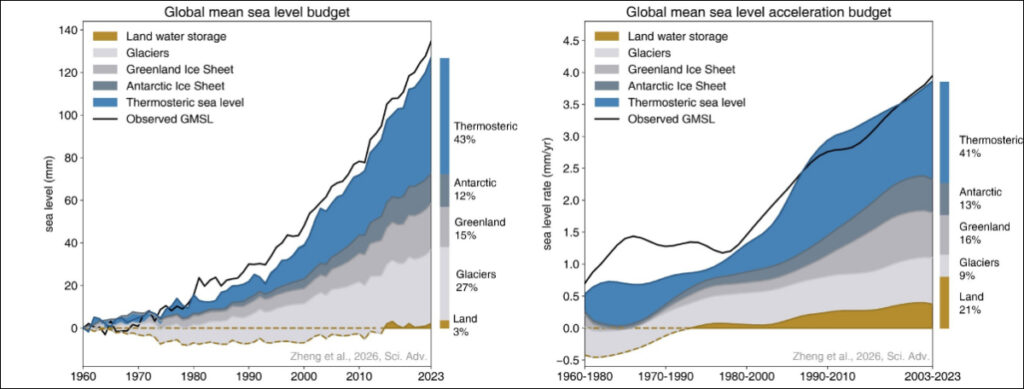
The researchers also calculated the rate at which sea level has risen since 1960 and how each component factored in. They found that the rate of sea level rise has recently doubled: It was 2 millimeters per year averaged over 1960–2023 and 4 millimeters per year averaged over just 2005–2023. The strongest driver of that doubling is ocean warming, responsible for 41% of the accelerating rate of sea level rise, followed by reduced land water storage (21%).
In the past, glacial melt was the largest contributor to sea level rise before it was overtaken by thermospheric ocean expansion overtook (left). The rate of sea level rise has been speeding up since about 1980, also driven by thermospheric ocean expansion (right). Credit: Zheng et al., Science Advances (2026)
This research demonstrates the importance of maintaining detailed records of sea level rise, collecting new measurements, and not backing away from global change research. With better data on which processes contribute to sea level rise and its acceleration, policymakers and local communities can create informed mitigation strategies that account for future rise.
These updates are made possible through information from the scientific community. Do you have a story about science or scientists? Send us a tip at eos@agu.org.
The retreat of glaciers and ice sheets is expected to have widespread impacts on communities around the world because of its effect on sea levels. Already, the global average sea level is more than 10 centimeters higher than it was just 3 decades ago; and the rate of rise is increasing, contributing to increased storm surges and flooding, lost infrastructure and community lands, and more.
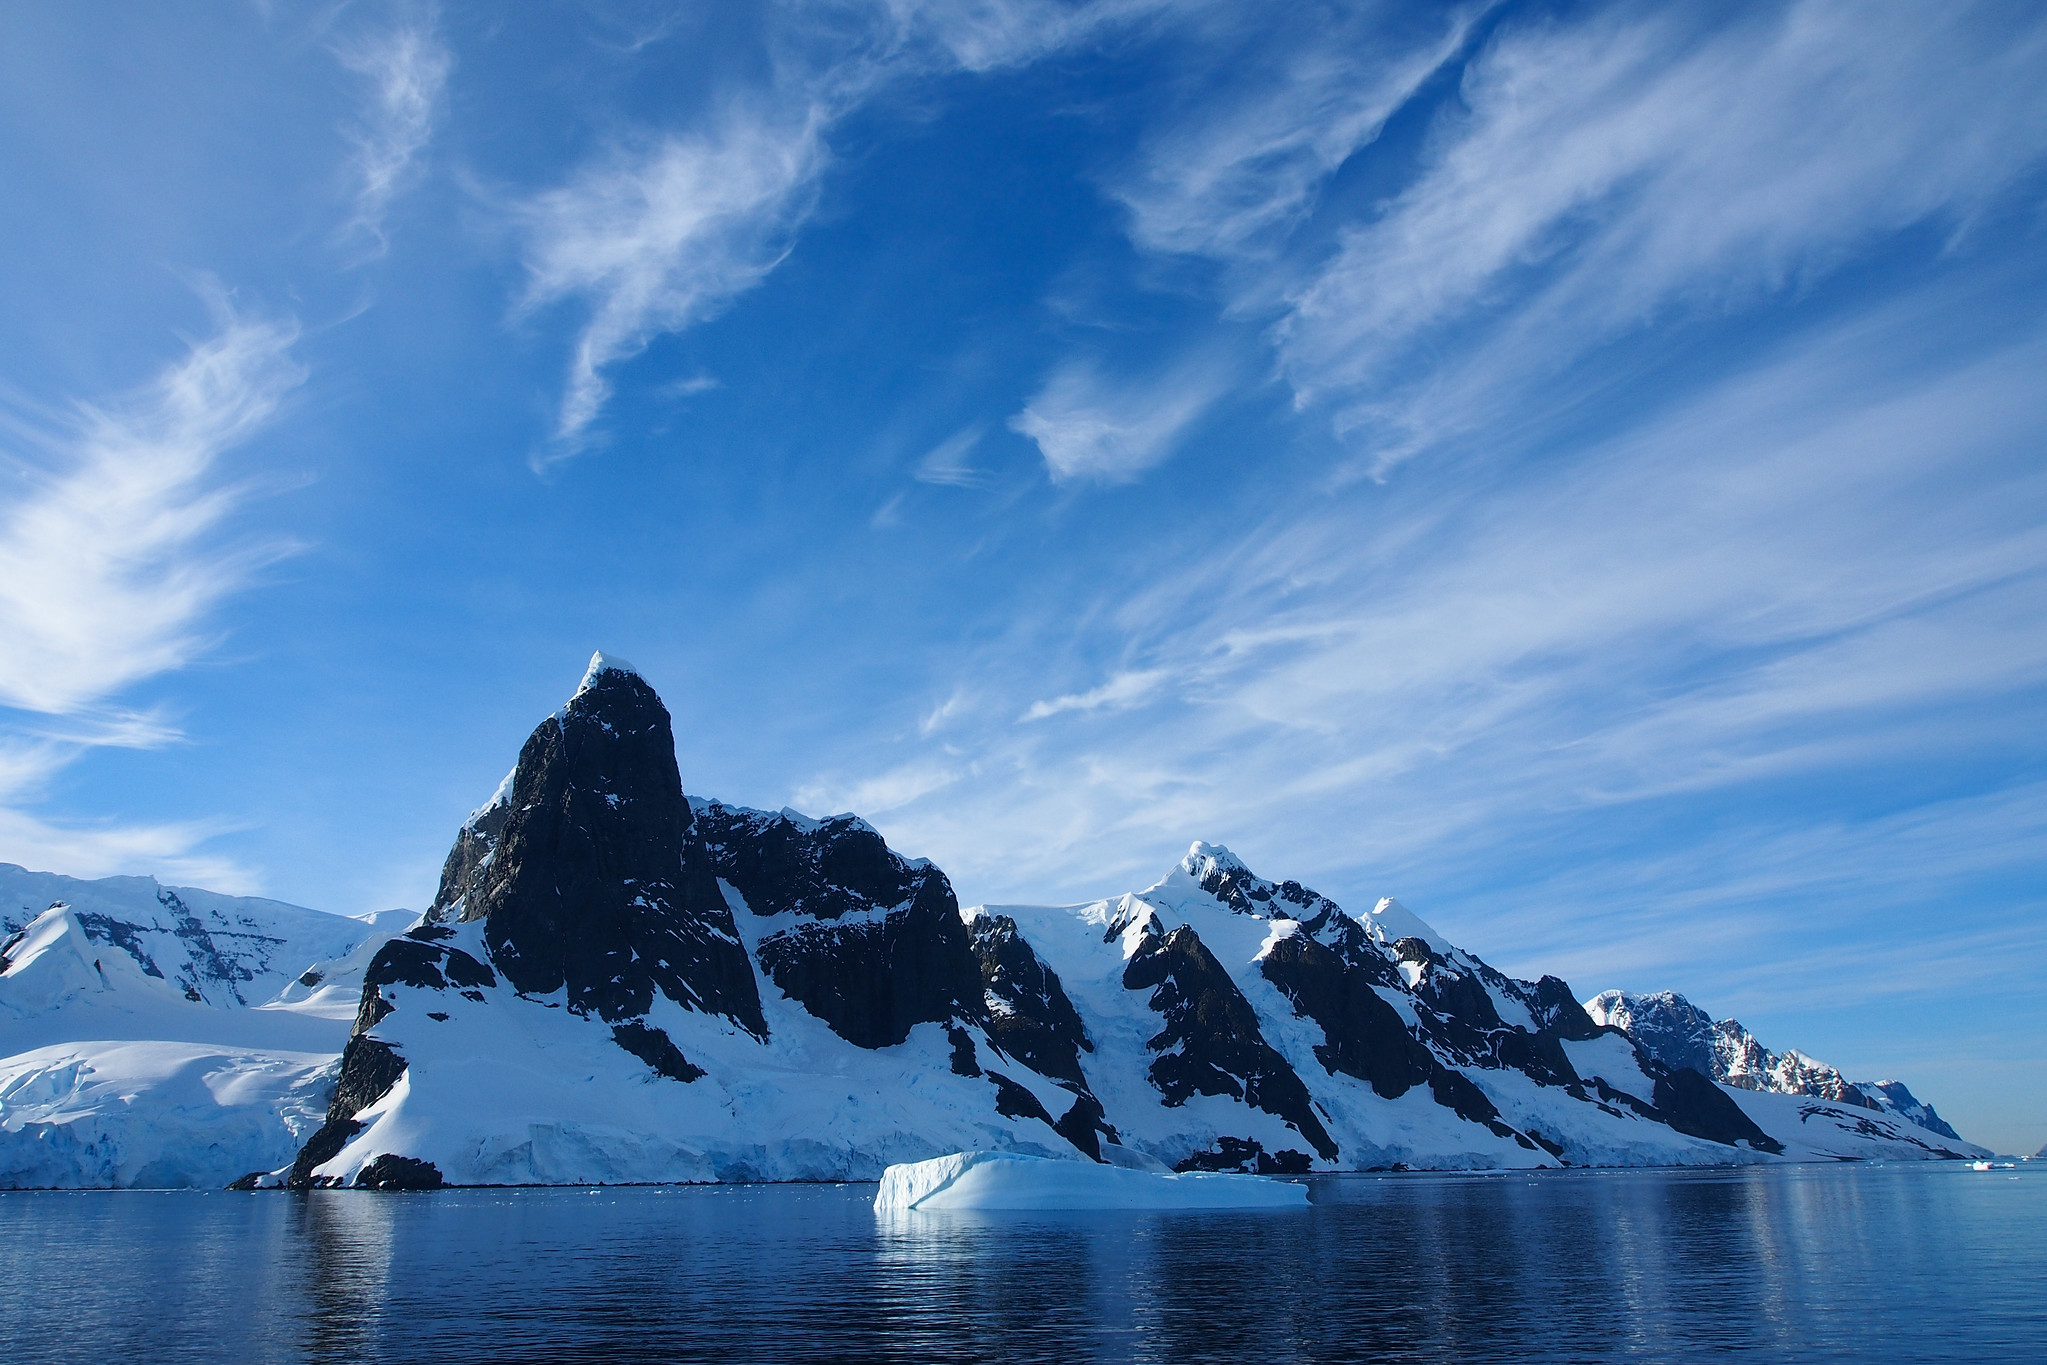
Recent reports on the instability of Antarctica’s Thwaites Glacier, for example, have focused attention on how accelerating ice flow can lead to ice sheet collapse and rising sea levels.
Earth’s ice sheets accumulate ice through snowfall and lose mass through a mix of surface ablation, iceberg calving, and melting at their interface with the ocean. Glacial ice flows under its own weight, and the rate at which it flows to coastal areas is a primary control on ice sheet mass loss.
Flow rates depend on how much resistance an ice sheet encounters at its interface with the ground (e.g., whether it is frozen to its substrate) and on its effective viscosity, a measure of how strongly it resists deformation. The viscosity of ice, in turn, varies based on properties including temperature, crystal size and orientation, and impurity content.
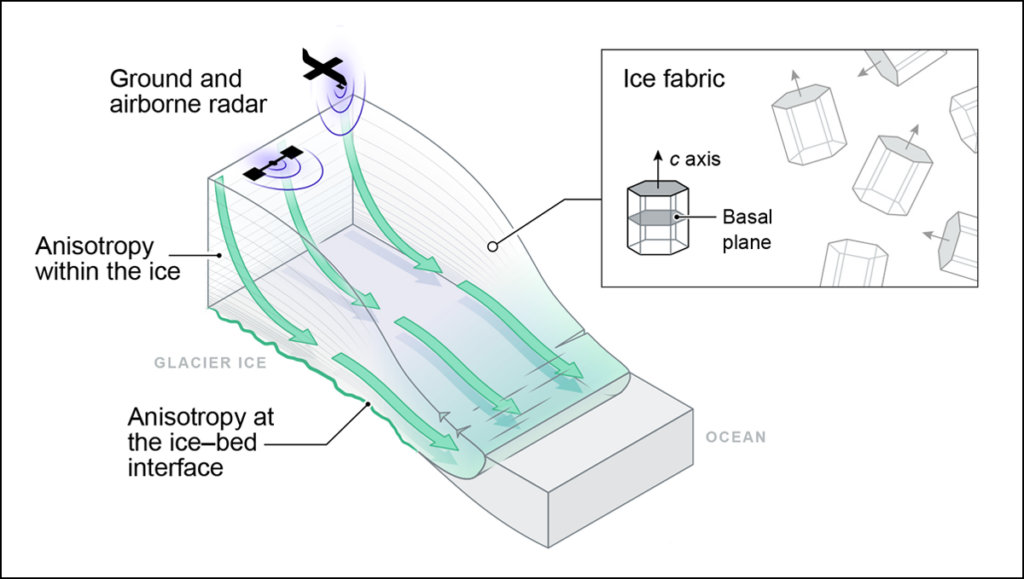
Some properties within and beneath ice sheets that affect how they flow are anisotropic, meaning they vary by direction. For example, roughness in some directions at the ice bed can facilitate ice sliding more effectively than roughness in other directions, similar to the way a properly oriented corrugated metal roof allows snow to slide off. Several forms of anisotropy within ice also affect how ice flows from land to ocean (Figure 1).
Fig. 1. Anisotropy in glaciers and ice sheets has various sources, including from ice fabric and other properties within the ice (englacial) or at the ice-bed interface. Many forms of anisotropy in glacial ice can be measured with radar. Credit: Adapted from Hills et al., 2025, https://doi.org/10.1029/2024RG000842, CC BY 4.0
Measuring anisotropic properties is key to better understanding how quickly changes at the edges of the Greenland and Antarctic ice sheets will lead to sea level rise. Recent advances in ice-penetrating radar technology and in processing radar data are revolutionizing how we observe directionally varying ice sheet properties, paving the way for projections of mass changes that account for previously neglected processes.
Crystal Fabric: Memory and Modulator of Ice Flow
Fabric, the orientation of crystals composing ice, is the best studied and arguably most important of anisotropic ice sheet properties. As ice deforms, for example, by stretching horizontally as it flows toward the coast, its millimeter-scale crystals are reoriented (Figure 1).
Fabric thus contains a memory of past flow. Simultaneously, fabric influences flow because ice crystals are about 3 orders of magnitude easier to shear in some directions than others—similar to how stacked playing cards slide easily against each other when held along their edges but resist motion when pinched top to bottom.
Over the past 20 years, radar polarimetry has matured into a quicker and easier alternative means for inferring fabric.
The potential importance of fabric on large-scale ice flow has long been recognized, but a shortage of observations has made it difficult to quantify and validate its effect in ice sheet models. Until recently, fabric could be measured only directly in ice cores or inferred through seismic soundings. These methods provide highly detailed information about how fabric develops but are expensive, logistically taxing, and provide information only about sparse point locations.
Over the past 20 years, though, radar polarimetry has matured into a quicker and easier alternative means for inferring fabric, enabling observations at the scale of entire glaciers and providing new constraints on how fabric influences ice sheet flow.
How Radar Reveals Fabric
Ice-penetrating radar instruments emit electromagnetic energy as radio frequency waves. These waves reflect off interfaces within and beneath glacial ice, including transitions in ice chemistry and the contact surface between the ice sheet and the ground or water below. The properties of the reflected waves are then measured when they return to the radar. Just as fabric leads to anisotropic ice deformation, it also introduces directional dependence in the measured electrical properties.
The speed of a radar wave through an ice crystal is approximately 1% faster if the wave is polarized across the crystal’s principal (c) axis rather than aligned with it. Though small, this difference can compound enough that it causes measurable changes in returned radar signals.
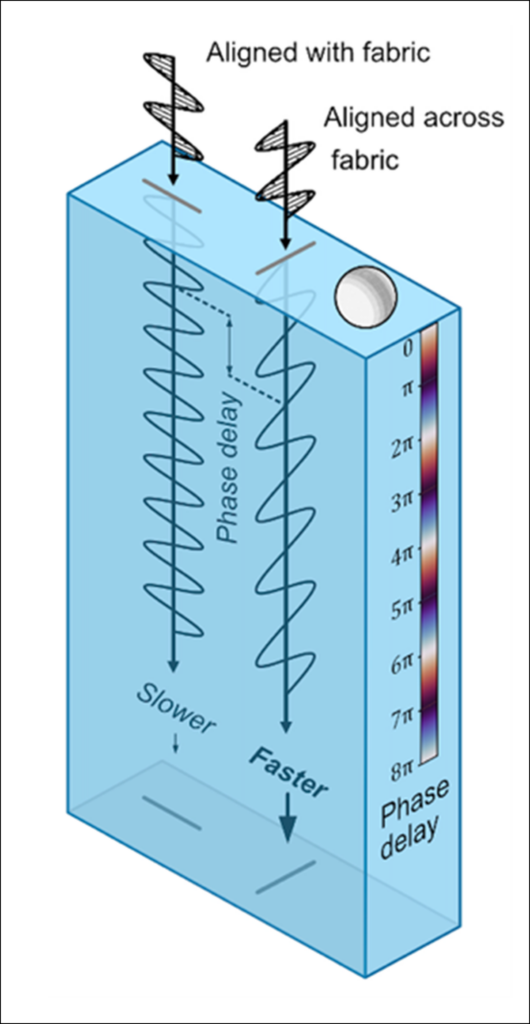
In a typical radar survey over anisotropic ice, waves with different polarizations travel at slightly different speeds (Figure 2). The times that return signals arrive back at the receiver thus vary directionally, a difference that can be identified using polarimetric radars that transmit and receive radio waves at multiple orientations.
Fig. 2. Propagation of polarized radio waves through anisotropic ice reveals structural variations with depth because waves aligned across the prevailing ice fabric (represented by the ball, in which darker shading indicates a greater concentration of c axes) travel faster than waves aligned with the fabric. The phase delay increases as the effect of the anisotropy accumulates with depth. Credit: Adapted from Hills et al., 2025, https://doi.org/10.1029/2024RG000842, CC BY 4.0
Fabric’s effect on radar signal travel times accumulates through an ice column, so it is more prominent in thicker ice with stronger horizontal fabric (i.e., the ice crystals are more consistently aligned). In such cases, differences in travel times between polarizations can be measured even by standard radars.
When fabric is weaker or ice is thinner, the offset is smaller and detectable only by systems that can identify the phases of radar returns—that is, the exact positions of the returned waves in their oscillation cycle. Even small wave speed differences from weak fabrics accumulate into measurable phase shifts between polarizations, which can be used to determine the consistency of crystal alignment and the predominant crystal orientation.
Small differences in fabric through an ice column can also change the strength, or amplitude, of returned signals. This amplitude difference offers an independent way to identify fabric orientation and its depth variation.
Polarimetric radar has been widely applied in cryospheric science in recent years largely due to the advent of low-cost systems that can measure signal phases. For example, the popular Autonomous phase-sensitive Radio Echo Sounder (ApRES) is a lightweight, ground-based system that can be used to infer ice fabric at single points down to 2 kilometers deep. In the past decade, polarimetric ApRES systems have revealed ice flow histories, including changes in flow directions, of key glaciers over the past few millennia. These measurements offer windows into how ice sheets responded to previous climate variations.
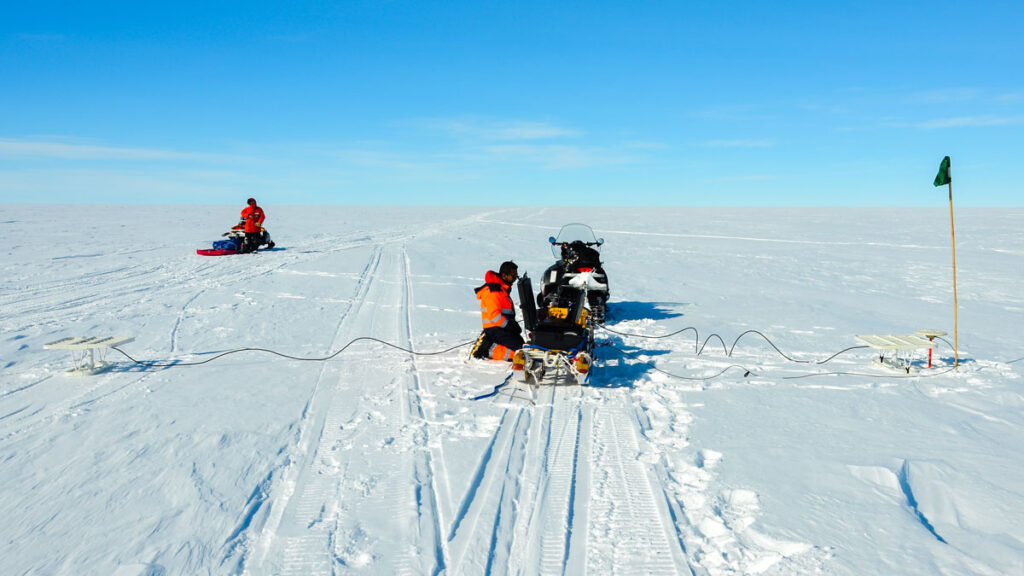
A mobile, quad-polarimetric radar is dragged by snowmobile over the surface of Müller Ice Cap on Axel Heiberg Island in Nunavut, Canada, in May 2023. Credit: David Lilien
The next generation of polarimetric radars go beyond one-point-at-a-time stationary soundings, offering full polarimetry capabilities on moving platforms. These systems may soon allow scientists to map directional ice properties at the scale of entire ice sheets.
Insights into Fast-Flowing Ice Fabric
The growing number of radar studies conducted near sites where ice cores have been collected, which allow fabric to be investigated up close, has provided validation and bolstered confidence that fabric can be inferred accurately from its effects on radar. Researchers now infer fabric from radar in more dynamic areas, such as Thwaites Glacier, Whillans Ice Stream, and the Northeast Greenland Ice Stream (NEGIS), where ice fabrics change over short spatial scales and where drilling ice cores is logistically difficult. Airborne radar surveys are particularly effective in these settings because they can efficiently map fabric variations across large, fast-moving areas.
Observations of strong fabrics in fast-flowing regions suggest that fabric is an important control on ice viscosity, although its implications for ice flow are just beginning to be explored. For example, at Rutford Ice Stream in Antarctica, ApRES data indicate that fabric causes sharp changes in viscosity in different directions with depth, a complexity not captured by current ice flow models.
A combination of airborne and ground-based radar shows that the fabric of the NEGIS varies substantially across the ice stream, which facilitates horizontal shear that allows faster and more cohesive flow in the middle of the ice stream while simultaneously stiffening this ice against along-flow stretching. These viscosity variations may alter how quickly coastal changes, such as increased melt due to climate warming, influence inland ice flow.
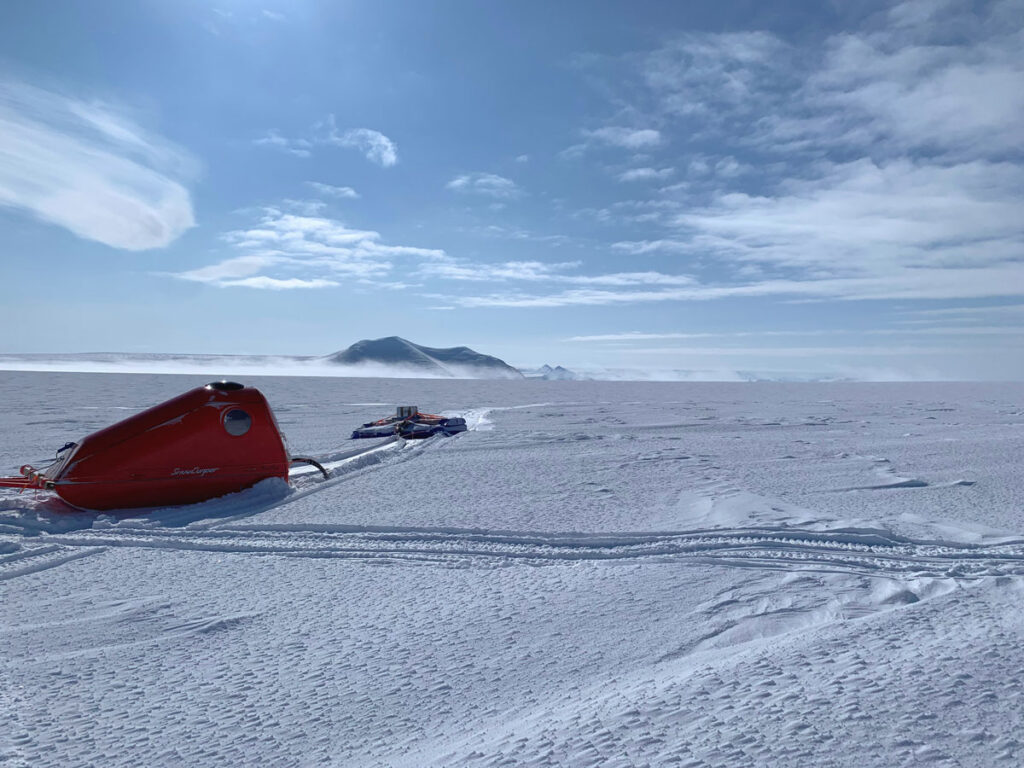
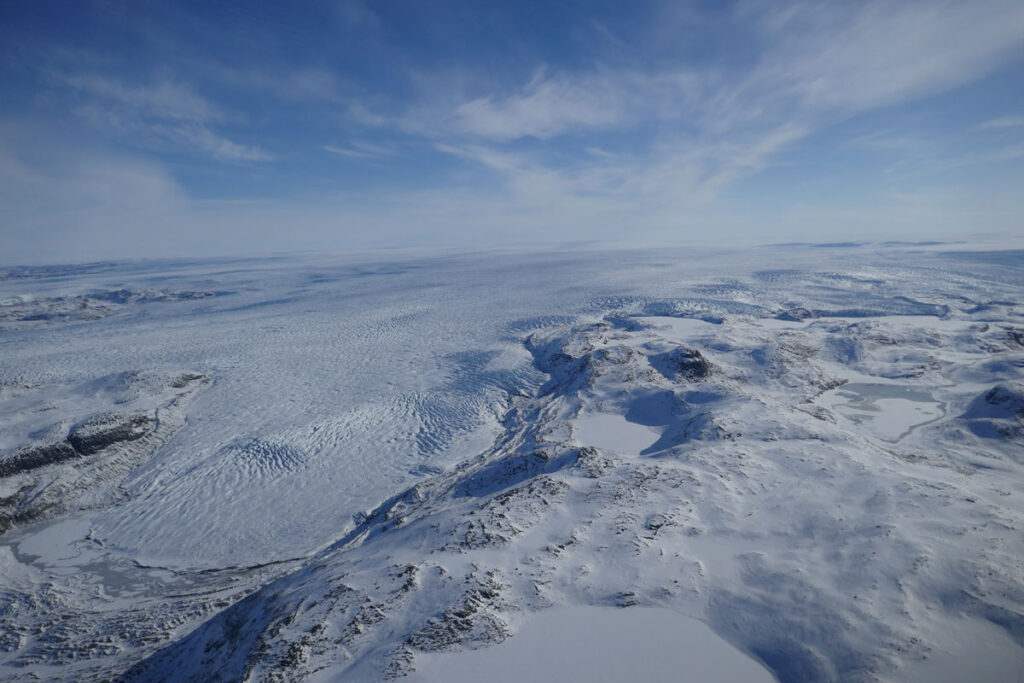
Scientists have studied ice sheet mass balance at glacier-mounted stations along the renowned “K-transect” near Kangerlussuaq in southwestern Greenland since the early 1990s. This image shows a view up the transect in April 2025. Polarimetric radar offers another tool with which to study ice flow here and at other locations on the ice sheets. Credit: Tamara Gerber
The emerging consensus from radar observations and recent progress in fabric modeling is that ice fabric can soften ice stream shear margins by a factor of 10. In other words, the fabric tends to develop in a way that greatly reduces the ice’s effective viscosity at lateral boundaries between fast-flowing and slower-flowing ice, which enables the ice to deform more easily at the margins. The agreement between observations and process-scale modeling highlights fabric as a major, but largely ignored, control on ice flow that may affect estimates of how ice dynamics will contribute to future sea level rise.
Beyond Fabric
Most polarimetric radar studies so far have focused on fabric, but other ice characteristics can cause directional effects too. For instance, bubbles trapped in ice have dramatically different properties than ice itself. Ice deformation can bring bubbles into alignment, such that they affect radar waves differently in different directions.
Likewise, ice at its melting point can contain liquid water along boundaries between crystals, and if those pockets of water are aligned in one direction, they can also affect radar returns. Each of these properties has important influences on ice flow, but their implications are yet to be explored.
Another source of anisotropy is the bottom boundary of the ice sheet. This interface can be rougher in some directions than others, though the roughness is typically aligned with the prevailing ice flow direction or the direction of meltwater trapped within the ice.
Polarimetric radar can measure directionally dependent properties of ice sheet bases at a finer scale than radar profiling can. Such work is leading to new insights into glacier geomorphology, interactions of ice shelf bottoms with the underlying ocean, and how ice slides over substrate surfaces. Rates and extents of sub-ice-shelf melt and basal sliding are widely recognized as key controls on the future of the ice sheets.
Expanding Horizons: Large-Scale and Planetary Applications
Radar polarimetry has already transformed our understanding of ice fabric, revealing much about how crystal alignment modulates the flow of Earth’s ice sheets and filling critical gaps between the handful of direct measurements from ice cores. As polarimetric techniques mature, their applications are expanding.
Researchers are moving from studying isolated profiles of ice fabric to mapping it across whole basins, a key shift for validating bespoke models of fabric and its effects on flow. These models are also rapidly developing to include additional physical processes (e.g., migration recrystallization) and key simplifications (e.g., reducing directionally varying viscosity to a single number) that allow them to interface more easily with—and be incorporated into—large-scale models used for projecting sea level rise.
Techniques pioneered for measuring ice on Earth may also prove useful elsewhere in the solar system.
Techniques pioneered for measuring ice on Earth may also prove useful elsewhere in the solar system. Orbital radar sounders have already probed Mars’s ice masses, and the icy shell of Jupiter’s moon Europa will soon be surveyed by single-polarization radars aboard NASA’s Europa Clipper and the European Space Agency’s Jupiter Icy Moons Explorer (JUICE). These radars might be useful for polarimetry at some locations on Europa, which could reveal past and present motion of ice features and answer fundamental questions about the moon. Whether Europa’s shell flows, for example, may be key to whether its subsurface ocean can harbor life.
As polarimetric radar systems become routine tools for glaciologists and as similar instruments begin operating on spacecraft exploring icy worlds, a technique once limited to a few isolated core sites on Earth could be poised to transform our understanding of ice across the solar system.
Author Information
David Lilien (dlilien@iu.edu), Indiana University Bloomington; T. J. Young, University of St Andrews, Fife, Scotland; Benjamin Hills, Colorado School of Mines, Golden; Tamara Gerber, Université de Lausanne, Lausanne, Switzerland; and Matthew Siegfried, Colorado School of Mines, Golden
Citation: Lilien, D., T. J. Young, B. Hills, T. Gerber, and M. Siegfried (2026), New directions in mapping ice sheet fabrics and flow, Eos, 107, https://doi.org/10.1029/2026EO260154. Published on 14 May 2026.
WASHINGTON, June 9 — From handcuffed extra-terrestrials to an orbital missile command centre — US President Donald Trump is unleashing a relentless stream of AI-generated imagery that analysts view as an effort to dominate the attention economy ahead of perilous midterm elections.
Artificial intelligence has transformed Trump’s Truth Social feed into a cascade of memes skewering his political rivals and glorifying himself, with the communications style echoed across his administration.
The attention-grabbing posts come as Trump’s approval ratings slide to new lows ahead of elections in November, in which his Republican Party is seeking to maintain its narrow control of Congress.
Trump is “facing many problems that he has failed to solve,” including an unpopular war with Iran and inflation, Todd Belt, director of the political management program at George Washington University, told AFP.
“So, he’s flooding the information environment with positive images of himself, particularly images that make him look large and in charge.”
For a president facing multiple challenges, Trump has averaged about 20 posts a day on Truth Social this year, researchers say, with many of those posts — sometimes part of late-night tirades — featuring AI-generated imagery.
During one particularly active stretch last weekend, one post showed Trump riding horseback beside George Washington, next to a race car, with the White House in the background.
Another depicted an enlarged image of Trump towering over Greenland beneath the words “Hello, Greenland!”
Trump has raised alarm by repeatedly threatening to take over Denmark’s autonomous territory, saying it is vital for national security.
‘Diverting attention’
Another image showed Trump looming over warships, dressed as a military commander clad in gold armor, as fighter jets flew overhead.
Trump may be attempting to control the narrative with such AI-generated imagery, some observers say, even as he triggers backlash — such as with his now-deleted post depicting himself as Jesus Christ.
“Trump’s AI trial balloons are yet another strategic distraction, reducing public dialogue to the most banal issues in hopes of diverting attention from more important topics of the day,” Nora Benavidez, senior counsel at the advocacy group Free Press, told AFP.
“If we are busy debating his likeness to Christ or some other AI-generated savior image, Trump hopes we might not have the time or energy or solidarity to challenge his latest war or rising unaffordability and gas prices.”
Other analysts say the AI messaging could seek to rally his support base and campaign through trolling.
‘Illusion is powerful’
“Trump is posting these to generate emotion,” Cory Alpert, a researcher at the University of Melbourne, wrote in a report.
“His followers are not seeing actual truth, but a version of reality that they want to believe is true. The illusion is powerful.”
Underscoring the strategy’s potential appeal to younger voters, similar AI-driven messaging has also been adopted by other arms of the Trump administration as well as by some of the president’s political rivals.
It is unclear how much of the Truth Social feed is posted by Trump himself, by his White House team or a combination of both. The White House did not respond to AFP’s request for comment.
“The White House is certainly aware of the stakes of the midterm elections, and the president’s sensational AI renderings reflect the need to attract attention to initiatives he believes are successful,” Walter Scheirer of the University of Notre Dame told AFP.
“Whether these AI fantasies and the less than spectacular circumstances they’re based on resonate with voters will be determined in November.” — AFP
COPENHAGEN, June 1 — Piano notes tinkle in the background and the aroma of brown butter wafts through the air as Habi Khaliqdad delicately garnishes a slice of soy-glazed narwhal with puffed bacon.
For seven years, the 33-year-old chef has been living north of the Arctic Circle with one obsession, tattooed on his right arm: to earn Greenland’s first Michelin star.
The prestigious restaurant guide will hand out its accolades to restaurants in the Nordic region today.
Through the bay window of the Ulo restaurant in Ilulissat, the view fades into the snow and the ice fjord beyond, its giant icebergs drifting out to sea.
Khaliqdad stands out with his angular, smiling face, arms covered in tattoos, and a steady stream of swear words always being used. He often questions why anyone would take on his challenge.
Just getting supplies is one mountain to climb.
In late March, when the winds have shifted, the pack ice closes up, forcing fishermen to leave. Khaliqdad cannot get his hands on redfish, a large fish with tender flesh.
The menu includes “Qaqortoq lamb sweetbreads with Italian white truffle and onion jus”. None of these ingredients can be found in Ilulissat however.
On this harsh land almost devoid of agriculture, the lamb travels nearly 1,000 kilometres (600 miles) from southern Greenland to reach Ilulissat by boat or plane.
“If there’s a storm... you have to wait,” Khaliqdad said.
Airplanes are at the mercy of blizzards, cargo ships of the pack ice which cuts Ilulissat off for most of the winter.
Khaliqdad, who has to import nearly everything, embodies the juxtaposition of modern-day Greenland: a land of opportunities, but with many constraints.
Finding himself
But Khaliqdad stands out behind the high-gloss walls of the restaurant in the Hotel Arctic.
After a life marked by loss, hardship and addiction, the Dane of Afghan origin found salvation in the kitchen.
As a teenager, he started out as a dishwasher.
“It was French food that gave me this energy in the beginning,” he recalled.
He devoured the books of famed French chef Paul Bocuse, and started working as a kitchen hand before moving up through Copenhagen’s most prestigious establishments, where he was a finalist for the 2017 Chef of the Year award.
Of the 263 restaurants in the Nordic Michelin Guide, 37 in Denmark have stars.
The small country, long known for its heavy fare, has become a temple of European gastronomy. But that wave has yet to cross the Labrador Sea.
“My boss told me, ‘Go to Greenland, man. It’s cold and you’ll find yourself’,” Khaliqdad said.
In debt, he exiled himself in the Danish autonomous territory to rebuild his life.
‘Think local’
On the Italian-made kitchen island, his Japanese knife finely slices narwhal, reindeer and ptarmigan.
When he first arrived, he dived into botany books, searching for new flavours to lighten up the rustic Greenlandic, meat-heavy cuisine.
In the end, it was Stella, a hotel cleaning lady, who told him where to gather mushrooms and angelica plants.
In summer, during the few snowless weeks, he and his team roam the rocky hills.
“I learned to not think about Nordic, European, Michelin cuisine. I have to think about this country’s cuisine,” he said.
Gastronomy capital
In the restaurant, tourists, in stylish apres-ski gear, finished off their desserts, their glassware and cutlery clinking.
Nearly 50,000 tourists visit this town of 5,000 inhabitants every year to gaze at the icebergs.
Ilulissat, Greenland’s tourism capital, now aims to become a good food haven as well, with a culinary school project recently launched.
In October, the opening of a new international airport is expected to lead to a doubling of the number of visitors.
“Maybe they can help me with this small dream I have in my body, you know?” he said, touching the star tattooed on his arm.
For now, travel to Greenland is costly and tricky, even for Michelin inspectors.
Khaliqdad also struggles to hire local staff, as few Greenlanders have the proper training.
The winters are difficult, too. A few years ago, one young kitchen hand committed suicide, a stark reminder of the social woes on the Arctic island.
During his second day of testimony on Capitol Hill, Secretary of State Marco Rubio said he hopes that the latest round of high-level political talks between Israel and Lebanon will result in a joint statement on ending hostilities. Israeli and Lebanese ambassadors to the U.S. are meeting at the State Department for a second day of negotiations.
As meltwater drains through and beneath a glacier, it can alter how the ice flows and whether it breaks apart. Meltwater can also cause feedbacks that lead to more ice loss. Understanding when and how glacial meltwater drains is therefore critical to predicting how fast glaciers will lose ice and how that loss will affect sea level.
Chudleyet al. modeled how the rate of water flowing into a glacier relates to seasonal changes in the forces that squeeze and stretch ice—forces caused by gravity pulling the glacier downhill, by the ice sliding over subglacial water, and by how portions of the ice interact with the ocean.
The researchers focused on the Sermeq Kujalleq glacier (also known as Store Gletsjer or Store Glacier) in Greenland. In spring, meltwater can fill cracks, or crevasses, that run through the surface of this glacier. These crevasses sometimes go on to drain as the year progresses.
The researchers used satellite imagery from the Sentinel-2 mission to see how much water was present in crevasses between 2016 and 2022, focusing especially on 2019, when the Sentinel-2 satellites provided the best coverage of the glacier. They fed those data into a convolutional neural network to map water cover through the season and looked for a relationship between the mechanical forces acting on the ice and the formation and drainage of crevasse ponds.
The researchers found that the mechanical forces acting on ice are the dominant factor in determining when crevasse meltwater drains into a glacier. When seasonal changes cause ice to stretch, crevasses can drain suddenly, releasing the water they held.
The Greenland Ice Sheet sheds trillions of gallons of water each year, and knowing when to expect that water to drain through the ice sheet is key to understanding processes such as how the glacier slides across the bed and when meltwater emerges in the ocean. The study’s results likely also shed light on dynamic processes in other glaciers and ice sheets, the authors say, and should help inform representations of ice behavior in numerical models. (AGU Advances, https://doi.org/10.1029/2025AV002150, 2026)
Citation: Sidik, S. M. (2026), Stretching and squeezing release glacial meltwater, Eos, 107, https://doi.org/10.1029/2026EO260152. Published on 26 May 2026.
When we picture the effects of melting glaciers, many of us think of rising seas and retreating ice streams. But along Greenland’s coastline, a quieter transformation is underway, one that is affecting how the ocean breathes and how it reacts to and buffers itself against change.
In Young Sound, a fjord carved into Greenland’s remote northeastern coast, decades of monitoring have revealed that glacial meltwater does not simply dilute the salt in seawater. As fresh water enters the ocean, it weakens the ocean’s natural chemical resistance to swings in acidity. This so-called buffering capacity keeps seawater pH in balance. The loss of buffering due to freshwater runoff leaves these coastal waters unusually sensitive to even small biological and environmental shifts.
Atmospheric warming is accelerating fastest in the Arctic, and with it come longer glacial melt seasons and increased freshwater runoff. The result is a coastal ocean that is both a frontline witness to climate change and a laboratory for understanding how the chemistry of the seas can change in unexpected ways.
The Ocean’s Chemical Safety Net
Seawater chemistry is naturally buffered by dissolved ions that act as chemical shock absorbers.
Globally, the ocean absorbs about a quarter of carbon dioxide (CO2) emissions each year. That uptake helps to slow climate change, but at a cost. The more CO2 that water absorbs, the more acidic it becomes. Thankfully, seawater chemistry is naturally buffered by dissolved ions—particularly carbonate, bicarbonate, and hydroxide—that act as chemical shock absorbers. These negatively charged ions, collectively called alkalinity, bind to the positive hydrogen ions released when carbonic acid forms, keeping the ocean’s pH relatively stable compared with the more variable conditions in freshwater rivers and lakes.
The polar oceans play a special role in this balance and in the global carbon cycle because cold waters at high latitudes take up carbon from the atmosphere faster than warm tropical waters. Yet these regions are also changing the most rapidly.
When Meltwater Meets the Sea
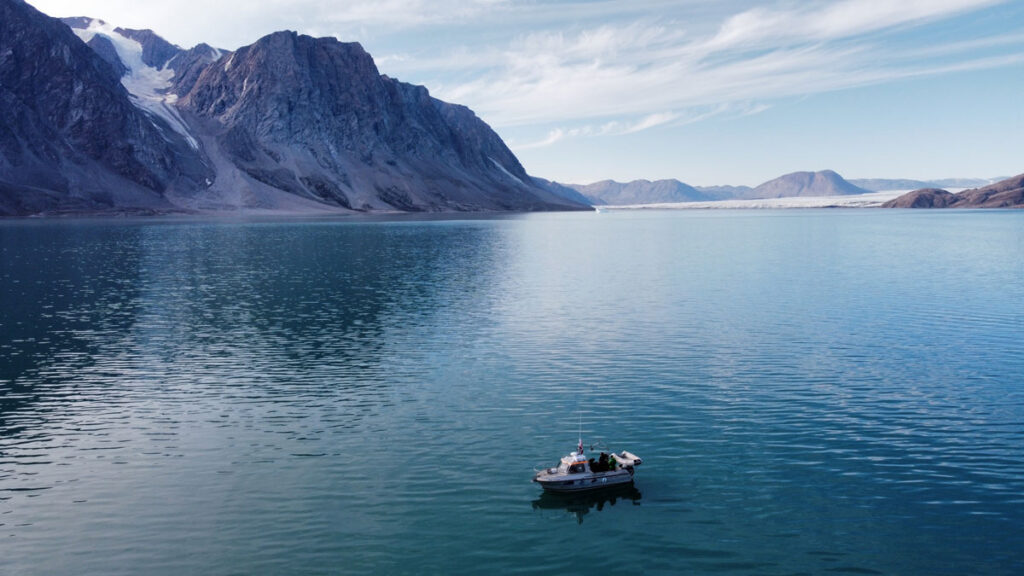
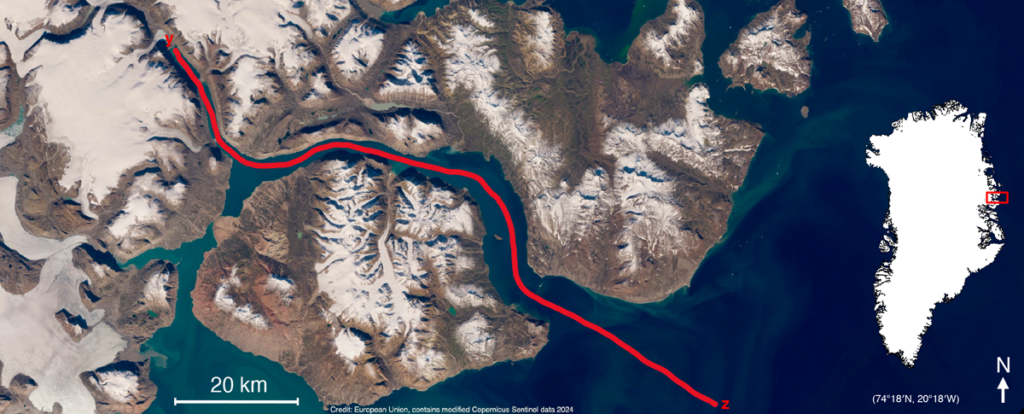
For 20 years, our team at Aarhus University has measured salinity, temperature, and carbon chemistry in Young Sound. Each August, we make the 2-day journey to northeast Greenland, where we spend the month sailing down the 90-kilometer-long fjord to capture these valuable measurements (Figure 1).
Fig. 1. The red line, running from the Greenland Ice Sheet (y) to the Greenland Sea (z), maps the route taken by researchers in August 2023 during their annual transect of Young Sound in northeast Greenland. Credit: Adapted from Henson et al., 2025, https://doi.org/10.1038/s43247-025-02685-4, CC BY-NC-ND 4.0
During the time we have monitored this ecosystem, the melt season has lengthened, with sea ice–free conditions now lasting 8 days longer than 20 years ago. Glaciers feeding the fjord are also thinning and retreating, discharging about 5.5 million cubic meters more water into the fjord each year. These changes have freshened the coastal ocean and subtly, but significantly, altered its chemistry.
Fjords like these have long been known as major CO2 sinks. Surface waters near glaciers often have very low CO2 concentrations, creating a disequilibrium between CO2 levels in the surface ocean and the atmosphere that draws carbon out of the air. But how or why these glacial ecosystems act as carbon sinks and what mechanisms are at play haven’t been thoroughly described. We have also been deeply curious about what else happens when fresh water enters the sea. What are the hidden consequences of this change?
To find out, we paired our long-term field observations with controlled lab experiments in which we mixed glacial meltwater with seawater. Controlled experiments allow us to dig into the nuances of chemical changes that are impossible to measure in the field. We also ran mixing models that allowed us to estimate how the chemistry of those mixed waters responds to small shifts in biological activity or mineral interactions.
The results were striking. When meltwater mixes with seawater, it not only reduces salinity but also dilutes alkalinity, the measure of how well water can neutralize acid and buffer against pH change. This weakening of buffering capacity means that even small changes in photosynthesis or respiration can drive much larger swings in CO2 uptake and acidity than they would in more saline waters.
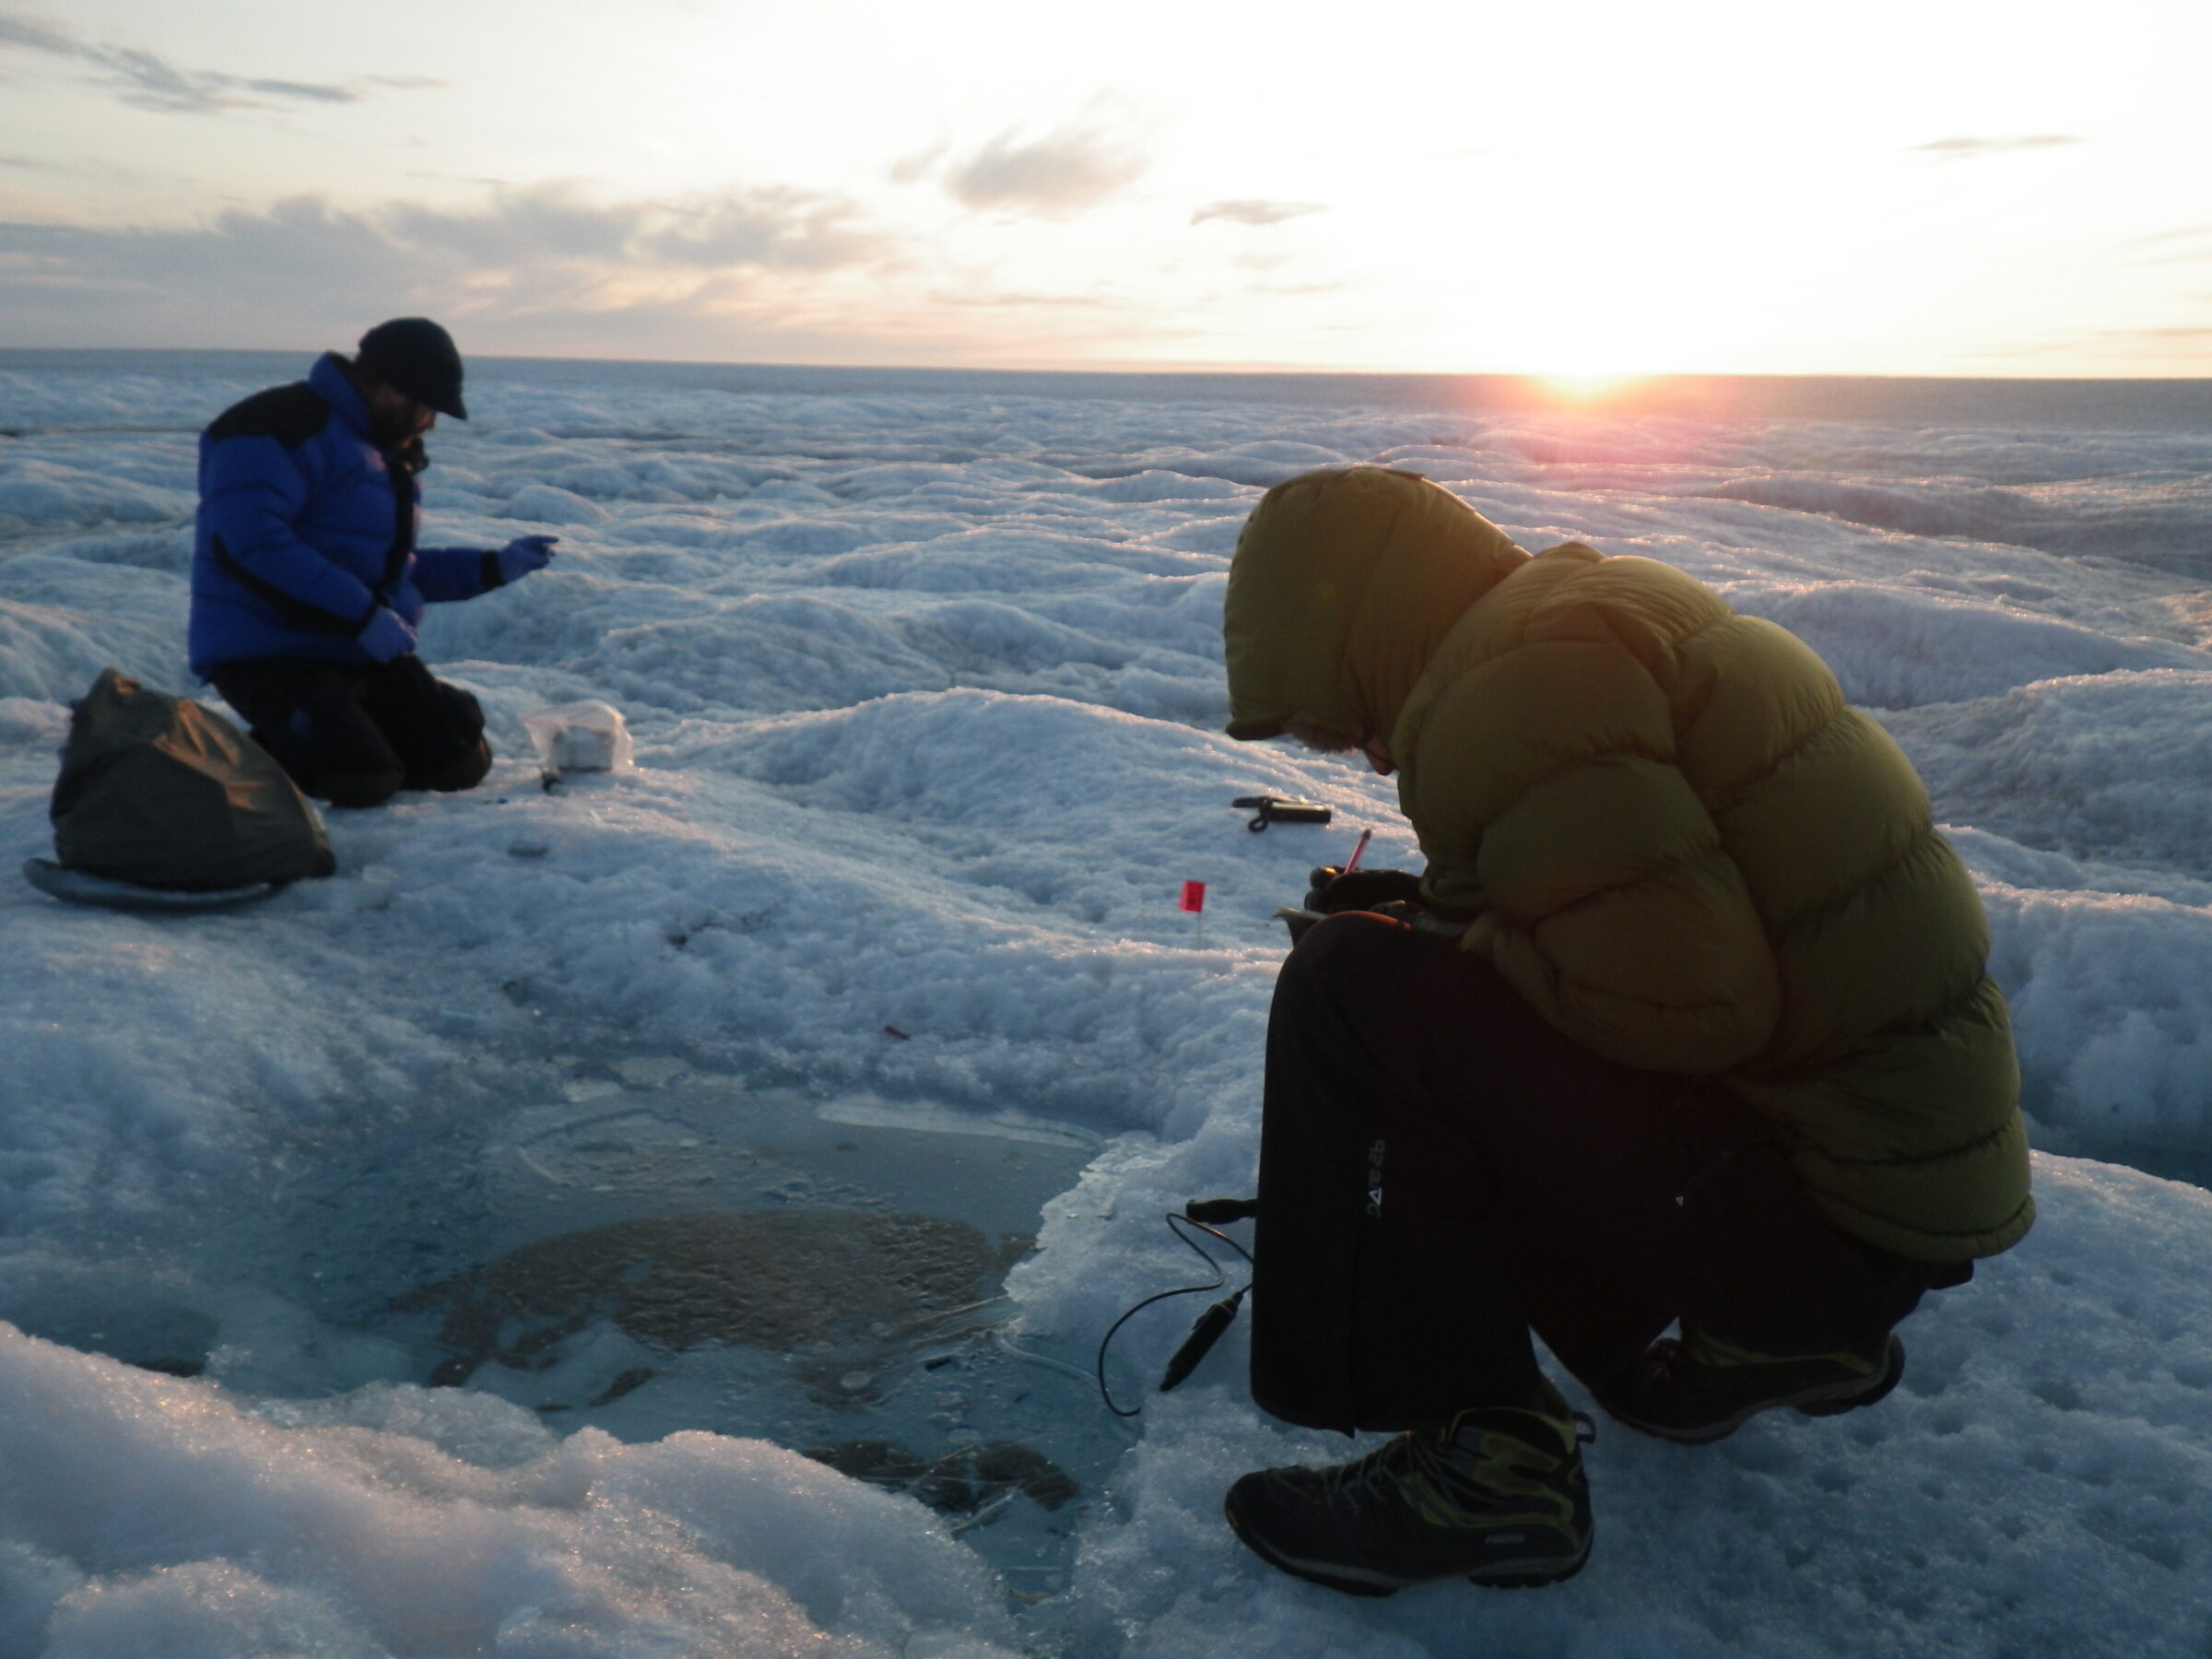
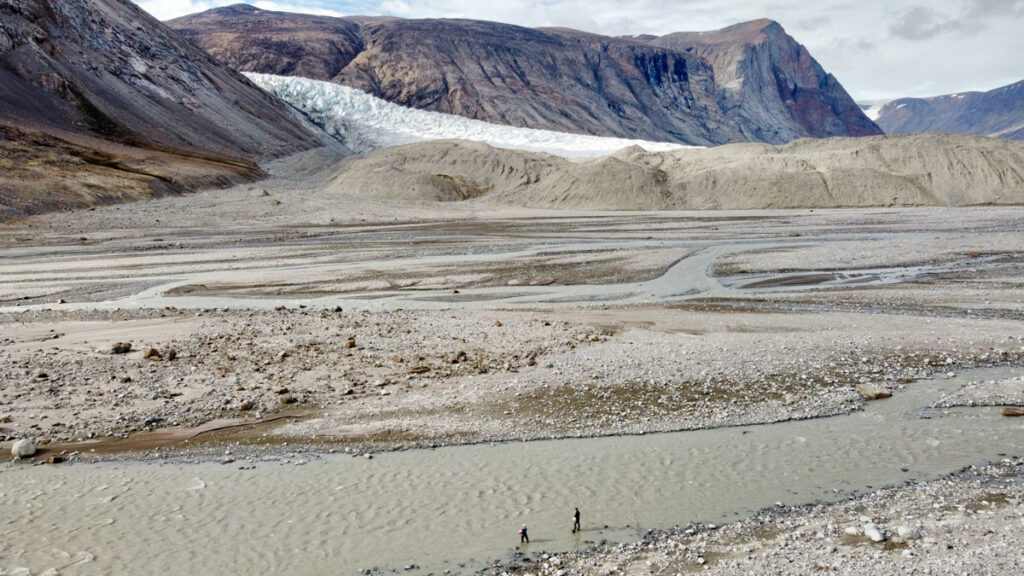
Two researchers wade into a meltwater river in Tyrolerfjord in Northeast Greenland National Park in 2023 to collect samples bearing the chemical fingerprints of climate change in the region. Credit: Henry C. Henson
We found that in the freshened waters of Young Sound, these processes have 2–3 times the influence on carbon uptake that they do farther out at sea. In effect, meltwater primes the coastal ocean to overreact, amplifying any ecosystem changes that might occur.
Measurements from around Greenland show that this is not just a theoretical risk. Surface waters are measurably more acidic where meltwater inputs are high. The biological consequences of this trend are still uncertain, but species living at the edge of their tolerance, such as shell-forming plankton and Arctic cod larvae, could face growing stress as the chemistry of their habitat fluctuates more widely.
A Fragile Balance in the Freshening Arctic
The findings confirm that fjords absorb carbon as a result of biological activity and glacial input but indicate that they do so in a fragile, easily tipped state.
Our study adds nuance to conventional perceptions of carbon cycling in fjords, long seen as places where atmospheric CO2 is drawn down. The findings confirm that fjords absorb carbon as a result of biological activity and glacial input but indicate that they do so in a fragile, easily tipped state. Slight shifts in the processes that pull CO2 out of the air could tip the scales in either direction: toward even more uptake and the accompanying acidification or toward a release of CO2 to the atmosphere.
This chemical sensitivity explains why Arctic fjords can show such strong seasonal and spatial swings in carbon chemistry and why predicting their long-term role in the carbon cycle is difficult. As glaciers retreat and meltwater inputs grow, those sensitivities are likely to intensify.
At first glance, changes in how seawater in the narrow, remote fjords of Greenland reacts to glacial melt might sound like a local concern. But the chemical processes at play have global resonance.
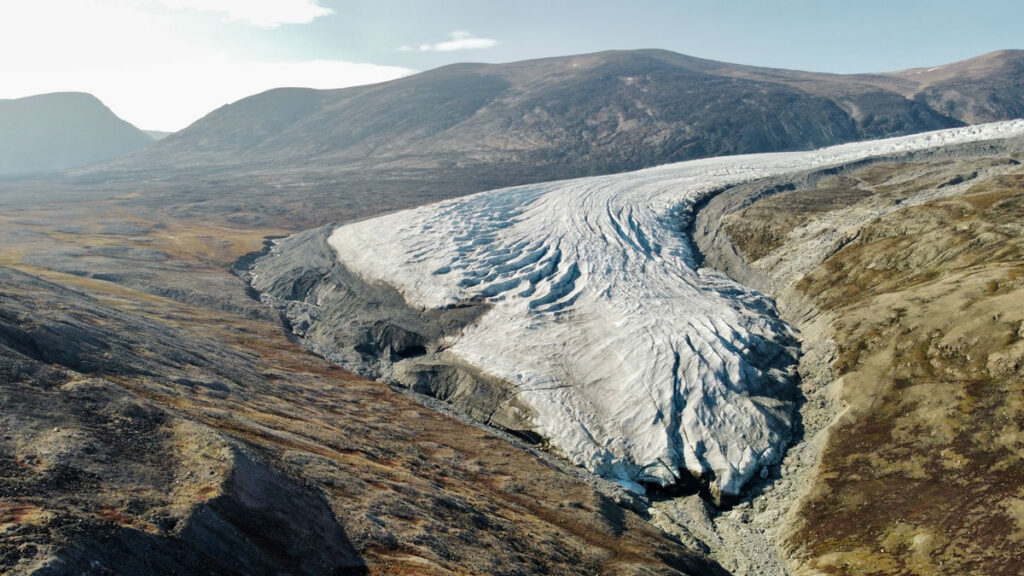
A tongue of the Greenland Ice Sheet retreats along the tundra as temperatures across the Arctic warm. Credit: Henry C. Henson
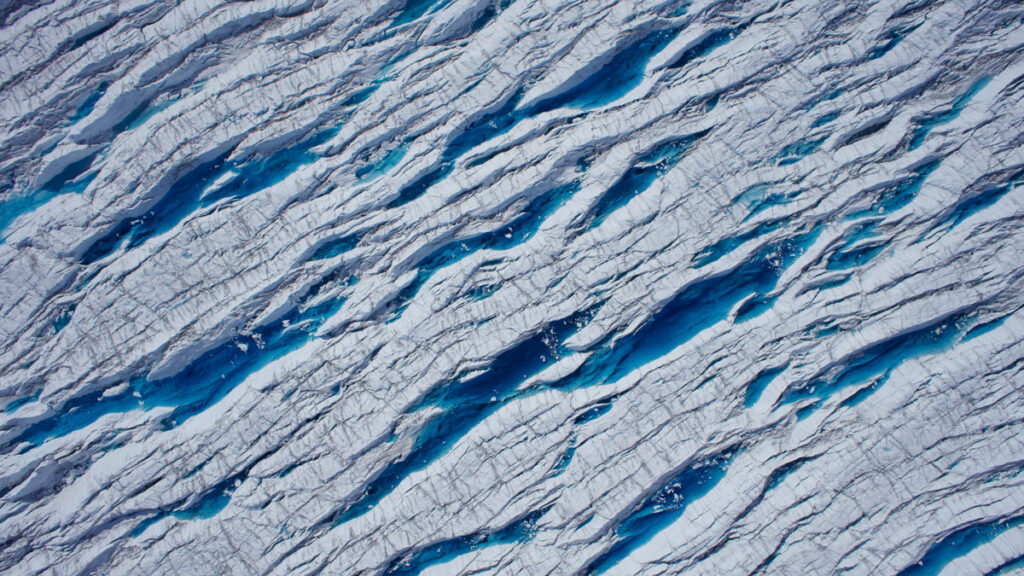
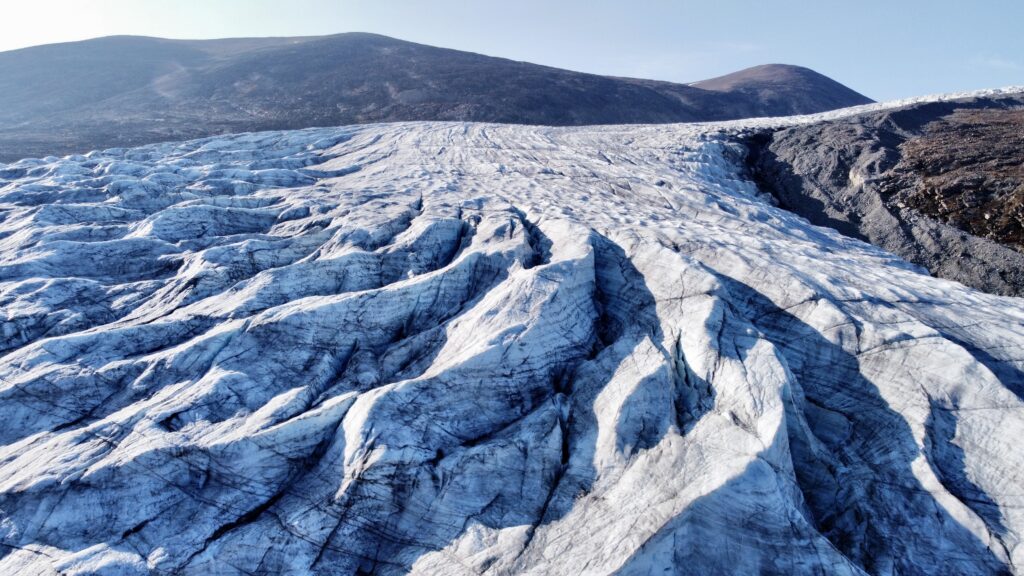
Ridges in the Greenland Ice Sheet tell a story of movement and melt. Credit: Henry C. Henson
Glacial meltwater from the Greenland Ice sheet flows into Tyrolerfjord and Young Sound and in Northeast Greenland National Park in August 2023. Credit: Henry C. Henson
The Arctic Ocean as a whole is freshening, driven by accelerating ice melt as well as by increasing river discharge and changing weather bringing more precipitation to the region. Although river water, which arrives from the six great Arctic rivers of North America and Eurasia, is more alkaline than glacial melt, its alkalinity is only about half that of seawater. In other words, river runoff also increases the ocean’s chemical sensitivity. Fresh water also delivers organic matter from permafrost, fine sediments from glaciers, and tannin-rich runoff from tundra soils, each of which can influence carbon cycling and further compound changes already underway.
Similar patterns of increased rainfall and runoff reducing surface salinity are emerging around the Antarctic Peninsula, the Gulf of Alaska, and the North Atlantic. Almost everywhere that fresh water enters the ocean, it lowers alkalinity and limits the ocean’s ability to buffer change.
A Window into Climate Intervention
Our results also carry lessons for researchers and companies contemplating ocean chemistry interventions as ways to remove CO2 from the atmosphere. One proposed approach, ocean alkalinity enhancement, involves adding crushed minerals such as lime, olivine, and basalt to seawater to both counteract acidification and increase the ocean’s capacity to take up CO2.
Glacial systems already perform a natural version of this experiment by grinding rock into fine sediment and discharging it into the ocean. Minerals in this sediment react with seawater and shape its carbon chemistry.
Our study suggests that such reactions are especially potent in freshwater-influenced coastal regions, where reduced buffering capacity may amplify chemical responses not only from natural biological processes but also from potential human attempts to alter seawater chemistry. Thus, understanding the balance between carbon uptake and chemical vulnerability will be essential before any large-scale interventions are attempted.
Consequences Locally and Globally
Coastal communities from Greenland to Alaska to northern Eurasia depend on Arctic waters as part of their cultural identity and, by way of fisheries and tourism, for their economic and food security. As chemical buffering capacity declines, coastal ecosystems may become more susceptible to acidification and other environmental stresses. Small changes in temperature, ecosystem metabolism, or nutrient inputs could then have outsized effects on the marine life that supports these communities.
As coastal glaciers retreat and meltwater rivers carve new paths to the sea, they are doing more than raising sea level and reshaping coastlines. They are rewiring ocean chemistry.
At the same time, changing conditions in coastal Arctic ocean regions complicate scientific modeling of carbon cycling and climate feedbacks, which typically relies on averaged estimates of the ocean’s chemical reactivity. With meltwater making the coastal ocean more reactive, these seas may absorb or release CO2 more variably than how global predictions would suggest. In addition to the real effects on local ecosystems, seawater chemical variability could also affect the accuracy of modeled global carbon budgets, which we use to inform future climate projections and guide international policy goals.
As coastal glaciers retreat and meltwater rivers carve new paths to the sea, they are doing more than raising sea level and reshaping coastlines. They are rewiring ocean chemistry, leaving it fresher and more easily disturbed.
The chemical sensitivity we see in Greenland’s fjords today may be a preview of what is to come in many coastal regions. If so, then we must be concerned with not only how much CO2 the ocean can absorb but also how stably it can hold that CO2 in a rapidly changing world.
Author Information
Henry C. Henson (hch@ecos.au.dk), Aarhus University, Denmark
Citation: Henson, H. C. (2026), Melting glaciers make the coastal ocean more sensitive, Eos, 107, https://doi.org/10.1029/2026EO260116. Published on 16 April 2026.