Dust and water ice clouds are ubiquitous on Mars; they regulate the planet’s climate and can affect measurements of other atmospheric components. Constraining their spatial and temporal variability is also essential for improving Martian general circulation models.
Fedorova et al. [2026] use solar occultation measurements from the SPICAM infrared spectrometer on board the Mars Express orbiter to characterize nine Martian years (MY 28 through 36) of dust and water ice clouds. Because the spectrometer could not distinguish between these particles’ types, the researchers employ a new method integrating Mars Climate Sounder data and general climate model predictions to identify them.
The analysis reveals that the particles can reach altitudes up to 80 kilometers during perihelion, while their size remains relatively uniform with height. This suggests that Martian dust distribution is driven more by atmospheric dynamics and horizontal transport, capable of lifting and moving particles over vast distances, rather than by turbulent mixing against gravity alone.
The study also provides a detailed seasonal and spatial climatology of major Martian atmospheric features, including the Polar Hood Clouds, the Aphelion Cloud belt, and the Mesospheric Clouds. The detection of high-altitude clouds (70–90 km) during dust events confirms enhanced transport of water vapor into the upper atmosphere during both global and regional storms. These findings are consistent with simultaneous observations from the Atmospheric Chemistry Suite on the Trace Gas Orbiter.
These observations show that large-scale atmospheric dynamics, rather than local mixing alone, control how aerosols are distributed vertically on Mars, with important implications for the transport of water to the upper atmosphere and the planet’s climate evolution.
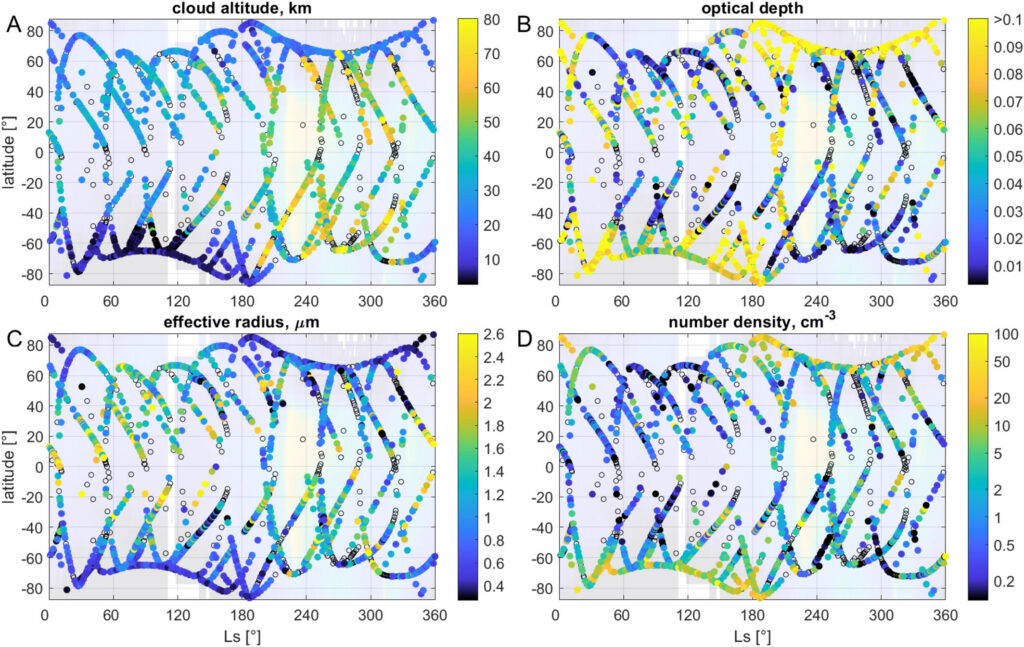
The figure shows how the water ice cloud layers vary with latitude and season (Ls), based on SPICAM observations. (a) altitude of the cloud layer in kilometers; (b) thickness of the cloud (optical depth); (c) average size of the ice particles in micrometers; and (d) number of particles within the layer (number density. The background color is the amount of dust in the atmosphere from Montabone et al. [2015]: red areas indicate high dust levels, while dark blue areas indicate low dust. Black open circles mark locations where no clear water ice clouds were detected. Credit: Fedorova et al. [2026], Figure 12
Citation: Fedorova, A. A., Luginin, M., Montmessin, F., Korablev, O. I., Bertaux, J.-L., Stcherbinine, A., & Lefèvre, F. (2026). Multiyear monitoring of aerosol vertical distribution on Mars by SPICAM IR/MEX. Journal of Geophysical Research: Planets, 131, e2025JE009388. https://doi.org/10.1029/2025JE009388
—Arianna Piccialli, Associate Editor, and Beatriz Sanchez-Cano, Editor, JGR: Planets
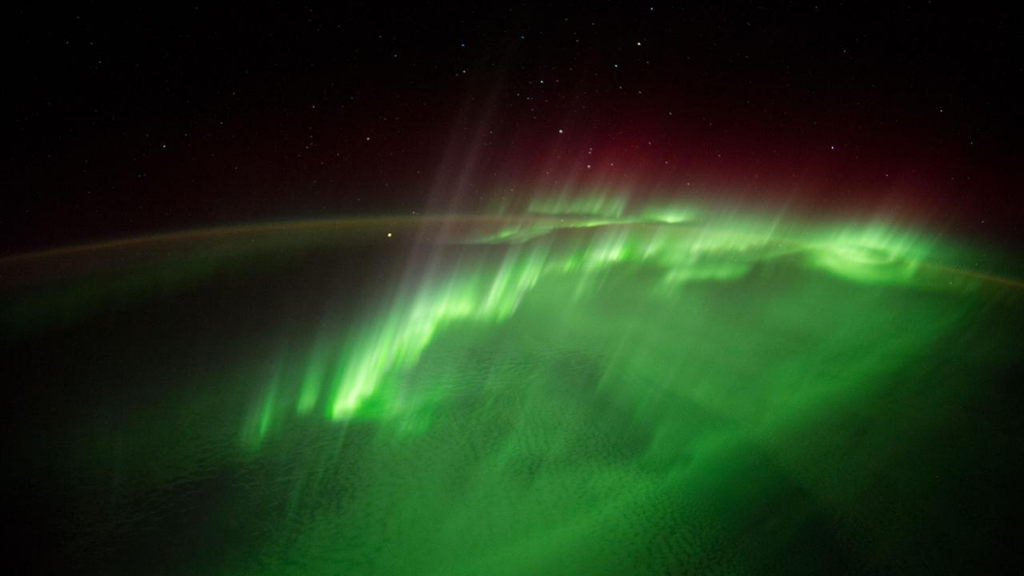
Most auroras appear in the “auroral oval” at high latitudes surrounding the magnetic poles. However, some can appear as a detached auroral arc from the auroral oval, at lower latitudes in mid-afternoon and connected to the oval only at a tip or two. Such a detached arc is believed to be linked to the “plasmaspheric plume,” the tongue-shaped extension of the plasmasphere during the recovery phase of a geomagnetic storm. (The plasmasphere is the torus-shaped region of cold, dense plasma above the low- and mid-latitude ionosphere.) The surface waves at the plume boundary cause it to ripple and modulate the various plasma waves in the plume.
Based on observations from multiple satellites and ground stations, Feng et al. [2026] find sawtooth-like undulations along the equatorward boundary of a detached auroral arc in the ultraviolet that was produced by energetic (>keV) electrons and accompanied by energetic (>10 keV) ions. The authors attribute the undulations to Electromagnetic Ion Cyclotron (EMIC) waves that are modulated by the surface waves and resonating with the energetic ions. The study unravels the fine-scale structures of detached auroral arcs and sheds important light on the dynamics underlying their formation.
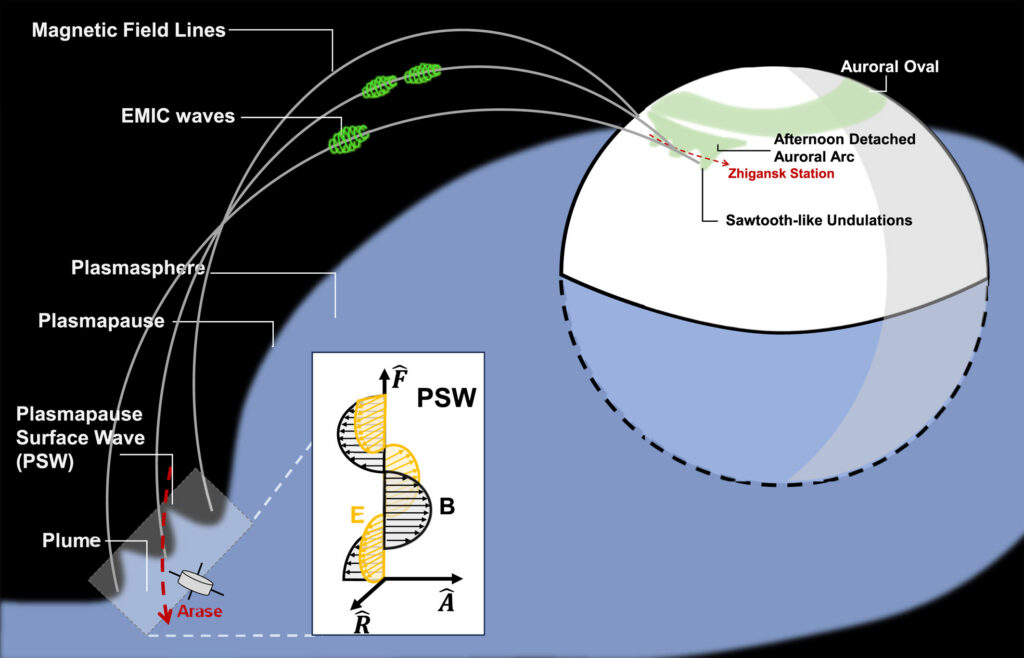
Schematic illustration of the formation mechanism for the sawtooth-like undulations of a detached auroral arc. The surface waves modulate the Electromagnetic Ion Cyclotron (EMIC) waves in the plasmaspheric plume, causing the energetic ions to precipitate into the ionosphere and resulting in the formation of an afternoon detached auroral arc with sawtooth-like undulations. Credit: Feng et al. [2026], Figure 4
Citation: Feng, H., Wang, D., Hao, Y., Miyoshi, Y., Fu, H., Jun, C.-W., et al. (2026). First observation of sawtooth-like undulations in afternoon detached auroral arcs modulated by surface waves at the plasmaspheric plume boundary. AGU Advances, 7, e2025AV002234. https://doi.org/10.1029/2025AV002234
Research & Developments is a blog for brief updates that provide context for the flurry of news regarding law and policy changes that impact science and scientists today.
Today, NASA announced an agencywide realignment that includes combining related mission directorates to sharpen the agency’s focus on human spaceflight.
“This initiative reflects NASA’s extreme focus on executing the mission in direct support of the National Space Policy,” NASA Administrator Jared Isaacman said in a press release about the realignment.
The National Space Policy refers to Executive Order 14369: Ensuring American Space Superiority, which was released by the Trump administration in December 2025. The order sets national priorities of returning Americans to the Moon, establishing a lunar base, developing a nuclear reactor in space, developing the commercial space economy, and enhancing the United States’ national security space architecture.
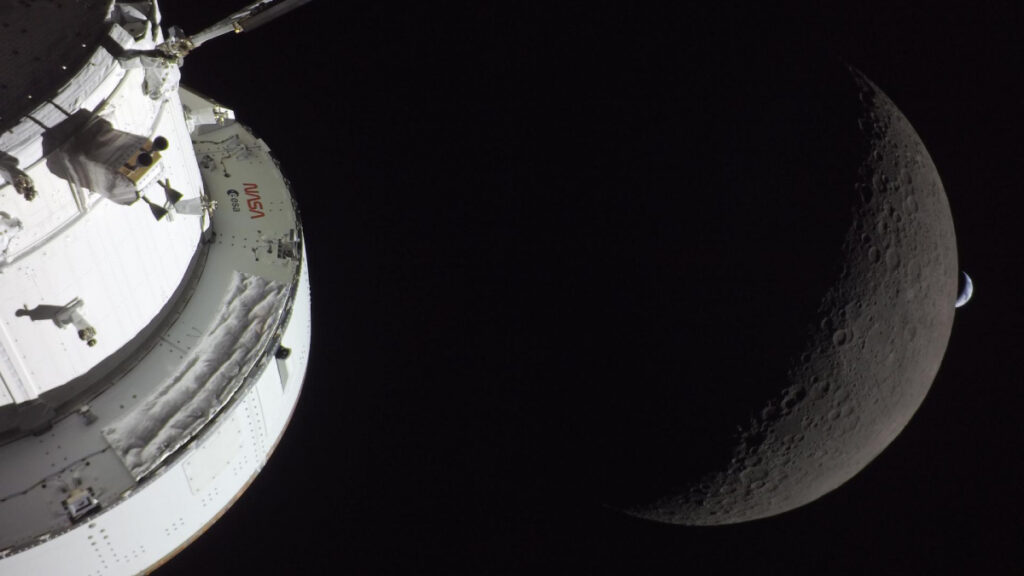
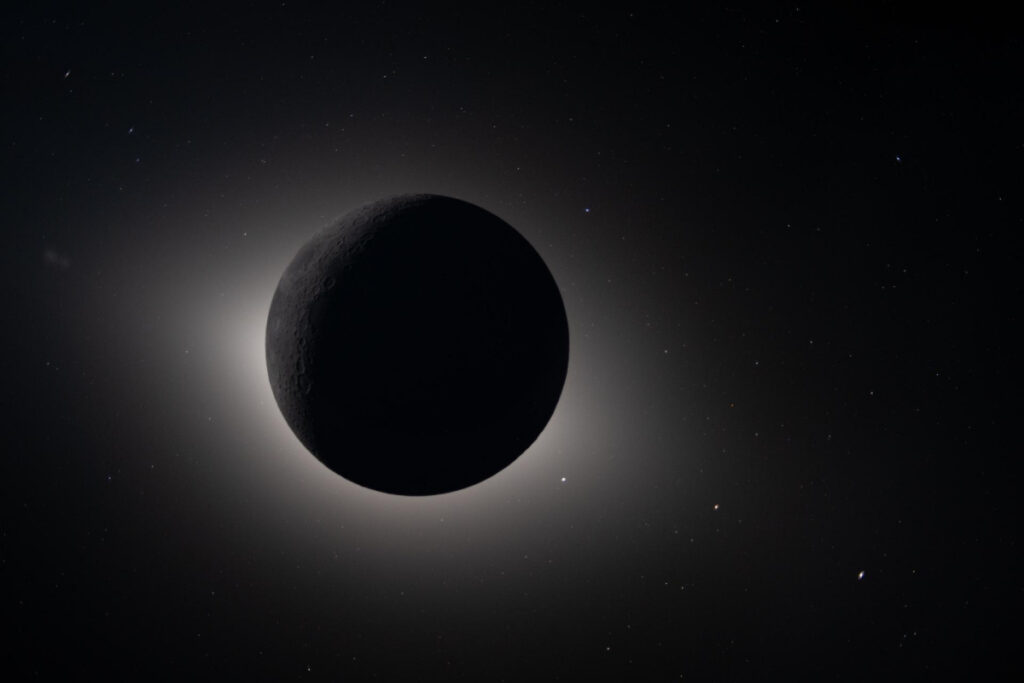
NASA’s Artemis II crew captured this image of the Moon eclipsing the Sun during their flyby of the Moon on 6 April 2026. Credit: NASA
NASA’s six existing mission directorates will be slimmed down to four. Exploration Systems Development and Space Operations will be combined into a new Human Spaceflight Mission Directorate and will facilitate human spaceflight in low-Earth and lunar space environments. Aeronautics Research and Space Technology will be folded into a new Research and Technology Mission Directorate, tasked with researching and developing nuclear power and propulsion. The structure of the Science Mission Directorate (SMD) and Mission Support Directorate remain unchanged at the time of publication. All directorate leaders will now report directly to the NASA Administrator (Isaacman) to ensure that each remains focused on their directorate’s new mission.
“There will be no reduction in force, no program cancellations, no closures, but we will achieve cost savings through more efficient execution and taking an active role in delivering the outcomes the world has been waiting for from NASA,” Isaacman said.
More Efficient?
At first glance, it is hard to see how combining four mission directorates into two, refocusing the missions of each, and pushing for increased efficiency and cost reduction will not result in some loss of talent either through positions being eliminated or individuals finding themselves in jobs they do not want to hold.
In a letter to NASA employees, Isaacman went into more detail about the specifics of this realignment and described how it will shift the agency’s internal bureaucratic authority away from directorates and toward NASA’s field centers. Prior to this, centers like Goddard Space Flight Center in Greenbelt, Md., and Johnson Space Center in Houston would need to compete for funding that had been appropriated to directorates based on the programs or missions they were tasked with.
A NASA source based in Houston told Ars Technica that the competition for funding “has been an absolute disaster.”
This new realignment “will adjust the funding distribution, so Centers have the financial support needed to sustain the baseline critical capabilities independent of near-term mission assignment,” Isaacman stated. “This shift will allow Center Directors to focus on maintaining the infrastructure, workforce, and capabilities required for current and future missions.”
Isaacman was unclear about when these changes will take effect, and policy analysts are unsure whether the realignment will be recognized by Congress through its appropriations process. The most recent Fiscal Year 2027 appropriations bill for NASA, which advanced out of the House Committee on Commerce, Justice, and Science on 13 May, allocates funding for six mission directorates, not four. The Senate appropriations committee is expected to release its proposed budget for NASA in the coming weeks, and the two bills must still undergo a lengthy reconciliation process.
In fiscal year 2026, Congress broke with the president’s budgetary priorities for NASA and passed a budget that ignored several of the administration’s proposed financial and mission cuts. Whether Congress will do the same this year and maintain the prior breakdown of directorates will become clear in the coming months.
These updates are made possible through information from the scientific community. Do you have a story about how changes in law or policy are affecting scientists or research? Send us a tip at eos@agu.org.
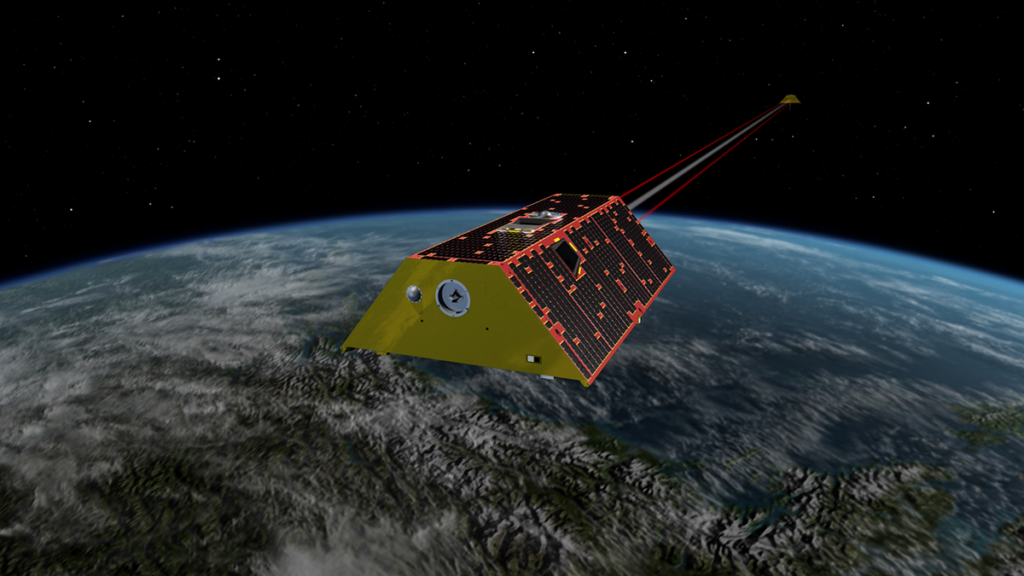
In low Earth orbit (typically below about 700 kilometers altitude), atmospheric drag is the primary source of uncertainty when predicting the trajectories of satellites. These prediction errors largely arise from limitations and inaccuracies in the models used to estimate the density of the upper atmosphere, particularly within the thermosphere.
Mutschler et al. [2026] introduce a new method for estimating atmospheric density along the path of an individual satellite by using Energy Dissipation Rates (EDRs). The derived single-satellite density measurements provide valuable insight into variations in thermospheric density and can help characterize how the upper atmosphere responds to disturbances such as geomagnetic storms. Incorporating these observations can contribute to ultimately improving the accuracy of satellite orbit predictions.
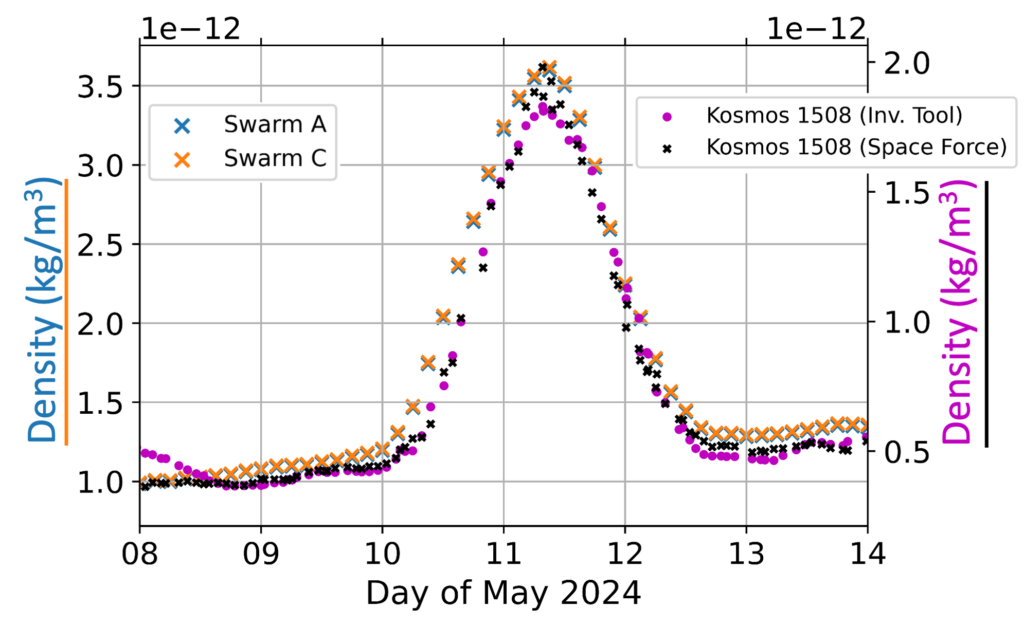
Effective density and Space Force effective density estimated by the Kosmos 1508 satellite (plotted on the right-hand y axes) compared to estimates from satellites Swarm-A and Swarm-C (plotted on the left-hand y-axes). Credit: Mutschler et al. [2026], Figure 17a
Citation: Mutschler, S., Pilinski, M., Zesta, E., Oliveira, D. M., Delano, K., Garcia-Sage, K., & Tobiska, W. K. (2026). First results of a new inversion tool for thermospheric neutral mass density computations during severe geomagnetic storms. AGU Advances, 7, e2025AV002079. https://doi.org/10.1029/2025AV002079
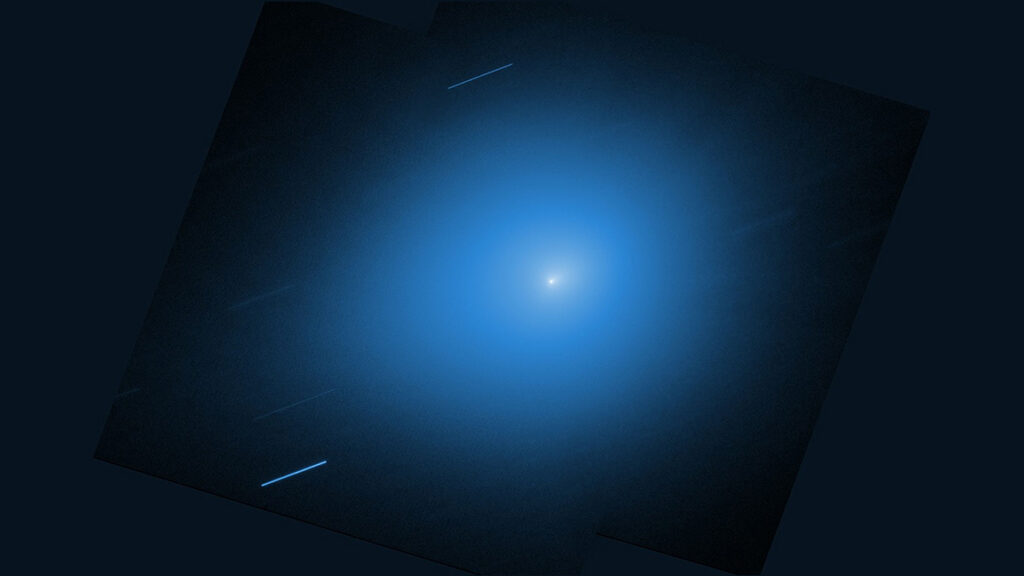
In late 2025, astronomers spotted an interstellar comet making a quick trip through the solar system. 3I/ATLAS was discovered in July when it was just inside Jupiter’s orbit. It’s now about halfway between Jupiter and Saturn and getting farther away every day.
The European Space Agency’s Jupiter Icy Moons Explorer (ESA JUICE) mission, on its way to Jupiter, imaged 3I/ATLAS on 5 November 2025 when the comet was 64 million kilometers from the spacecraft. Credit: ESA/Juice/JANUS, CC BY-SA 3.0 IGO
Astronomers have been observing 3I/ATLAS throughout its journey inward toward the Sun and back out again, compiling the most comprehensive and detailed view thus far of an interstellar object, including the chemistry of the gases that sublimated from its surface and formed its coma and tail.
In a first-of-its-kind observation of an interstellar object (ISO), researchers have discovered that the ratio of deuterium to hydrogen in 3I/ATLAS’s outgassed water is 30–40 times higher than in solar system objects. That suggests that the comet formed in a much colder environment than our own solar system did.
“It is always hard to really pinpoint where these objects form,” said Luis E. Salazar Manzano, the lead researcher on these observations and a doctoral student at the University of Michigan in Ann Arbor. “We know that they were formed in different parts of the galaxy, but it’s hard to connect what we measure with how they were formed. These types of measurements, such as the relative abundance of deuterium to hydrogen in water, are one of the best ways we have to actually [learn] about their forming conditions and their evolution.”
Coming In from the Cold
Water appears to be ubiquitous throughout the universe, sprinkled within distant galaxies and in star-forming nebulae. But there are different flavors of water: heavy, semiheavy, and plain old H2O. In the molecular clouds where stars form, the cold environment favors a chemical reaction that increases the amount of gaseous deuterium (D), an isotope of hydrogen, relative to regular hydrogen atoms. That deuterium then bonds with hydrogen and oxygen atoms to create semiheavy water, or HDO.
By measuring the quantity of semiheavy water relative to regular water in an object, scientists can infer the object’s ratio of deuterium to hydrogen, or D/H, and decode the physical conditions in which that water formed. Astronomers have made such measurements for baby stars, planet-forming disks, solar system comets, and meteorites, as well as Earth’s ocean.
“What is fundamentally important about ISOs is that they are physical leftovers of the process of forming another planetary system and they can give us clues to that process,” said Karen Meech, an astrobiologist at the University of Hawaiʻi at Mānoa who was not involved with this research.
“The conditions in the stellar system in which 3I/ATLAS formed may have been quite different from the one in the solar system.”
The team observed 3I/ATLAS with the Atacama Large Millimeter/submillimeter Array (ALMA) in Chile on November 2025 when the comet was 335 million kilometers (208 million miles) from Earth. It had just passed its closest approach to the Sun and was as bright as it was ever going to be. This timing was critical for the measurements the team wanted to make because the signal for HDO is very subtle, especially when it has to compete with the much more abundant H2O in the comet and within Earth’s atmosphere, Salazar Manzano explained.
Those measurements showed that for every 1,000 hydrogen atoms in 3I/ATLAS, there were about 5–7 deuterium atoms. While that’s not a lot, the ratio is still at least 40 times more than what’s found in ocean water and at least 30 times the average value in solar system comets.
“The conditions in the stellar system in which 3I/ATLAS formed may have been quite different from the one in the solar system,” said Paul Hartogh, a physicist and atmospheric science researcher at the Max Planck Institute for Solar System Research in Göttingen, Germany.
The first interstellar object, 1I/ʻOumuamua, did not outgas any material, and although the second object, 2I/Borisov, did, it was not bright enough to detect deuterium. 3I/ATLAS was the first opportunity astronomers had to measure the D/H ratio of an interstellar comet. Those measurements suggest that 3I/ATLAS formed in a much colder galactic environment than the solar system did, less than 30°C above absolute zero. The team published these results in Nature Astronomy in April.
Planning for the Next Interstellar Visitor
Hartogh, who was not involved with this research, said that on the one hand, 3I/ATLAS’s high deuterium enrichment is surprising because it is higher than that of any known comet. On the other hand, he added, some scientists predicted such high values for cometary water several decades ago.
Meech said she found these results “really interesting.” She never expected all other solar systems to have formed just like ours, and 3I/ATLAS fits with that idea.
“This gives us an intriguing look into the processes of planetary system formation—and that there are differences from our own solar system,” Meech said. “It is too early to tell what this implies for the formation of planets or habitable worlds. We are just at the beginning of an exciting story.”
“The fact that we were able to make this measurement with 3I will allow us to better prepare what to expect with the next generation of interstellar objects.”
3I/ATLAS is getting harder to see with telescopes, but astronomers still have a lot of data from when it was much brighter to go through, Salazar Manzano said. Teams around the world are working on creating a holistic picture of the comet’s chemistry and evolution.
What’s more, “the fact that we were able to make this measurement with 3I will allow us to better prepare what to expect with the next generation of interstellar objects,” Salazar Manzano said.
Scientists expect that the Vera C. Rubin Observatory could discover between 6 and 51 interstellar objects within the next 10 years. If objects are detected early enough in their journey through the solar system, “there may be enough time to coordinate observations with ground-based and spaceborne telescopes, taking advantage of the recent experience gained by the multiple 3I/ATLAS observations,” Hartogh said.
“These are rare opportunities to study another planetary nursery up close, and we have to take advantage of each new ISO to learn as much as we can,” Meech said. “It may be harder for a large number of individual teams to get all the data they want, so I think coordination and collaboration is needed more than ever.”
Citation: Cartier, K. M. S. (2026), Interstellar comet was born in a very cold place, Eos, 107, https://doi.org/10.1029/2026EO260141. Published on 7 May 2026.
Wind-driven waves on Earth move sediments and shape shorelines. They transport energy between the atmosphere and planetary surface and also mix bodies of liquid, affecting both chemistry and biology. On other worlds with surface liquids, either now or in the past, wind waves would likely perform the same function and so would play a key role in climate and astrobiological potential.
“They’re basically the interface between how the atmosphere communicates with the landscape, especially at the coast.”
New research went back to the fundamentals and explored the conditions that can generate waves on worlds with different physical properties and different liquids, such as Titan, Mars, and select exoplanets.
“Wind waves are really interesting phenomena,” said Una Schneck, a planetary science doctoral student at the Massachusetts Institute of Technology (MIT) in Cambridge. “They’re basically the interface between how the atmosphere communicates with the landscape, especially at the coast.”
The Physics of Waves
Past models of wind generation on other planets struggled because they tended to start from preexisting models of Earth waves. Those models were developed to describe waves in Earth’s specific combination of gravity, atmosphere, and surface liquid, namely, water, said Schneck, who led the new research. Such models were sometimes tailored to describe a particular location and season. Adapting those models for conditions on other worlds, including other liquids like methane and sulfuric acid, always seems to leave traces of Earth behind.
However, the physics of what creates wind-driven waves should be universal, Schneck said, so the team went back to the basics of wave generation. They developed a wave model that explores the relationship between a world’s bulk properties, like gravity and air density, and liquid properties, like surface tension, to determine the wind strength needed to produce a wave.
The team “created this model that went back to the basic physics of waves, instead of just trying to fit to known wave conditions,” said Taylor Perron, an MIT geomorphologist and planetary scientist and coauthor of the research.
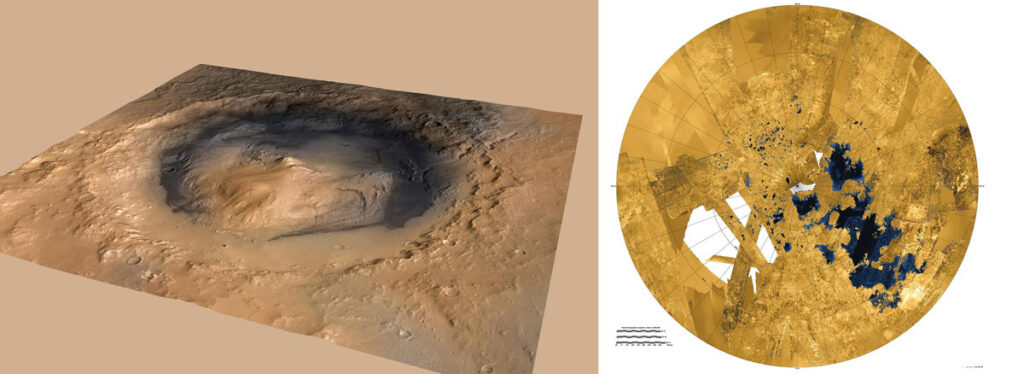
The Curiosity rover landed in Gale Crater on Mars (left) and has since found evidence—wavy bedforms—that this former crater lake had waves. Titan’s northern hemisphere hosts a sprawling lake district (right). The shores of one of the moon’s largest bodies of liquid, Ligeia Mare, shows evidence of wave activity. Credit: Left: NASA/JPL-Caltech/ESA/DLR/FU Berlin/MSSS; right: NASA/JPL-Caltech/ASI/USGS
The model showed that the threshold wind speed to generate a wave is lower for liquids with less surface tension, which makes it easier to change the liquid’s shape. Higher air density provides more force to push against a liquid’s surface, and lower gravity makes it easier for a wave to rise up—both factors allow a weaker wind to create a wave. The team published these results in the Journal of Geophysical Research: Planets in April.
Waves on Other Worlds
The team first tested their model on the only set of wind and wave data we have—Earth. They used 20 years of wave and weather data for Lake Superior. The model found, correctly, that it takes wind speeds of 2.2 meters per second to generate waves on the lake’s surface and accurately predicted the height of waves for different wind speeds.
They then used the model to predict wave conditions on other worlds. They started with Mars, which likely had ancient oceans and lakes. Winds of 1.2 meters per second would have created waves in the lake that filled Gale Crater millions of years ago. A wave in Gale Crater would have been taller than a wave on Earth produced by wind of the same strength owing to Mars’s lower gravity.
The story is similar on Titan, the largest moon of Saturn. Waves in Titan’s hydrocarbon lakes would swell with a mere 0.5 meter per second of wind and would rise higher than an Earth wave under similar wind conditions. But they would travel much more slowly than Earth waves and would be spaced farther apart.
“The paper represents our best theoretical understanding of how we expect for waves to behave in a variety of environments,” said Jason Barnes, a planetary scientist at the University of Idaho in Moscow who was not involved with this research. “The movie of Titan waves is particularly awesome—very slow moving for such large amplitudes! Although I don’t expect waves to get that high ever in Titan’s sluggish atmosphere, it’s fun to be able to visualize what they might look like if they did.”
“In theory, this is something that people could do.”
The team also explored wave-generating conditions on three Earth-sized exoplanets. The possible sulfuric acid lakes of the exo-Venus Kepler-1649 b would grow in winds of 5.3 meters per second but would grow to a height similar to that of Earth waves because of its Earth-like gravity. Water lakes on LHS 1140 b would grow in 2.7 meter winds, similar to those on Earth, but would not grow as high because of its higher gravity. And on 55 Cancri e, a lava world, it would take winds of 37 meters per second—a category 1 hurricane—to move tiny waves of molten rock.
“Would you be able to ever detect this? Is this a useful thing to think about, or is it just a fun thought experiment?” Schneck asked. “If the waves are tall enough, you should be able to detect a change in the polarization [of an exoplanet’s light curve] that would not only suggest that there is a liquid surface on that exoplanet, but that liquid surface has waves.…In theory, this is something that people could do.”
Will We See It? Not Soon
Right now, the only world known to have surface liquid other than Earth is Titan, but we don’t have the right observations of Titan to test the new model. The European Space Agency’s Huygens probe landed on the moon in 2005, but nowhere near the northern lake district. NASA’s Cassini mission (of which Huygens was a part) did not detect any waves but did observe a changing lake shore that hinted at wave activity.
It’s possible that Titan’s waves are seasonal and Cassini just didn’t have the right timing, Perron noted. Temperature changes during Saturn’s year could affect wind speeds and also the composition of Titan’s lakes, changing the conditions of wave generation.
Still, the wind speed needed to make a wave on Titan is so low that “it would be very surprising if waves never formed. It just may be difficult to catch them when they’re there,” he said.
“The best way to test this work would be to send a sea probe to float or motor on one of Titan’s big 3 seas.”
“The best way to test this work would be to send a sea probe to float or motor on one of Titan’s big 3 seas—Kraken Mare, Ligeia Mare, or Punga Mare,” Barnes said. “Such a ‘buoy’ probe would be able to simultaneously measure both the sea conditions and the wind conditions, allowing for a comprehensive test of the model.”
Alas, no such mission is in the works, and the upcoming Dragonfly mission won’t travel near any lakes to test this theory either. A future Titan orbiter might provide that information, while a current or future Mars rover might yet gather evidence showing how lakes worked in that planet’s past.
“The improved understanding of waves from this paper might help to constrain the possibilities for wave erosion at the margins of bodies of water…thereby helping us to probe into the past climates of Mars and Titan,” Barnes said.
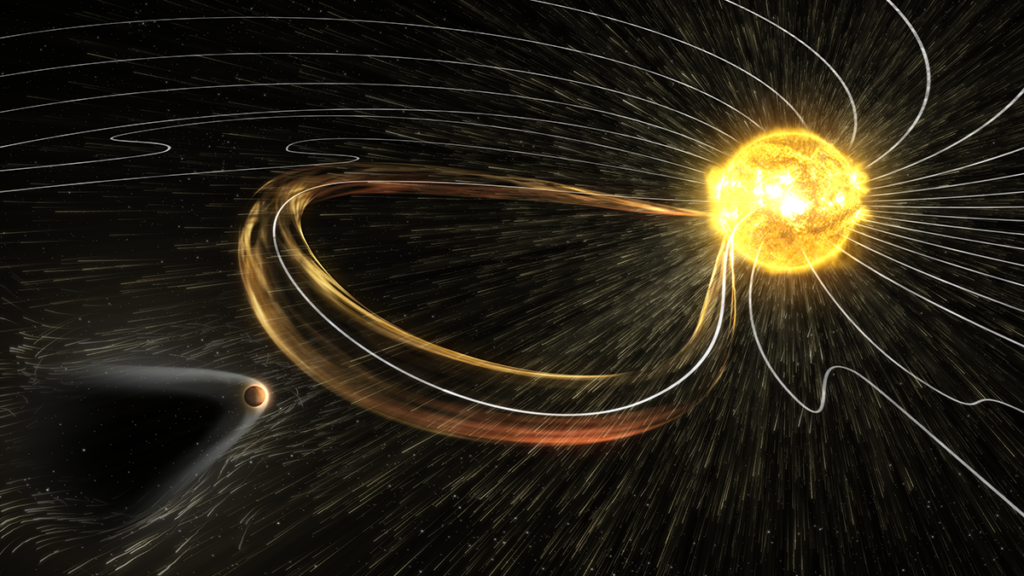
The Sun continuously blasts charged, magnetic field–carrying particles, or plasma, in all directions. This solar wind interacts with the magnetic fields and atmospheres of several of our solar system’s planets and other bodies, sculpting long magnetic tails of charged particles—magnetotails—that stretch into space behind them.
Magnetotails contain thin layers of electric current–carrying plasma sheets, which sometimes “flap” in an up-and-down waving motion. Spacecraft observations have revealed that flapping in Earth’s magnetotail can be driven by a process called magnetic reconnection, in which magnetic field lines rapidly break and then snap together in a new configuration, releasing stored energy. However, whether reconnection plays this same role beyond Earth has thus far been a mystery.
Wen et al. report the first evidence that magnetic reconnection may also trigger magnetotail flapping at Mars.
Unlike Earth, Mars lost its global magnetic field billions of years ago. But it still sports a magnetotail, thanks in large part to interactions between the solar wind and charged particles in its upper atmosphere. Strong magnetic fields embedded in certain patches of the Martian crust—remnants of its lost planet-wide field—also influence the magnetotail.
Until recently, Mars’s magnetotail could only be studied using observations from NASA’s Mars Atmosphere and Volatile Evolution (MAVEN) spacecraft. MAVEN showed that the Martian magnetotail is highly dynamic, with a structure that twists, shifts, and flaps—and from which charged particles may escape into space. But because MAVEN can observe only one part of the magnetotail at a time, it couldn’t identify what processes might trigger flapping.
Another spacecraft, China’s Tianwen-1 orbiter, has now provided a second set of eyes. The researchers analyzed simultaneous observations from the two spacecraft, finding that signatures of magnetic reconnection detected by MAVEN in the upstream part of the magnetotail tended to coincide with flapping events detected downstream by Tianwen-1.
Before or during flapping, the spacecraft also detected temporary, twisted plasma structures known as flux ropes. A similar link has previously been observed on Earth, and it suggests that flux ropes generated by magnetic reconnection upstream might propagate downstream, driving instabilities in the magnetotail’s plasma sheets and triggering flapping.
Though more research is needed to confirm these findings, they shed new light on how energy moves and is released in space around Mars—and possibly other planets and celestial objects. (AGU Advances, https://doi.org/10.1029/2026AV002343, 2026)
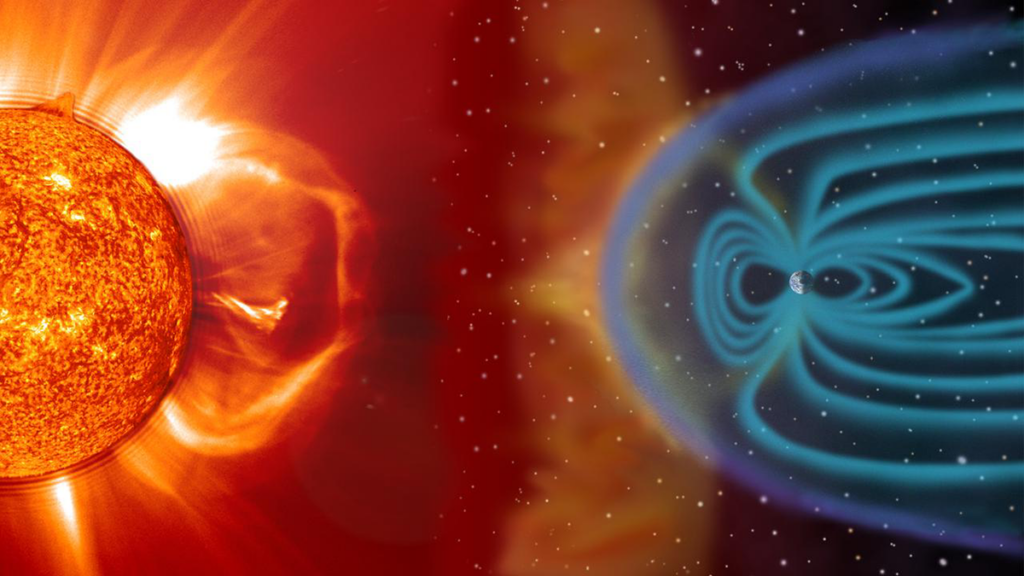
Solar eruptions can trigger geomagnetic storms that disrupt satellites, GPS, and power grids, affecting daily activities and technology. Therefore, it is extremely important to understand these storms in order to mitigate their impact. Previous studies mainly focused on interplanetary conditions.
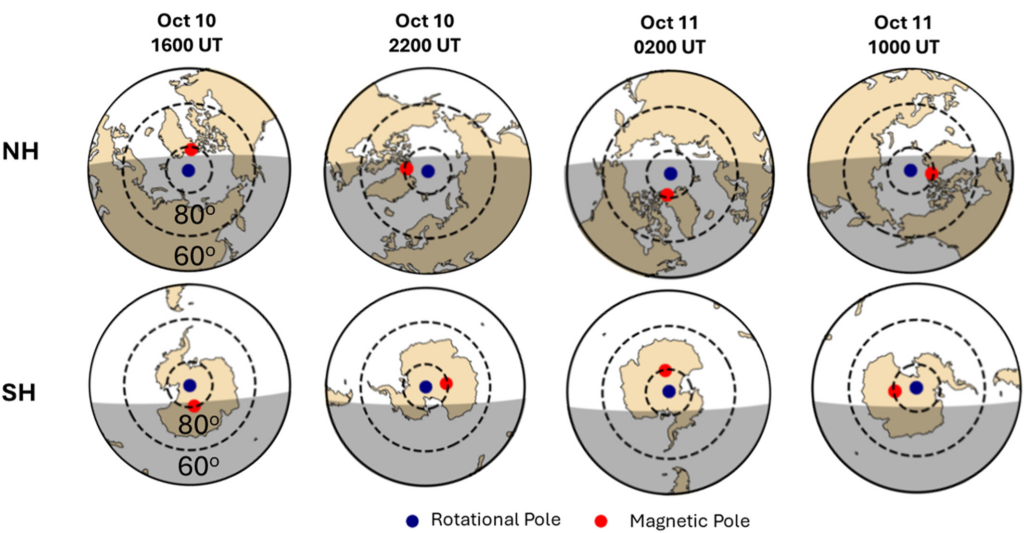
Ghag et al. [2026] investigate the interaction between solar ultraviolet light (EUV) during storms and the Earth magnetic field, taking into account its misalignment and offset with respect to the Earth’s rotational axis, which depend on time. Such misalignment and offset induce variations in EUV exposure in turn influencing the ionosphere and its interaction with the magnetosphere.
The study applies the Multiscale Atmosphere-Geospace Environment (MAGE), a physics based fully coupled whole geospace model. The causal relationship between storm timing and storm effect is explored revealing insights on our capability to predict storm impact based on the time dependent Earth system state.
The rotation of the magnetic pole around the rotational pole in the NH and SH. The location of the rotational pole is denoted in blue and the magnetic pole in red. Credit: Ghag et al. [2026], Figure 6c
Citation: Ghag, K., Lotko, W., Pham, K., Lin, D., Merkin, V., Raghav, A., & Wiltberger, M. (2026). Universal time influence on stormtime magnetosphere ionosphere coupling. AGU Advances, 7, e2025AV002071. https://doi.org/10.1029/2025AV002071
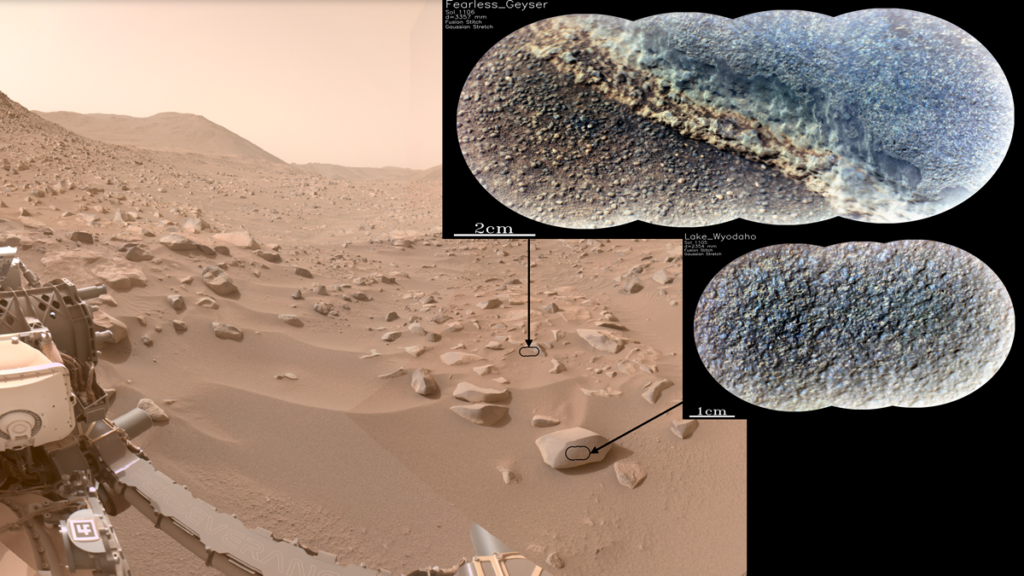
Orbital imaging has hinted that Mars may have carbon-containing rocks called carbonates on its surface. Carbonates on Mars could offer new insights into how water interacted with rock on the Red Planet, helping scientists learn more about its past. In addition, because carbonates on Earth are primarily produced by living organisms, these rocks are high-value targets in the search for signatures of past life on Mars.
NASA’s Perseverance rover has been traversing Mars since 2021, covering more than 41 kilometers, much of it within Jezero Crater in the Nili Fossae region. Previous orbital data indicated the crater contains carbonates, as well as abundant olivine, which can change to carbonate in the presence of water and carbon dioxide. Now Clavé et al. have analyzed spectroscopic data from Perseverance’s SuperCam instrument suite from multiple locations within Jezero Crater, providing clear evidence of carbonates on Mars, as well as detailed information on how the mineralogy varies between locations.
The authors confirmed the presence of both carbonates and olivine-bearing rocks throughout Jezero Crater and found a generally inverse relationship between the two minerals. By contrast, carbonates were generally positively correlated with the presence of hydrated silica. The researchers hypothesize that an ancient lake in the crater, along with potential hydrothermal activity, played a role in transforming olivine to carbonate. The varying amounts of carbonate and different alteration states seen today may have been caused by changing lake levels on Mars billions of years ago, the researchers suggest.
Amounts of carbonate by weight vary between locations, from 1%–3% in the Séítah unit to 6%–16% in the Eastern Margin Unit. Extrapolating to the entire regional olivine-rich unit, the researchers calculated it could contain as much as 1.1 × 10¹⁴ kilograms of carbon, or up to 0.4% of the current total mass of the Martian atmosphere. Overall, Mars’s crust could contain significant amounts of carbon, implying that widespread carbon sequestration may have cooled the planet significantly in the past. (Journal of Geophysical Research: Planets, https://doi.org/10.1029/2025JE009107, 2026)
Citation: Scharping, N. (2026), Carbon-rich rocks may have cooled the ancient Martian atmosphere, Eos, 107, https://doi.org/10.1029/2026EO260170. Published on 28 May 2026.
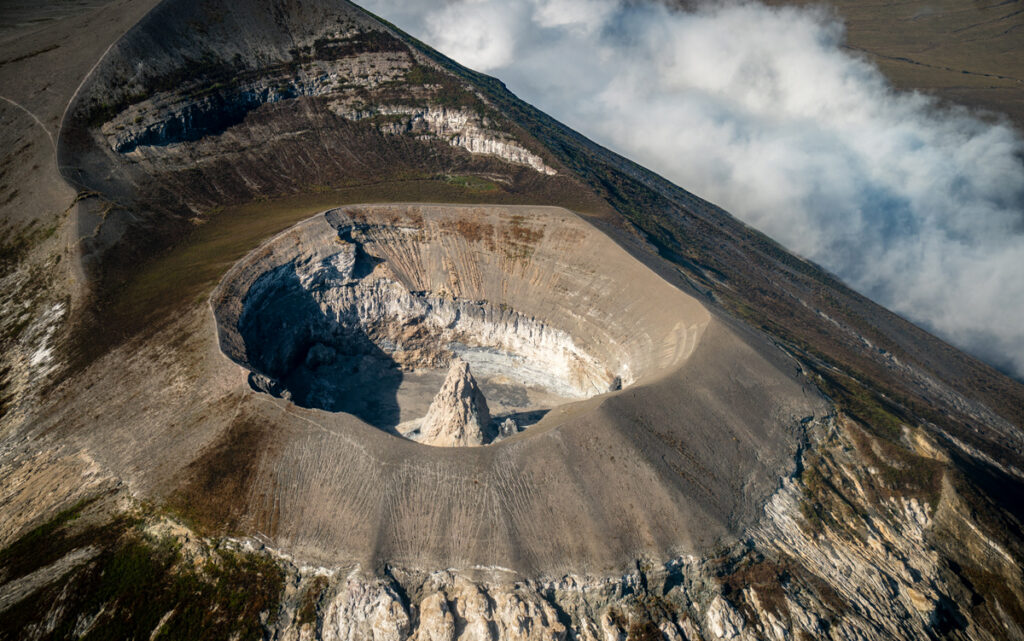
The volcano Ol Doinyo Lengai in Tanzania is unique on Earth: Its lava is rich in carbon compounds that melt at significantly lower temperatures than typical silicon-rich lavas from other terrestrial volcanoes.
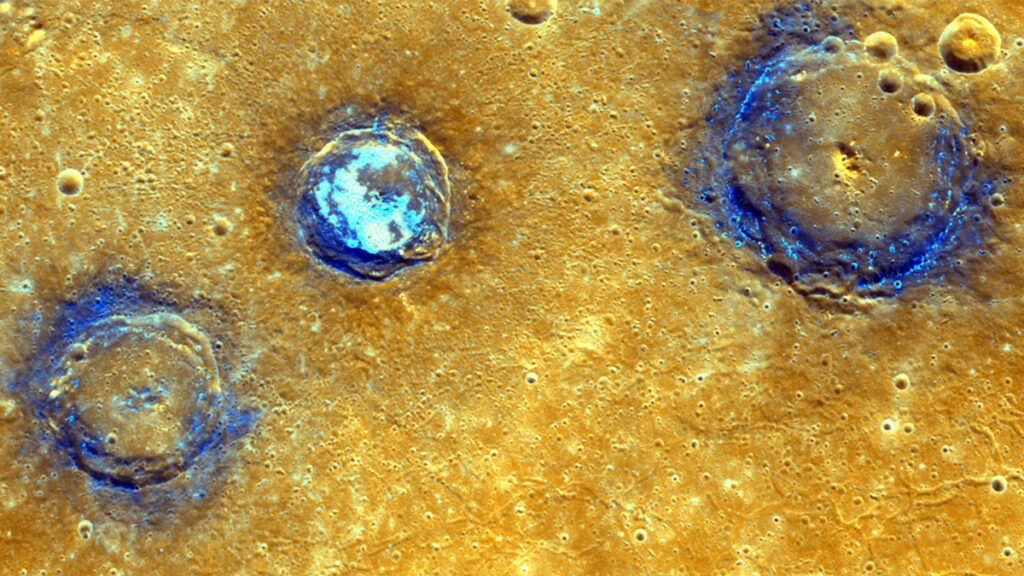
It is possible, however, that carbon volcanoes could exist elsewhere, including on exoplanets, or—as suggested in a recently published article in Icarus—perhaps even on planet Mercury.
Despite being known from antiquity, Mercury is very hard to study because of its closeness to the Sun. As a result, the best data so far were gathered within the past 20 years by NASA’s MESSENGER (Mercury Surface, Space Environment, Geochemistry, and Ranging) probe. In particular, scientists identified mysterious pits they dubbed “hollows” scattered across Mercury’s surface. The hollows’ relatively bright appearance indicates they were formed in recent geological times, and could even be still forming today. The origins and geochemical makeup of these hollows are unknown.
“Mercury looks like the Moon a little bit, so we don’t expect large volcanoes,” said Maximilian Paul Reitze, a planetologist at Universität Münster’s Institut für Planetologie who is first author of the Icarus study. Without volcanic conditions like those on Earth or even on Jupiter’s moon Io, researchers expect Mercury to be largely geologically dormant. In other words, to explain hollows, “we need some volcanism under the conditions we expect on Mercury,” Reitze said.
Hence the interest in Ol Doinyo Lengai, known as the Mountain of God to the Maasai and Sonjo peoples. This volcano produces lava made up of carbonatites, igneous rocks composed of more than half carbon (and which are known to host critical minerals). These lavas flow at temperatures roughly 100°C lower than Mercury’s blazingly hot daytime temperature of 424°C. If the planet has a carbon-rich subsurface, as Reitze and his collaborators proposed, then the hollows could be Mercury’s version of Ol Doinyo Lengai.
This theory, however, has its skeptics.
“We know that there is carbon in [Mercury’s] crust, but the amount is very low,” said Paul Byrne, a planetary scientist at Washington University in St. Louis, who was not involved in the Icarus study. He also pointed out that the surface regions where carbon is most concentrated don’t correspond to higher concentrations of hollows. “For this to be some kind of carbon-based lava, it would imply a lot more carbon than we might think, given how widespread the hollows are.”
The Making of a Weird Planet
Mercury’s proximity to the Sun means that NASA’s Mariner 10 spacecraft provided humanity’s first-ever views when it flew by in 1974 and 1975. Three decades later, the MESSENGER mission was the first probe to orbit Mercury, mapping the planet’s full surface and turning up unexpected features like the hollows. The BepiColombo mission, a joint project of the European Space Agency and the Japan Aerospace Exploration Agency, is only the third mission ever to visit the planet, so when its two spacecraft settle into orbit in November 2026, it will almost inevitably reveal something unexpected, because it’s a weird planet.
“Basically, Mercury is a molten ball bearing wrapped in a thin blanket of rock.”
Unlike Earth, Mars, or the Moon, Mercury has a freakishly large core and a thin mantle.
“Basically, Mercury is a molten ball bearing wrapped in a thin blanket of rock,” Byrne said. “One explanation is that early in the planet’s life, either one large or several smaller impacts stripped the outer portion away.”
The question then becomes what got vaporized, and what was left behind, particularly when trying to understand hollows. Many planetary researchers proposed that sulfides in the mantle could drive volcanism, but Reitze had doubts.
“The problem with sulfides I see is that they’re stable up to 1,000°C or so, which cannot explain the explosive volcanism that’s needed to form those hollows,” he said.
Instead, he and his coauthors contacted a colleague working on Ol Doinyo Lengai, who obtained a sample of the lava for laboratory study while it was still molten. Because carbonatite lava reacts chemically with Earth’s air very quickly, the researchers needed to isolate it to understand how the unaltered materials might behave under conditions on Mercury, particularly infrared spectra that could be confirmed by the BepiColombo mission.
In the hypothesis proposed by Reitze and colleagues, impacts from meteorites heat the carbon-rich magma below Mercury’s surface, melting it and driving eruptions. The hollows, which are found frequently on the slopes of Mercury’s craters or their central peaks, are the remains of those eruptions. Over time, further meteorite bombardments and intense solar radiation destroyed older hollows, which is why the ones in MESSENGER data were all formed within the past 270 million years—a short time ago, geologically speaking.
“Anytime people have been confident about anything in planetary science, [planets have] shown you wrong.”
“The carbonatite angle is an interesting one, and I certainly wouldn’t rule it out,” Byrne said. “Anytime people have been confident about anything in planetary science, [planets have] shown you wrong. I’m certainly open to it, but is it the only explanation for all of the hollows? I am skeptical of that.”
Byrne and Reitze both dream of a future Mercury lander, a very challenging and expensive proposition nobody expects will happen soon. In the meantime, they agreed that BepiColombo data will help settle the question of whether the most Mercury-like place on Earth is a volcano in Tanzania.
Citation: Francis, M. R. (2026), A unique African volcano could solve a mystery on Mercury, Eos, 107, https://doi.org/10.1029/2026EO260176. Published on 2 June 2026.


