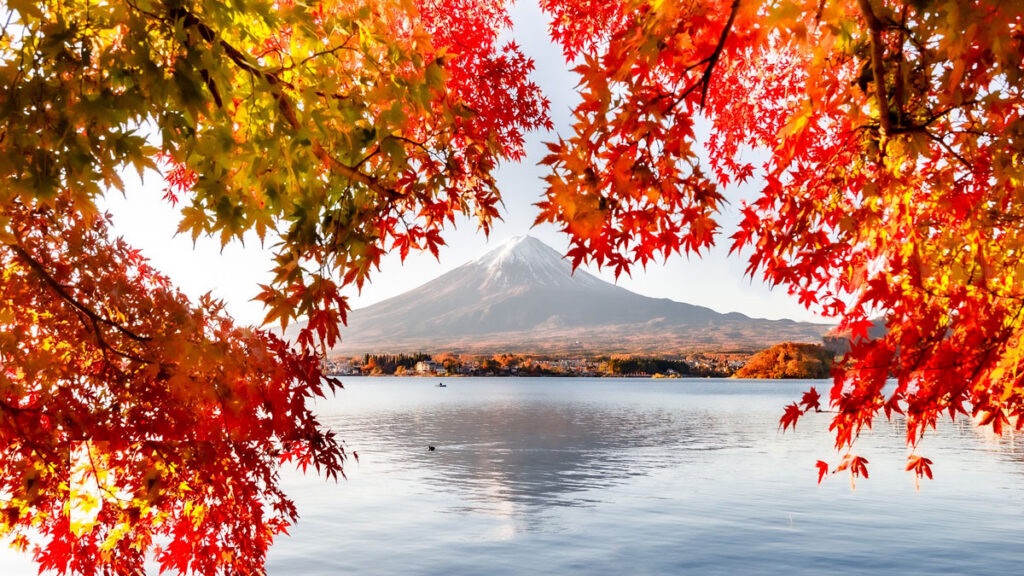
Heavy Rainfall Inflates Mount Fuji
Magma on the move can cause the ground around a volcano to heave in measurable ways. But surface deformation doesn’t always point to an impending eruption—new results show that the terrain around a volcano can also shift during episodes of heavy rainfall. Researchers studying Japan’s Mount Fuji spotted instances of centimeter-level ground deformation tied to intense precipitation. Fortunately, such events can be readily differentiated from deformation caused by magmatic activity, the team reported in Geology.
Keeping an Eye on Volcanoes
Volcanoes around the world, from Kīlauea in the United States to Calbuco in Chile, are outfitted with arrays of sensors. Mount Fuji is no exception—the region around the edifice is equipped with dozens of instruments to detect ground movement, infrasound, and other signs of potential volcanic unrest. All that monitoring is warranted: Shin-Fuji (“Younger Fuji”)—the youngest of Mount Fuji’s three overlapping volcanoes—is currently active.
Shuo Zheng, a hydrological geodesist at Hong Kong Polytechnic University in China, and his colleagues recently mined some of those Mount Fuji data. The team focused on Global Navigation Satellite System (GNSS) observations—otherwise known as GPS data—collected daily from 2017 to 2023.
Rain and Rise
Zheng and his collaborators found several instances in which the two GNSS stations located within 10 kilometers of the summit of Mount Fuji recorded clear signs of uplift. Those signals, reflecting changes of roughly 1–2 centimeters, far exceeded the sensors’ millimeter-level precision. And when the team correlated the timing of that uplift with rain gauge records, they found that the ground often tended to rise almost immediately during periods of heavy precipitation (defined as several tens of millimeters of rain falling per day).
“They can store and transmit groundwater, acting like aquifers.”
There’s likely a physical link behind that correlation, the researchers surmised. The explanation involves the so-called clinkers that cap each of Mount Fuji’s subterranean layers of lava. Clinkers are layers of small rocks that form when the surface of a lava flow rapidly cools, and these structures persist in the shallow subsurface of Mount Fuji. “They can store and transmit groundwater, acting like aquifers,” Zheng said.
When water fills up the pore space within a clinker, there’s no place for the overlying ground to go but up. It therefore makes sense that GNSS stations located atop old lava layers would exhibit uplift in response to intense rainfall, the team concluded.
When Zheng and his collaborators analyzed data from the nine GNSS stations located between 25 and 40 kilometers from the summit, however, they found that the ground actually tended to subside during periods of heavy precipitation. “There are two different responses,” said Kosuke Heki, a geophysicist and geodesist at Hokkaido University in Japan and a member of the research team. That subsidence is a known effect, and it’s been observed in a variety of locales. The subsidence doesn’t dominate closer to the summit of Mount Fuji because of the presence of the clinker layers there, the team reasoned.
Long-Lasting Magma
“Uplift by rain easily terminates when it stops raining.”
The uplift that the team recorded close to the summit of Mount Fuji tended to last just a day or two; it disappeared when the rainfall ceased. That timing is key for differentiating precipitation-induced uplift from magma-induced uplift. “Uplift by rain easily terminates when it stops raining,” said Heki. “But magma has a much longer timescale. It continues for weeks or months.”
That difference is critical, said Luca Caricchi, a volcanologist at the Université de Genève who was not involved in the research. There’s long been the mindset that ground deformation means that an eruption is imminent, but these new findings show that a heaving volcano doesn’t always mean that magma is on the move, said Caricchi. If the deformation is short-lived, the explanation might just be precipitation, he said. “You don’t need to worry.”
Zheng and his colleagues have looked for a similar effect for other volcanoes in Japan. They didn’t find any conclusive trends when they analyzed a chain of island volcanoes south of Tokyo, however. Perhaps that’s because the clinker layers beneath those edifices are so close to the sea that water efficiently drains out of them, the team hypothesized.
—Katherine Kornei (@KatherineKornei), Science Writer