Sunset Magazine 1983-05 286
1 June 2026 at 00:38


The critical zone (CZ) refers to the layer of Earth extending from the bedrock up to the vegetation canopy, including interconnected systems such as river and floodplain corridors, the active soil and root zone, and the near-surface environment where plants interact with the atmosphere. The conservation of the CZ requires a detailed understanding of how it evolves under anthropogenic impacts, such as intensive agriculture.
Goodwell et al. [2026] use a data driven approach to relate shifts in the critical zone to indicators of human impact. Their findings deliver innovative knowledge on transitions, drivers, and predictability in many contexts, and support better prediction and management of the critical zone under environmental change.
In particular, the authors find evidence of abrupt shifts in the variability of key features like stream and soil chemistry, land-atmosphere interaction and so forth, which can be attributed to intensive management, for instance due to mechanized planting and harvesting. These human-impacted and naturally appearing regimes in the dynamics of critical zone have implications for understanding processes and making predictions of the status of the critical zone under environmental change.
Citation: Goodwell, A. E., Saccardi, B., Dere, A., Druhan, J., Wang, J., Welp, L. R., et al. (2026). Detecting regimes of critical zone processes, drivers and predictability with a data-driven framework. AGU Advances, 7, e2025AV002098. https://doi.org/10.1029/2025AV002098
—Alberto Montanari, Editor-in-Chief, AGU Advances
A hole in the Montreal Protocol could delay the recovery of Earth’s ozone layer by about 7 years. New research found that the use of ozone-depleting substances used as feedstocks—chemicals used in the making of other chemicals—has not waned over time. In fact, their use has increased since the treaty’s adoption in 1987.
“The Montreal Protocol is such a success story that these ozone-harming sources are becoming relevant. A few decades ago, they were drowned out.”
“The Montreal Protocol is such a success story that these ozone-harming sources are becoming relevant. A few decades ago, they were drowned out,” said Luke Western, who researches greenhouse gases and ozone-depleting substances at the Massachusetts Institute of Technology. Western is a coauthor of a new study on the findings published in Nature Communications.
Almost 40 years ago, the Montreal Protocol banned the production and consumption of almost 100 long-lived gases that harm Earth’s ozone layer, such as chlorofluorocarbons (CFCs) and hydrochlorofluorocarbons (HCFCs), then largely used as coolants in refrigerators and air conditioners. These uses were the primary problem that needed to be solved and were the Montreal Protocol’s main target, Western explained.
However, ozone-depleting substances used in the production of other chemicals—including CFCs themselves—had so little impact at the time that they were not included in the ban. Only about 0.5% of feedstock chemicals, such as carbon tetrachloride (used in the making of some CFCs and a by-product of the manufacture of plastics like polyvinyl chloride, or PVC), were emitted into the atmosphere. With the production and use of the most prevalent ozone-harming gases banned, scientists thought the use of feedstocks such as carbon tetrachloride would die out over time.
However, not only did the die-out not happen, but the use of ozone-depleting substances as feedstock actually increased by 163% between 2000 and 2024. Western and his team found that associated emissions increased as well: Now, about 3.6% of these ozone-depleting feedstock chemicals are leaking into the atmosphere. The increase comes partly from their use in producing the non-ozone-depleting gases that replaced HCFCs and CFCs after the Montreal Protocol went into force.
“It’s almost the same as charging your electric car with fossil fuel–based energy.”
“This is quite ironic,” Western said. “It’s almost the same as charging your electric car with fossil fuel–based energy.”
If maintained at current levels, these emissions could delay full recovery of Earth’s ozone layer by anywhere from 6 to 11 years. Currently, recovery to 1980 levels is expected by 2040 for most of the world, by 2045 over the Arctic, and by 2066 over Antarctica, according to the World Meteorological Organization.
To estimate feedstock emissions, the researchers used datasets from the Advanced Global Atmospheric Gases Experiment (AGAGE) and NOAA containing information on about 50 chemicals from 1978 to 2023. The team used these data to model feedstock production and consumption between 2025 and 2034 and then between 2035 and 2100 for business-as-usual and low-emission scenarios.
When measured from now until the end of this century, feedstock emissions in the models tended to stabilize, but the real problem could be in the short and medium terms, the study suggested. Under a business-as-usual scenario, the production of some chemicals, such as methyl chloroform (used in solvents and found in household cleaners), is projected to decrease by 6% per year until 2050. But others, such as halon 1301 (used in the making of insecticides and pharmaceuticals), are set to increase (in halon 1301’s case, by 4% a year until 2050). With the estimates at hand, the team modeled feedstock emissions and their potential effect on the ozone layer.
“This is a very important study because it addresses several questions that remained open not just in the Montreal Protocol, but in research on the ozone layer recovery in general,” said Marco Aurélio Franco, an atmospheric sciences researcher at the University of São Paulo in Brazil.
Franco, who did not take part in the study, said research like this is fundamental to improving estimates for atmospheric chemistry and physics models. After all, some feedstock chemicals, including carbon tetrachloride—whose production is set to increase by 4% a year through 2034—are also greenhouse gases.
Carbon tetrachloride, Franco pointed out, acts differently depending on where it is in the atmosphere. In the troposphere, Earth’s lowest atmospheric layer, the substance traps heat by reflecting infrared radiation back to Earth. At this level, carbon tetrachloride is still stable. But any amount of the substance that reaches the atmosphere’s next layer, the stratosphere, wreaks havoc on the ozone layer. “Ultraviolet radiation is able to break carbon tetrachloride, liberating chlorine,” Franco said. “Chlorine then breaks ozone molecules in a chain reaction. It’s the same mechanism as CFCs.”
The world, said Franco, needs to walk the last mile in refraining from producing and using ozone-depleting substances as feedstock, as we still need to understand their long-term effects. “These [feedstock emission] estimates could be appended to the Montreal Protocol, which proved to be a great success. We need to incorporate them into emission reports and atmospheric models. These emissions should not be neglected,” he said.
—Meghie Rodrigues (@meghier.bsky.social), Science Writer
Ensuring the sustainability of water resources and ecosystems in a changing world requires a thorough understanding of how water moves through Earth’s Critical Zone, a dynamic interface where air, water, soil, plants, and rocks interact. Researchers can track and model this movement of water using naturally occurring markers or “tracers.”
A recent article in Reviews of Geophysics explores the latest advancements in tracer-aided mixing models and how they can help us to better understand the Critical Zone. Here, we asked the authors to give an overview of the Critical Zone, how tracer-aided mixing modeling works, and future directions for research.
What is the Critical Zone (CZ)?
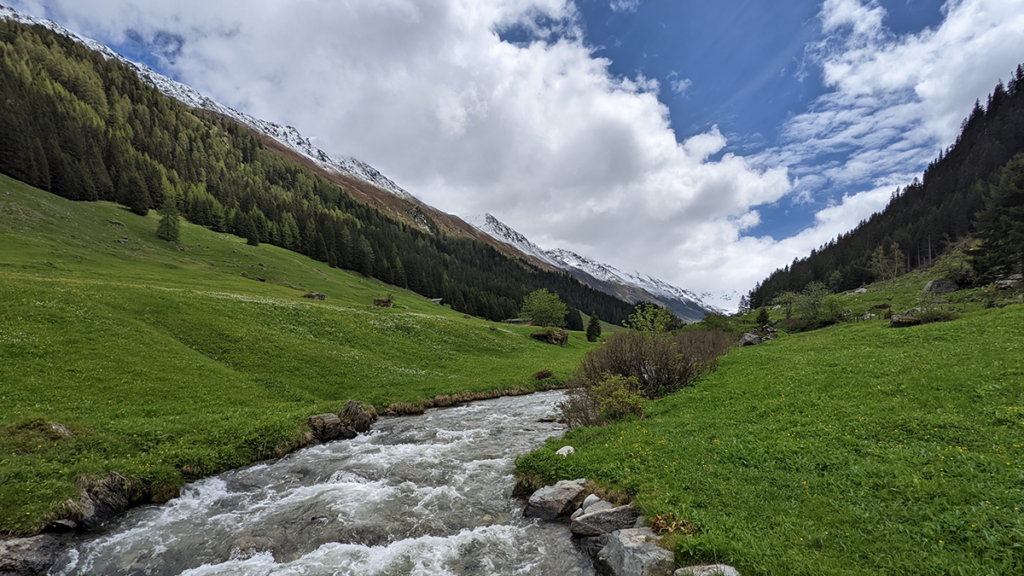
The Critical Zone is Earth’s “living skin”—the dynamic layer where the atmosphere, hydrosphere, biosphere, and lithosphere interact. It stretches from the top of the vegetation canopy and, in cold regions, from the surface of snowpacks and glaciers, down through soils and into the deeper aquifers. It encompasses lakes, streams, and wetlands at the surface, and extends beyond the soil layer to underlying groundwater aquifers. It is where rainfall, snowmelt and glacier melt become soil moisture, where plants take up water and return it to the atmosphere, where aquifers get recharged, and where streamflow is generated. In short, the Critical Zone is where most processes that sustain terrestrial life and freshwater resources unfold.
Why is it important to understand how water moves through the Critical Zone?
Virtually every freshwater resource we rely on (e.g., drinking water, irrigation) passes through the Critical Zone.
Virtually every freshwater resource we rely on (e.g., drinking water, irrigation) passes through the Critical Zone at some point. Global warming, land-use changes, and intensifying water demand emerging from rapid urbanization and changes in agriculture are reshaping how water is stored and released within the Critical Zone, often in ways we cannot yet predict. Understanding how much water is stored within the Critical Zone, how this water is both recharged from rainfall and snowmelt and eventually discharged into streams, and the timescale of these dynamic processes is essential for protecting ecosystems, safeguarding water supplies, and adapting to a changing climate.
How would you explain a tracer-aided mixing model to a non-specialist?
Imagine mixing a glass of orange juice with a glass of apple juice, and trying afterwards to work out how much of each went into the glass. If the juices had distinctive “fingerprints” (imagine its color, sugar content, or a specific chemical) and these fingerprints primarily changed because of the mixing of these two juices, you can then measure the fingerprint in the final mixture and back-calculate the proportion of its distinct sources.
Tracer-aided mixing models work in a similar way but can track the entire water cycle. Different water sources (e.g., rainfall, snowmelt, glacier melt, soil water, groundwater) can have distinct “fingerprints” in a naturally occurring tracer, such as stable isotopes of water or specific dissolved elements. By measuring these fingerprints in the streamwater or groundwater and in its potential sources for example, hydrologists can estimate how much each source contributed to the streamwater or groundwater.
What are some of the most significant and exciting recent advances in tracer-aided mixing models?
Classical mixing models relied on demanding assumptions: that all water sources can be identified and sampled, and that their signatures were distinct and constant in time. Much of the recent progress has been about relaxing these assumptions.
Bayesian approaches now estimate full probability distributions and provide a more realistic picture of uncertainty. Methods like Convex Hull End-Member Mixing Analysis (CHEMMA) use machine learning to infer the distinct sources directly from data, while ensemble hydrograph separation exploits tracer fluctuations over time, thereby making un-mixing feasible even when multiple sources have overlapping signatures. Perhaps the most conceptually novel advance is end-member splitting, which flips the question from “where does streamflow come from?” to “where does precipitation go?”
Alongside these modeling advances, there have been immense advances in how tracers are measured. Portable laser and mass spectrometers now enable high-frequency, in-situ tracer measurements which allows us to capture critical hydrological events such as storms and snowmelt in near-real time.
What are stable water isotope tracers and what are their advantages?
Stable water isotopes are naturally occurring non-radioactive atoms of hydrogen and oxygen that make up a water molecule but have slightly different molecular masses. The two stable isotopes widely used in hydrology are 2H (deuterium) and 18O (oxygen-18). Because these isotopes are part of the water molecule itself, they directly travel with the water molecule. Their key advantages are: (1) they are conservative, meaning they do not react chemically as water moves through soils and aquifers, and (2) they carry distinct signatures resulting from climatic variables such as air temperature.
These properties make stable water isotopes the most versatile and widely used tracer in Critical Zone hydrology.
Consequently, in the European Alps, winter precipitation has a different isotopic signature than summer precipitation because winters are cooler than summers. Other hydrological processes such as evaporation and sublimation leave a recognizable fingerprint on the remaining water, thereby allowing us to estimate how much evaporation or sublimation occurred. Stable water isotopes can be measured in essentially every water compartment, from atmospheric vapor and precipitation to snowpack, plant xylem, soil water, streams, and groundwater. Together, these properties make stable water isotopes the most versatile and widely used tracer in Critical Zone hydrology.
What are the current limitations of tracer-aided mixing models?
Despite their power, mixing models still face many constraints. End-member signatures vary in space and time, are sometimes too similar to distinguish, and some sources may be overlooked entirely. Non-conservative tracers such as nitrate or sulfate can react with their environment along their journey, thereby biasing results if these reactions are not explicitly accounted for.
Sampling is another major bottleneck. Capturing the spatial heterogeneity of soils, snowpacks, and groundwater requires a lot of measurements that are often logistically or financially prohibitive, especially in remote regions. Many of the newer, more powerful tracers such as noble gases or stable isotopes of trace elements, can only be analyzed by a handful of specialized laboratories. As a result, global coverage remains highly uneven, with key regions such as the Arctic and the global South still under-sampled.
What are some of the major unsolved questions and where is more research needed?
There are several fronts where more research is needed. Source signatures are not static, and methods that explicitly capture their variability in time are still underdeveloped. Embedding tracers within global Earth System Models would, in theory, enable more accurate assessment of hydrological partitioning e.g., how rainfall, snowmelt, and glacier melt are split between sublimation, evapotranspiration, groundwater, and streamflow. These will directly inform more robust climate projections, but this remains technically demanding.
Expanding data coverage in under-sampled regions is critical, and citizen science and low-cost sensors may help. Machine learning is a promising approach for uncovering non-linear relationships and gap-filling sparse datasets, but requires training data that often do not yet exist. Greater interdisciplinary integration, e.g., combining tracers with remote sensing, ecological indicators, and biogeochemical data, could yield a more holistic view of the Critical Zone. Finally, the field would benefit from shared protocols and open data practices to enhance progress.
—Andrea L. Popp (andrea.popp@smhi.se; ![]() 0000-0003-3911-8105), Swedish Meteorological and Hydrological Institute, Sweden; Harsh Beria (hberia@ethz.ch;
0000-0003-3911-8105), Swedish Meteorological and Hydrological Institute, Sweden; Harsh Beria (hberia@ethz.ch; ![]() 0000-0003-2597-9449), ETH Zurich, Switzerland
0000-0003-2597-9449), ETH Zurich, Switzerland
Editor’s Note: It is the policy of AGU Publications to invite the authors of articles published in Reviews of Geophysics to write a summary for Eos Editors’ Vox.

A couple years ago, in the middle of April, I was on a controlled burn in Nebraska—watching grass that should have been green – burn like it was August. The wind was steady. And somewhere beyond the tree line, a few scattered homes had no idea how close they could have been to a bad day if we hadn’t kept it fully contained—which the bosses did with proper planning and some safe soss® lines to control perimeter and protect valuable assets like power poles and pump sheds.
Most people associate wildfire with late summer and fall, when dramatic footage airs and catastrophic fire names get burned into public memory. But the fire season in large parts of the American West no longer has clean edges. Warm, dry springs have made March through May legitimate risk months across California, Nevada, Arizona, and the intermountain West.
If you live in a fire-prone area and haven’t thought about your home since last October, spring is the right time to fix that, while you still have the time to do it without pressure.
There’s a persistent image of wildfire that shapes how people prepare (or don’t). Walls of flame advancing on a neighborhood, a fire you can see coming in time to act. The reality of how homes actually ignite is far less cinematic and far more preventable.
Research from the Insurance Institute for Business & Home Safety consistently identifies wind-borne embers, firebrands carried well ahead of the fire front, as a dominant cause of residential structure loss in wildfires. I’ve watched embers travel far from direct flames – igniting structures long before the fire front arrives.
By the time an engine reaches the street, the house is already going. Reduce the places where an ember can land and find something to burn, that’s what wildfire preparedness actually means.
Zone 0, the zero to five feet immediately surrounding your structure, is the most underestimated area in home hardening, and it’s almost entirely within a homeowner’s control.
Combustible mulch against the foundation, firewood stacked against an exterior wall, a wooden fence attached directly to the house, debris under a deck: any of these can take a single ember and produce a structure fire while the wildfire is still far away.
Replacing organic mulch with gravel in the immediate perimeter, clearing debris from under decks, and breaking the fence-to-wall connection are weekend tasks, not contractor projects. Real protective value, reasonable effort.
Older homes were not always designed with wildfire in mind. Attic vents, foundation vents, and eave gaps that allow normal airflow also function as ember entry points. Embers can get in, find accumulated dust or insulation, and the structure starts burning from the inside before anyone realizes what’s happening.
Ember-resistant vent covers represent some of the highest-value, lowest-cost improvements an existing home can make. High-heat tape designed for door frames and thresholds can seal those gaps temporarily before a fire event and be removed cleanly afterward, making it a practical option for homeowners who want protection without permanent modification.
A walkthrough of your home’s exterior, looking for gaps that open into wall cavities, attics, or crawl spaces, will tell you where the real priorities are.
Defensible space gets treated as a one-time project when it’s actually seasonal maintenance. Zone 1 (5 to 30 feet from your home) and Zone 2 (30 to 100 feet) require thinning, spacing, and clearing of dead vegetation well before fire weather arrives.
Grasses that green up in March cure out across much of the West by May. Storm debris, overgrown plantings against the structure, and dead annual grasses need to come out before they become kindling fuel to your structures.
Everything above matters more if you leave when the time comes. The most dangerous thing I see on firelines is people staying to defend property when they should be gone. A home can be rebuilt. You cannot.
READY, SET, GO describes three phases of wildfire response:
Preparation doesn’t guarantee your home survives. What it does is reduce the ways embers can ignite it, slow how fast those ignitions develop, and make your property a better candidate for defense when suppression resources are stretched thin.
Zone 0 cleanup, vent protection, vegetation management, and a family evacuation plan cover most of the meaningful ground. No contractor required, no large budget needed.
April is not too early. For a lot of communities, it can mean just in time.
Nicholai Allen is a wildland firefighter and the founder of SAFE SOSS®, which makes patent-pending ember defense products available at Lowe’s. He continues to respond to wildfires as a federal resource when called.
The post Guest Idea: April Is Already Fire Season. Is Your Home Ready? appeared first on Earth911.
![]()
![]()

![]()

![]()
SINGAPORE/MALAYSIA: As the Johor Bahru-Singapore Rapid Transit System (RTS) Link nears its January 2027 launch, attention is shifting from the train itself to another question: how will passengers get around once they arrive in Johor Bahru?
The uncertainty surrounding Johor’s planned feeder rail network has raised growing concerns among transport experts, commuters and politicians. Many fear that without a reliable connection beyond Bukit Chagar station, traffic congestion could simply move from the Causeway to Johor Bahru’s streets.
The debate centres on the RM10 billion (S$3 billion) elevated transit project approved by Malaysia’s Cabinet. The project was originally presented as an Autonomous Rapid Transit (ART) system, a trackless tram-like network designed to connect key parts of southern Johor.
However, according to a June 8 report by Channel NewsAsia (CNA), the winning proposal may instead use a Light Rail Transit (LRT)-style automated people mover system, which has created confusion about the project’s final direction.
The lack of clarity has become a talking point among transport specialists. Urban planning expert Samuel Tan questioned whether all bidders were evaluated on the same basis if the project specifications had changed during the process. Others have also raised concerns about transparency and whether competing proposals were assessed fairly.
Transport consultant Rosli Azad Khan said that reports suggesting a shift from ART to a rail-based system represent a major change from the project’s original scope. He argued that authorities should clearly explain how decisions were made and whether the final design meets Johor Bahru’s long-term transport needs.
The Malaysian Transport Ministry and Prime Minister’s Department didn’t respond to CNA’s questions on whether the project will ultimately proceed as an ART or LRT system.
The RTS Link itself is expected to be a major improvement for cross-border travel, carrying up to 10,000 passengers per hour in each direction between Johor Bahru and Singapore. Yet experts say the train is only one part of the journey.
Many Johoreans live in areas such as Tebrau, Skudai, and Pasir Gudang. Without efficient feeder transport, commuters could face long waits, packed buses, or traffic jams after leaving the station.
Analysts warned that adding more buses may provide temporary relief but is unlikely to solve bigger transport issues. Buses would still have to navigate some of Johor Bahru’s busiest roads, where congestion is already common.
Transport analyst Nasser Ismail described the challenge as a “last-mile connectivity” problem. While the main rail link may be ready, connections to residential areas remain limited.
The issue has also become politically sensitive. Johor’s state assembly was dissolved on June 1, setting the stage for elections within 60 days. Analysts believe transport infrastructure, alongside cost-of-living concerns, could become a major campaign issue.
For many residents, the concern is practical rather than political. Some commuters already struggle to find parking near border transport hubs and worry that passenger numbers will rise sharply once the RTS Link opens.
The discussion goes beyond trains and traffic. It raises another question of whether infrastructure planning can keep pace with the growing economic ties between Johor and Singapore, especially as the Johor-Singapore Special Economic Zone (JS-SEZ) is expected to increase cross-border movement.
The RTS Link promises a faster, more comfortable border crossing; few people would dispute that, but the real test begins after passengers step off the train.
If commuters can quickly reach their homes, workplaces and towns, the project could transform daily travel. If not, Johor Bahru may find itself dealing with a new version of an old problem, and we certainly don’t want that.
As election season approaches, many residents seem to be looking for a clear plan, a realistic timeline and transport links that work beyond the station.
This article (Johor Bahru rail plans raise fear of worsening traffic congestion ahead of JB-SG RTS Link launch due to confusion over ART-LRT plans) first appeared on The Independent Singapore News.

The space industry is surging. In coming years, nearly 10,000 spacecraft are slated to launch into low-Earth orbit for a variety of purposes, such as global surveillance, space tourism, and satellite “megaconstellations” providing internet service.
Rocket engine exhaust, as well as the burnup of inactive satellites and rocket parts reentering Earth’s atmosphere, releases a suite of pollutants. These chemicals have long been considered to pose little threat to our climate, given the historically small size of the space industry. Now, the sector’s rapid growth will send its emissions skyrocketing—but scientists don’t yet have a clear picture of the environmental ramifications.
An analysis by Vliex et al. of rockets launched in 2022 revealed that spaceflight depletes the ozone layer and contributes to global warming, with a significant portion of this ozone loss attributable to nitrogen oxide emissions released by objects reentering Earth’s atmosphere.
The researchers calculated emissions from all 186 rockets launched in 2022, as well as all 472 objects—with a combined total mass of nearly 5,000 tons—that reentered the atmosphere that year. They conducted computational simulations of each launch’s trajectory and emissions at various altitudes up to 100 kilometers, and they calculated emissions released by object reentry. They also accounted for the effects of chemical reactions that occur in rocket exhaust plumes, which alter emissions’ chemical composition.
Incorporation of the calculated emissions into GEOS-Chem, a computational model of atmospheric chemistry, revealed their ozone-depleting and Earth-warming effects, with reentry emissions identified as playing a key role in ozone depletion. The researchers found that accounting for plume reactions reduced the estimated effects of spaceflight emissions, highlighting the value of considering plume chemistry in future assessments.
The analysis also underscored the varying effects of different rocket fuel types. Solid-state fuels, used recently in rocket boosters for NASA’s Artemis II mission to return astronauts to the Moon, appeared to cause the greatest amount of ozone depletion relative to propellant mass, while rocket-grade kerosene caused the greatest amount of warming.
On the basis of their findings, the researchers call for further research into reentry emissions and rocket plume chemistry as the space industry continues to expand and evolve. (Earth’s Future, https://doi.org/10.1029/2025EF007795, 2026)
—Sarah Stanley, Science Writer